XAUUSD D1 AnalysisHey Traders, What an exciting patterns here we have, many believe that gold might need a rest before probable 2070$ breaking, as you can see.
Dailyanalysis

GBPUSD D1 AnalysisHey Traders, Weak breakout according to last week candle and daily wave momentum near HTF key level.
Bearish is more probable.

EURUSD D1 AnalysisHey Traders, Bullish compression near HTF pivot increase the probability of reversing.
According to 3Months analysis, we expect fiber to break channel.

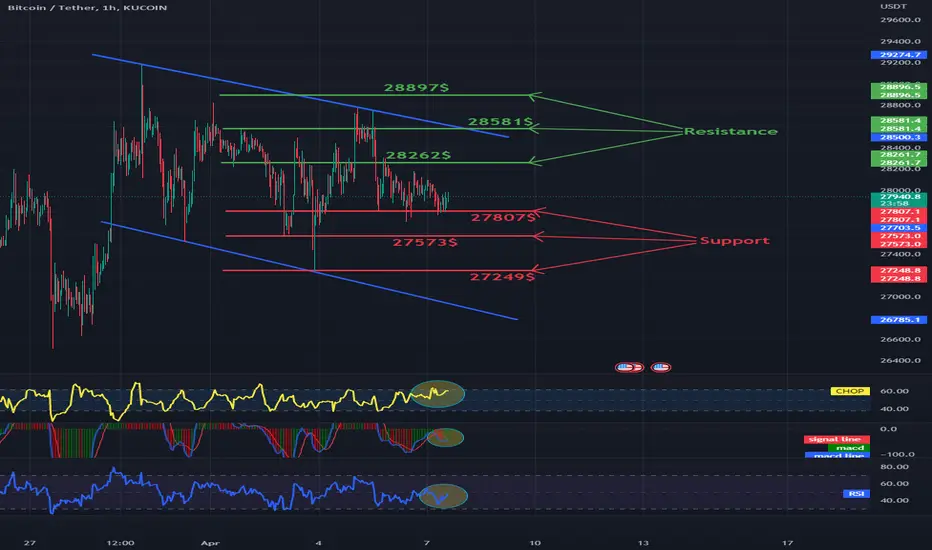
Daily BTC 1HChart - resistance and supportHello everyone, let's look at the BTC to USDT chart on a 1-hour timeframe. As you can see, the price is moving in the local downtrend channel.
Let's start with the support line and as you can see the first support in the near future is HKEX:27807 , if the support is broken then the next support is HKEX:27573 and $27249.
Now let's move to the resistance line, as you can see the first resistance is HKEX:28262 , if you manage to break it, the next resistance will be $28581 and $28897.
Looking at the CHOP indicator, we see that there is a lot of energy, the MACD is on the verge of returning to an uptrend, while the RSI has room for price growth.
Daily ETH 1DChart - resistance and supportHello everyone, I invite you to review the chart of ETH in pair to USDT, taking into account the one-day interval. First of all, using the blue lines, we can mark the uptrend channel in which the price is currently moving.
Now let's move on to marking the places of support. We will use the Trend Based Fib Extension tool to mark the supports, and as you can see, we first have a support zone from $ 1801 to $ 1759, if the price falls below this zone, then the second support at $ 1715, the third at $ 1650, then the fourth support at a price of $1569.
Looking the other way, we can also mark the places where the price should encounter resistance on the way to increases. And here we have the first very strong resistance at HKEX:1978 , the next resistance at TADAWUL:2060 , then the third resistance at HKEX:2126 , and the fourth resistance at $2195.
The CHOP index indicates that there is still some energy left for the next move. The MACD indicator remains in an uptrend. On the other hand, the RSI, despite the rebound, is in the upper part of the range, which may indicate a deeper correction.

BNB/USDT 1DInterval Targets and StoplossHello everyone, let's look at the 1D BNB to USDT chart as you can see that the price is moving below the local downtrend line.
Let's start by setting goals for the near future that we can take into account:
T1 = $317.4
T2 = $322.8
T3 = $328.3
T4 = $336.1
AND
T5 = $346.5
Now let's move on to the stop loss in case the market goes down further:
SL1 = $305.9
SL2 = $396.1
SL3 = $282.8
AND
SL4 = $265.1
Looking at the CHOP indicator, we see that there is still a lot of energy on the 1D interval, while the MACD indicator indicates that it will remain in a downtrend. The RSI indicates that it is trying to break out of a downtrend at the top.

Daily BNB 4HChart - resistance and supportHello everyone, welcome to a chart review of BNB vs USDT on a four-hour time frame. First of all, using the blue lines, we can mark the local downtrend channel in which the price is currently moving.
Now let's move on to marking the places of support. We will use the Fib Retracement tool to mark the supports, and here it is worth marking the support zone in the first order where the price is from $ 315.5 to $ 305.8, the second support at the price of $ 296.3, and then the third support at the price of 282, $6.
Looking the other way, we can also mark the places where the price should encounter resistance on the way to increases. And here we have the first strong resistance at $317.6, then we can mark the resistance zone from $323.2 to $328.7, when it manages to break it, the next resistance is at $336.5, and then the fourth at $346 $6.
The CHOP index indicates that the energy has been used. The MACD indicator is in an uptrend. On the other hand, on the RSI we see a rebound to the lower part of the range, which creates room for new increases.

Daily ETH 1DChart - resistance and supportI invite you to review the chart of ETH in pair to USDT, on a one-day interval. First of all, with the help of yellow lines, we can mark the downtrend channel, which the price overcame, while we are currently moving in the uptrend channel, for which we used blue lines.
Now let's move on to marking the places of support. We will use the Fib Retracement tool to mark the support, and as you can see we have a strong support zone from $1673 to $1552 first, but as we go lower we have a support at $1462 and then a third support at $1372.
Looking the other way, we can also mark the places where the price should encounter resistance on the way to increases. And here we have the first very strong resistance at the price of $ 1828, with which the price has been fighting for several days, when it manages to overcome it, the next very strong resistance is at the price of $ 2028.
The CHOP index, similarly to the BTC situation, indicates that we have a lot of energy for the upcoming move. The MACD indicator is on the verge of entering a downtrend. On the other hand, we see a rebound on the RSI after recent increases.

Daily BTC 4HChart - resistance and supportHello everyone, let's look at the BTC to USDT chart on a 4-hour timeframe. As you can see, the price has moved out of the local downtrend channel.
Let's start with the support line and as you can see the first support in the near future is $28187, if the support is broken then the next support is $27996, $27792 and $27517.
Now let's move on to the resistance line, as you can see the first resistance is $28525, if you manage to break it, the next resistance will be $28716, $28874, $29029 and $29253.
Looking at the CHOP indicator, we see that we have a lot of energy to move, MACD is on the verge of returning to a downtrend, while the RSI is moving in the upper part, which may affect the price's slight rebound.

Daily ETH 4HChart - resistance and supportHello everyone, let's look at the ETH to USDT chart on the 4-hour time frame. As you can see, the price has broken out of the local downtrend line.
Let's start with the support line and as you can see the first support in the near future is $1765, if the support is broken then the next support is $1745, $1725 and then $1696.
Now let's move to the resistance line, as you can see the first resistance is $1800, if it breaks through, the next resistance will be $1822, the third resistance will be $1839 and the fourth will be $1856.
Looking at the CHOP indicator, we see that we have a lot of energy, the MACD is on the verge of returning to a downtrend, while the RSI has a rebound, but with room for a deeper correction.

Big scheme of thingsThe 1h chart for TSLA indicates a major decending triangle formation (in blue) and an ascending tringle (in orange).
The ascending triangle could potentially cross the descending one today and we could see some further movement upwards.
The current RSI is overbought meaning that we could see some price correction in the early hours with some selling action. (to around $190)
My stop loss is still at $185.

Daily BTC 4HChart - resistance and supportHello everyone, let's look at the BTC to USDT chart on a 4-hour time frame. As you can see, the price has broken above the local downtrend line.
Let's start with the support line and as you can see the first support in the near future is $28114, if the support is broken then the next support is $27771, $27499 and $27227.
Now let's move on to the resistance line, as you can see the first resistance is $28745, if you manage to break it, the next resistance will be $29061, $29306 and $29551.
Looking at the CHOP indicator, we see that there is some energy left for further movement, the MACD indicates a return to the local uptrend, while the RSI shows a strong increase, although there is some room, it is worth being careful.

EUR/USD: waiting for opportunity!!!Euro/U.S. Dollar still in this support level in $1.0746 USD. but I find up bought in EUR/USD, but I will pending an opportunity that I view to long EUR/USD, and everything will depend the Forex news that will begin tomorrow.
In H1 timeframe, we see a bearish Elliot Wave Cycle that we pass, and maybe I think that we're in the opportunity to long, what we can to see a good opporutnity to long EUR/USD.
Keep pending!!!
Also, I use some new features that Trading View develop for traders like flags of Eurozone and US. Look nice!!!

XAUUSD last week and thins week gold is been very violate and unpredictable but as we know gold made new high and from where it fly it will retun, explaind with horigontal and texting. lets see what next week said also lets see on monday the 1st candle close on 4h.

SOL/USDT 4HInterval Resistance and SupportHello everyone, let's look at the SOL to USDT chart on a 4-hour timeframe. As you can see, the price is moving above the local uptrend line.
Let's start with determining the support and here we can first mark the support zone from $21.64 to $21.23, if the support is broken then the next support is $20.85, then $20.28 and $19.54.
Now let's move to the resistance line, as you can see we first have a resistance zone from $22.06 to $22.68, if we break it, the next resistance will be $23.18, $23.68 and $24.40.
Looking at the CHOP indicator, we see that we have more and more energy, the MACD indicates a local downtrend, while the RSI is rebounding, which may give room for new increases.

after result wage breakout nas100hello traders i have played the breakout on nas100 i sometimes enter on the break or the prebreak depending on how comfortable i am all trades smashed today it is possible once you learn it and get the right information from the right people then trading will be less stressful follow more

DOT/USDT 4HInterval Resistance and SupportHello everyone, let's look at the DOT to USDT chart on a 4-hour timeframe. As you can see, the price has decisively broken the local downtrend line.
Let's start with the support line and as you can see the first support in the near future is $6.36, if the support is broken then the next support is $6.25, $6.16 and $6.06.
Now let's move to the resistance line, as you can see the first resistance is $6.59, if you manage to break it, the next resistance will be $6.71, $6.80 and $6.90.
Looking at the CHOP indicator, we see that the energy is being consumed, the MACD indicates a local uptrend, while the RSI indicator has touched the upper limit and we immediately see a price correction.

Gold Moving Towards 4H targetGold is moving very sharply towards our 4H target. Smart Money Concept is very Powerful. Always do Multi timeframe analysis to improve Accuracy.

Daily BTC 4HChart - resistance and supportHello everyone, let's look at the BTC to USDT chart on a 4-hour time frame. As you can see, the price has broken out above the local uptrend line.
Let's start with the support line and as you can see the first support in the near future is $24483, if the support is broken then the next support is $24110 and $23819.
Now let's move on to the resistance line, as you can see the price is approaching the first resistance at $25187, if it manages to break it, the next resistance will be $25508 and $25943.
Looking at the CHOP indicator, we see that we have a lot of energy for the next move, the MACD maintains the local downtrend, while the RSI moves at the upper limit, which may cause a further price correction.

Gold breakouthello guys i am further expecting gold higher prices lets see how they form i am expecting this pattern i will update further just follow me for more to come if you want to enter on the breakout wait for candle close better on the 15 min

Daily BTC 1HChart - resistance and supportHello everyone, let's look at the BTC to USDT chart on a one hour time frame. As you can see, the price has broken the local downtrend line.
Let's start with determining the support line using the Trend Based Fib Extension tool and as you can see, first we have a support zone that defended the price from $ 24597 to $ 24237, if the support is broken then the next support is $ 23955, and then we have support at $ 23655.
Now let's move on to the resistance that price has on its way and here too we can mark the resistance zone from $24921 to $25107 if you manage to break it the next resistance will be $25335 then at $26025 and the next significant level is at price $27,123.
Looking at the CHOP indicator, we see that the energy is gaining a lot of strength, the MACD is close to returning to the local uptrend, while the RSI is moving sideways in the middle of the range, which makes it difficult to clearly determine the direction.

SOL/USDT 4HInterval Resistance and SupportHello everyone, I invite you to review the SOL chart on a four-hour interval. As we can see, the price has broken the downtrend channel marked with blue lines, while locally the yellow line will mark the uptrend lines.
Let's start by marking the support spots for the price and we see that the first support to consider is at $18.86, then we have the second support at $17.24 and the third support at $15.94.
Looking the other way, we can similarly determine the places of resistance that the price has to face. And here we see that the price is currently testing strong resistance at $20.55. We continue to have strong resistance at $21.83, once the price breaks it it will move towards the resistance at $23.38.
The CHOP index indicates that the energy has been used for the current increases, the MACD indicates the continuation of the uptrend, while the RSI is moving in the upper part of the range, which may indicate a temporary correction.

Daily ETH 4HChart - resistance and supportHello everyone, let's look at the ETH to USDT chart on the 4-hour time frame. As you can see, the price quickly rebounded and returned above the downtrend line.
Let's start with the support line and as you can see the first support in the near future is $1616, if the support is broken then the next support is $1569, $1531 and $1493.
Now let's move on to the resistance line, as you can see the first resistance is $1662, if you manage to break it, the next resistance will be $1743 and only when we break it can the price move on.
Looking at the CHOP indicator, we see that the energy has been used for the current large increase, the MACD indicates an uptrend, while the RSI has reached the upper limit, which may slow down the price increase for a while.
