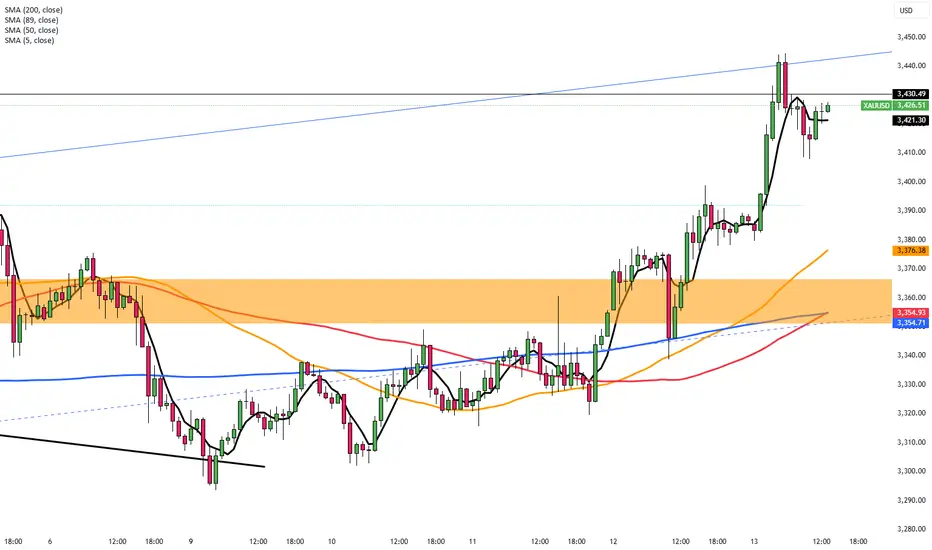
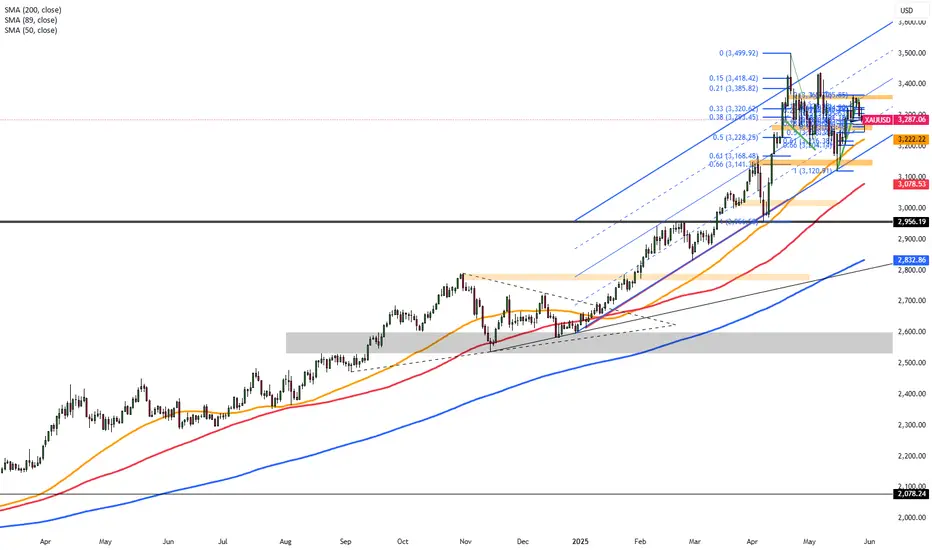
Gold Surges Amid Middle East TensionsGold surged more than 1% to exceed $3,440, approaching record levels amid a sharp rise in safe-haven demand. The gains came after Israel's strike on Iran’s nuclear facilities, fueling concerns over a wider regional conflict. Uncertainty surrounding potential US tariffs added to market jitters. Additionally, softer US inflation data increased expectations for Federal Reserve rate cuts, enhancing gold's appeal as a non-yielding asset.
Resistance is seen at $3,430, while support holds at $3,350.
Dailyanalysis
Weaker PPI Caps Dollar Strength in GBP/USDGBP/USD fell to around 1.3530 early Friday as escalating tensions in the Middle East supported demand for the US Dollar. Israel’s preemptive strike on Iran raised fears of retaliation, with Iranian officials warning of severe consequences for both the US and Israel, pressuring risk-linked currencies like the Pound. However, weaker US PPI data limited further USD strength. May’s PPI increased just 0.1%, below the 0.2% forecast, while the core PPI also came in softer. Attention now turns to the upcoming Michigan consumer sentiment report.
Resistance is at 1.3600, with support around 1.3425.

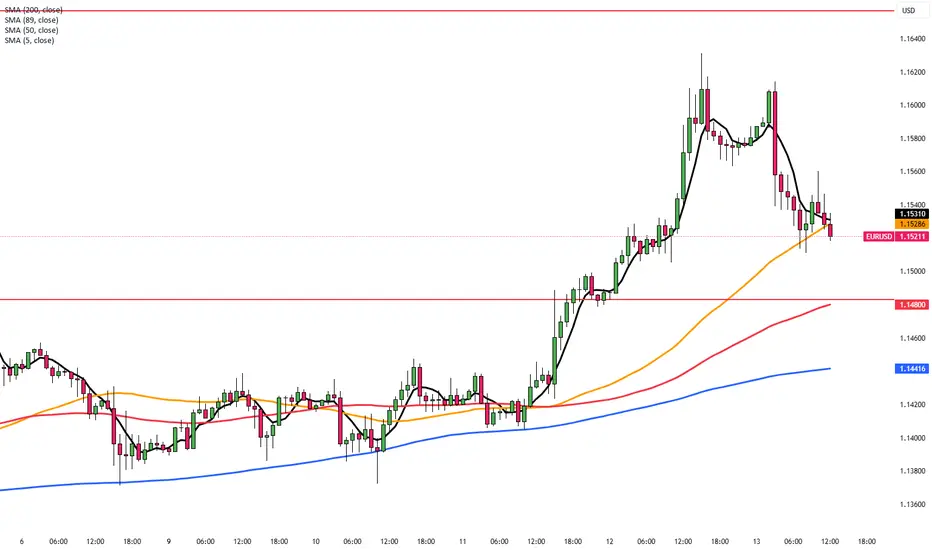
EUR/USD Slips on Geopolitical TensionsEUR/USD dropped to around 1.1530 on Friday, ending a four-day rally, as safe-haven demand lifted the US Dollar amid rising Middle East tensions.
Israel struck Iranian targets to weaken its nuclear program, prompting emergency measures. The US denied involvement but warned Iran not to target its assets.
Trump’s plan to expand steel tariffs from June 23 added trade uncertainty, while soft US inflation data kept Fed rate cut hopes alive.
Markets now await the US Michigan Sentiment report for further signals.
Resistance is located at 1.1580, while support is seen at 1.1460.
Yen Rallies as Risk Aversion ReturnsThe Japanese yen strengthened to approximately 143 per dollar, marking a third consecutive day of gains as investors turned to safe-haven assets following Israel’s preemptive strike on Iran. The operation, aimed at nuclear facilities, heightened global risk aversion. Adding to market uncertainty were renewed U.S. tariff threats by Trump. Meanwhile, BoJ Governor Ueda reiterated the bank’s readiness to raise interest rates if inflation nears the 2% target.
Resistance is at 145.30, while support stands near 142.50.

TradeCityPro | Bitcoin Daily Analysis #115👋 Welcome to TradeCity Pro!
Let’s dive into the analysis of Bitcoin and the key crypto indices. As usual, I’ll be reviewing the futures triggers for the New York session.
⏳ 1-Hour Timeframe
On the 1-hour chart, as you can see, yesterday the price was rejected from the 110256 level I previously mentioned. Following that, with the activation of the 108617 trigger, Bitcoin experienced a downward leg.
📊 Personally, I didn’t open a short position after the break of that level, but if you did, I suggest taking profits now as the price has reached the marked support zone.
🔍 As for me, I’ll wait to see how the price reacts to this support. If it breaks down, we can open a short position.
📈 However, if the price finds support here, we can once again look for a long position. The trigger for this will be found in the lower timeframes.
👑 BTC.D Analysis
Let’s move to Bitcoin dominance. Yesterday, BTC.D made a pullback to the 64.18 zone and now seems ready for another drop.
✔️ If 63.96 breaks, BTC.D could enter another bearish leg. If instead, the 64.18 ceiling breaks, it could push up toward 64.49 or even 64.67.
📅 Total2 Analysis
Looking at the Total2 index, after reaching 1.24 yesterday, it started to correct and dropped down to 1.18, touching the support with a shadow.
✨ If the 1.2 level breaks to the upside, the price could move back toward 1.24. If 1.18 breaks down, the correction may continue further.
📅 USDT.D Analysis
Now onto USDT.D. After a brief correction up to the 4.68 level, it has resumed its downward movement. If 4.64 breaks, the decline could extend toward 4.56.
💥 If instead, the 4.68 top breaks, it might bounce back up toward 4.72.
❌ Disclaimer ❌
Trading futures is highly risky and dangerous. If you're not an expert, these triggers may not be suitable for you. You should first learn risk and capital management. You can also use the educational content from this channel.
Finally, these triggers reflect my personal opinions on price action, and the market may move completely against this analysis. So, do your own research before opening any position.

TradeCityPro | Bitcoin Daily Analysis #114👋 Welcome to TradeCity Pro!
Let’s go over Bitcoin analysis and the key crypto indexes. As usual, I’ll break down the futures triggers for the New York session.
⏳ 1-Hour Timeframe
On the one hour timeframe, as you can see, a trading range has formed between the levels of 108617 and 110256. This has happened after a strong upward move with significant buying volume, and now we’re in a market correction phase.
📊 Market volume is decreasing during this corrective phase, which shows the strength of the buyers and supports the ongoing uptrend. RSI has exited the Overbuy zone and is now cooling off, which indicates that the bullish momentum has weakened for now.
📈 For a long position, the 110256 trigger seems very suitable today. If the price forms a higher low above 108617 before breaking this level, the probability of breaking 110256 increases significantly.
💥 If this trigger is activated, it’s crucial that volume rises as well. That would confirm the strength of the trend and increase the chances of the uptrend continuing. The current target for this position is 111747.
🔽 In the correction scenario, if the price stabilizes below 108617, this scenario becomes more likely and a deeper correction could follow.
✨ Personally, I won’t open a short position unless we get confirmation of a trend reversal. But if you want to go short, a break below 108617 is not a bad option and could signal a downward move.
👑 BTC.D Analysis
Bitcoin dominance has continued its downward movement, stabilized below 64.12, and is now heading toward 63.93.
⭐ If the 63.93 low is broken, the bearish move in dominance will likely continue. If it pulls back, a break above 64.12 will confirm that retracement.
📅 Total2 Analysis
Let’s look at Total2. Yesterday, it broke through the 1.2 level and is now moving toward 1.24. A breakout above this level could start the next bullish leg.
🎲 If a correction occurs, the price may drop back to 1.2 or even 1.18.
📅 USDT.D Analysis
Now for Tether dominance. This index is still sitting at the 4.56 support and is currently being held there. If 4.56 breaks, the next bearish leg can form.
🔔 In case of a retracement, USDT dominance might rise to 4.64.
❌ Disclaimer ❌
Trading futures is highly risky and dangerous. If you're not an expert, these triggers may not be suitable for you. You should first learn risk and capital management. You can also use the educational content from this channel.
Finally, these triggers reflect my personal opinions on price action, and the market may move completely against this analysis. So, do your own research before opening any position.

TradeCityPro | Bitcoin Daily Analysis #113👋 Welcome to TradeCity Pro
Let’s dive into the Bitcoin analysis and key crypto indexes. As usual in this analysis, I’ll walk you through the futures triggers for the New York session.
⏳ 1-Hour Timeframe
As you can see in the one hour timeframe, Bitcoin has continued its upward movement and reached the 110256 level and is now undergoing a correction.
✔️ If the price continues correcting, the next support level will be 108777. In case of a deeper pullback, the next area to watch is 106586.
📈 For a long position, our first trigger level is 110256, with a target of 111747.
📊 Market volume is currently increasing, and if this inflow of buy volume continues, the probability of a bullish move increases.
💥 The RSI oscillator has dropped below the 70 level. If RSI reenters the overbought zone, we’ll also get a strong momentum confirmation.
👑 BTC.D Analysis
Let’s take a look at Bitcoin Dominance. Today, it finally closed below the 64.49 level and has dropped to 64.12.
⚡️ This drop has allowed capital to flow into altcoins, and many of them are moving upward today. If 64.12 breaks, the downtrend may continue.
📅 Total2 Analysis
Moving on to Total2, this index finally broke above the 1.21 level and is now heading toward 1.24.
💫 At the moment, there is no major resistance preventing the market from continuing its upward trend. But there’s an important point regarding USDT Dominance, which I’ll cover below.
📅 USDT.D Analysis
During this bullish move in the market, the dominance of Tether hit the support at 4.56, while other indexes and most altcoins activated their triggers.
🔑 The key point here is that Tether Dominance has such a significant influence on the market that the inability to break this support has caused the entire market, including Bitcoin, to start correcting.
🔽 The 4.56 level in USDT Dominance is very important and will be the key to triggering the next bullish leg.
❌ Disclaimer ❌
Trading futures is highly risky and dangerous. If you're not an expert, these triggers may not be suitable for you. You should first learn risk and capital management. You can also use the educational content from this channel.
Finally, these triggers reflect my personal opinions on price action, and the market may move completely against this analysis. So, do your own research before opening any position.

USDJPY Analysis: MMC Resistance vs Major BOS (Technical View)🔍 Chart Summary:
The USDJPY pair is currently trading around 144.58, showing strong signs of structural buildup as it approaches a critical inflection point. This analysis leverages MMC (Market Mapping Concept) and price action structure to identify two possible directional outcomes — each grounded in key technical levels.
🧠 Key Technical Highlights:
📌 1. Expanding Wedge Pattern:
Price previously formed an expanding structure, signaling volatility and accumulation.
Expansion typically precedes major directional breakouts — either trend continuation or reversal.
📌 2. Downtrend Break Test:
A long-standing descending trendline has now been tested multiple times.
A confirmed breakout would be significant, indicating a major shift in market momentum.
📌 3. Resistance Zones:
Minor Resistance Zone around 158.00–160.00 marks a key supply area.
Watch for price action behavior if this level is tested — possible rejection or breakout continuation.
📌 4. Major Support Zone:
Support near 139.00–140.00, where price previously bounced, represents a solid floor and demand zone.
📌 5. BOS (Break of Structure):
Two BOS levels are marked:
Minor BOS (Around 146.00): Immediate reaction level to watch.
Major BOS (Around 149.00–150.00): If broken, could lead to sharp bullish continuation.
🔮 MMC Forecast Scenarios:
✅ Condition 1: Bullish Breakout Scenario
Price breaks above the descending trendline and clears the Minor BOS.
Target zone: 158.00–160.00 resistance.
Structure confirms bullish dominance if Major BOS is cleanly broken and retested.
⚠️ Condition 2: Bearish Rejection Scenario
Price rejects from current trendline or Minor BOS and reverses.
Potential drop toward Major Support around 140.00.
Watch for reversal confirmation with bearish engulfing candles or re-entry into expanding zone.
🧭 MMC Outlook Summary:
The chart is setting up for a key decision point. The market will either validate a bullish breakout structure or revert back into bearish continuation. These scenarios align with the MMC mapping method, providing clear conditions for traders to follow without bias.

TradeCityPro | Bitcoin Daily Analysis #112👋 Welcome to TradeCity Pro
Let’s dive into the analysis of Bitcoin and key crypto indexes. As usual, in this analysis I’ll review the futures triggers for the New York session.
⏳ 1-Hour Timeframe
Yesterday, Bitcoin finally broke through the resistance zone it had formed. As you can see, it pushed through this level with strong buying volume and is now moving toward 108777.
🔍 If you entered a position using yesterday’s triggers, I’d be glad to hear about it in the comments. Your feedback gives me great energy.
⭐ Today, I cannot provide a specific trigger because the market has already made its move. If you do not have an open position, it is better to wait for a new market structure and then identify a fresh trigger.
💥 At the moment, I expect Bitcoin’s upward movement to continue toward 108777. Market volume is strongly supporting the trend and is aligned with price action. RSI is also in the overbought zone, indicating strong buyer presence. If RSI stays above 70, the sharp upward movement is likely to continue.
📊 If a market correction occurs, the price could pull back to the zone I marked. In future analyses, I will review triggers for both trend continuation and possible reversals.
👑 BTC.D Analysis
Bitcoin dominance formed a higher low above 6449 and has now broken the 6467 resistance, signaling the beginning of a new bullish leg.
⚡️ If this upward move continues, Bitcoin dominance may climb further. However, if a pullback to 6467 happens, altcoins could see a strong upward move as well.
📅 Total2 Analysis
Looking at Total2, this index was supported at 114 yesterday and is now moving toward 117.
📈 If Bitcoin dominance starts to drop, Total2 will likely break above 117 and begin a main bullish trend.
📅 USDT.D Analysis
Now for Tether dominance. After forming a lower high below 479, it broke below the 472 support and is now heading toward 464.
✅ In my view, this movement toward 464 is likely to continue, and as that happens, the overall crypto market is expected to keep moving upward.
❌ Disclaimer ❌
Trading futures is highly risky and dangerous. If you're not an expert, these triggers may not be suitable for you. You should first learn risk and capital management. You can also use the educational content from this channel.
Finally, these triggers reflect my personal opinions on price action, and the market may move completely against this analysis. So, do your own research before opening any position.

TradeCityPro | Bitcoin Daily Analysis #111👋 Welcome to TradeCity Pro!
Let’s take a look at Bitcoin and key crypto indicators. As usual in this analysis, I’ll review the futures triggers for the New York session.
⏳ 1-Hour Timeframe
As you can see in the 1-hour timeframe, none of our triggers were activated yesterday and Bitcoin has been ranging.
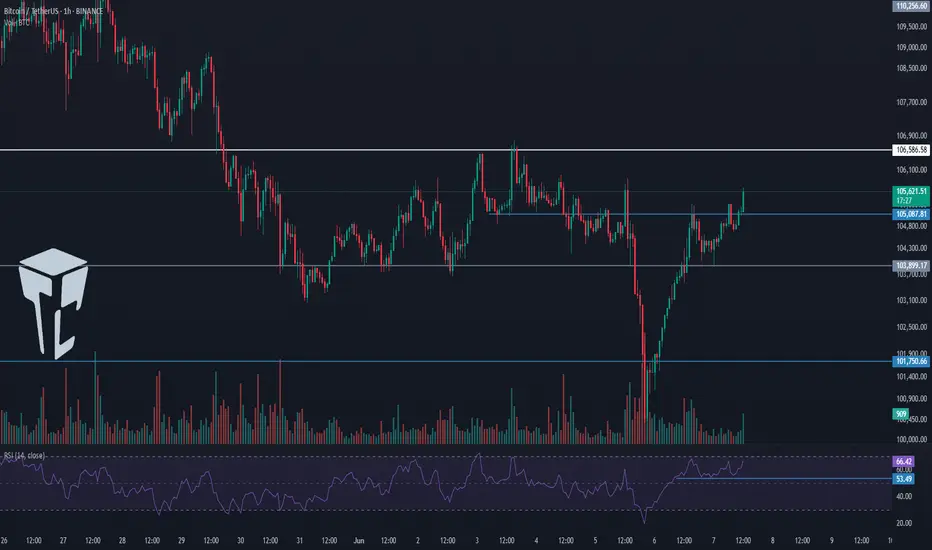
⭐ There was an important RSI level at 53.49, which was tested multiple times. I mentioned that breaking this level could trigger a slight correction — and that’s exactly what happened. The price pulled back slightly to 105087, retested this zone, and now RSI has returned above 53.49. Price is also moving with strong bullish momentum toward the 105851 resistance.
📊 The buying volume entering the market is quite strong, and if this increase continues, the price could begin an upward move. So in terms of both momentum and volume, we have bullish confirmation and can enter a position if the triggers activate.
📈 For a long position, the trigger we’re watching is 105851. While the main resistance is at 106586, I prefer to take the risk and open the position earlier, because I think the 106586 break won’t provide a clean entry and would be harder to act on.
✨ So my chosen trigger for a long position is 105851. Given the rising volume and high RSI momentum, we have the confirmations needed to open this trade.
🔽 For a short position, the first trigger is the break of 105087. This is a risky position since we haven’t yet confirmed a trend reversal — this would be the first signal if a downtrend begins. Personally, I’ll wait for confirmation of bearish momentum before opening a short.
👑 BTC.D Analysis
Bitcoin Dominance is still below the 64.67 level and is ranging under this resistance.
🧩 A break above 64.67 would confirm a bullish move in dominance. A break below 64.49 would signal a bearish reversal.
📅 Total2 Analysis
Total2 is ranging below the 1.15 level. A break above this zone could initiate a bullish move.
🔔 On the bearish side, the current trigger is the 1.13 level. We need to wait for this level to be broken for a trend reversal confirmation.
📅 USDT.D Analysis
Tether Dominance stabilized below the 4.79 zone yesterday and has now pulled back to it, preparing for a possible second leg downward.
🔑 If that happens, the crypto market could move upward. However, if USDT.D rises back above 4.79, its uptrend could continue.
❌ Disclaimer ❌
Trading futures is highly risky and dangerous. If you're not an expert, these triggers may not be suitable for you. You should first learn risk and capital management. You can also use the educational content from this channel.
Finally, these triggers reflect my personal opinions on price action, and the market may move completely against this analysis. So, do your own research before opening any position.

TradeCityPro | Bitcoin Daily Analysis #110👋 Welcome to TradeCity Pro!
Let’s dive into the Bitcoin analysis and major crypto indexes. In this review, as usual, I’ll cover the key futures triggers for the New York session.
⏳ 1-Hour Timeframe
As you can see in the 1-hour timeframe, Bitcoin formed a higher low yesterday and has now reached the 105087 resistance. It seems likely that this level will be broken soon.
✨ Currently, a candle has closed above 105087, but price hasn’t yet confirmed a breakout, and the move hasn’t taken off.
📈 For a long position, we can enter once the price confirms a breakout above this level. If 105087 breaks, price could target 106586. The main long position will be opened upon breaking 106586.
🛒 Strong buying volume is a very good trigger for this setup. RSI entering the Overbought zone would also provide a powerful momentum confirmation, and price could rise accordingly.
💥 If the current upward move fails and price falls below the recent low, we can open a short position upon breaking 103899, targeting 101750.
⚡️ The 53.49 level on RSI is critical — its break would serve as a strong confirmation for the short position.
👑 BTC.D Analysis
Looking at Bitcoin Dominance, yesterday it once again moved toward 64.67, but failed to break it and is now heading downward after being rejected from that resistance.
🔑 The trigger for bullish continuation remains 64.67, while 64.49 serves as the trigger for a bearish move.
📅 Total2 Analysis
This index formed a higher low at 1.13 yesterday and is now testing the 1.15 resistance. If this level breaks, the price could head toward 1.17 and 1.18.
📊 A break above 1.15 would be a valid long trigger. However, if price is rejected and moves downward, breaking 1.13 could send it back toward 1.1.
📅 USDT.D Analysis
USDT Dominance closed below the 4.79 level yesterday and is now moving toward 4.70. If this continues, the crypto market could see bullish momentum.
🧩 However, if dominance moves back above 4.9, the next bullish leg in USDT.D could begin.
❌ Disclaimer ❌
Trading futures is highly risky and dangerous. If you're not an expert, these triggers may not be suitable for you. You should first learn risk and capital management. You can also use the educational content from this channel.
Finally, these triggers reflect my personal opinions on price action, and the market may move completely against this analysis. So, do your own research before opening any position.
TradeCityPro | Bitcoin Daily Analysis #109👋 Welcome to TradeCity Pro!
Let’s dive into the Bitcoin analysis and key crypto indicators. As usual, I’ll walk you through the futures triggers for the New York session.
⏳ 1-Hour Timeframe
In the 1-hour chart, as you can see, yesterday Bitcoin activated the short trigger at 103899 and dropped below the 101750 level. This setup gave an opportunity to open a short position—hopefully you took advantage of it.
✨ After that bearish leg, the downtrend ended and the price began to rise again, now reaching back to the 103899 level.
🔍 If the price gets rejected once from 103899 and then forms a higher low compared to 101750, we can consider a long position on subsequent attempts—if 103899 breaks. If the price breaks this level sharply, the next long triggers will be 105087 and 106586.
📉 For today's short position, we can enter on a pullback to 103899. Personally, I’ll look for a bearish trigger in lower timeframes; if confirmed, I’ll open a short. The main bearish trigger remains the break of 101750.
📊 Currently, volume favors buyers, but we’ve seen divergence during this bullish leg, and volume increased on the last bearish move. So, I still see a higher probability of the market turning bearish rather than bullish.
👑 BTC.D Analysis
Looking at Bitcoin dominance, yesterday it made an upward move to 64.67 after breaking through 64.23. This 64.67 level is a strong resistance, and as shown, the dominance got rejected there.
💫 If this rejection is confirmed, there's a high chance of a retracement back to 64.23. In that case, if the market continues to drop, Bitcoin will likely be a better short than altcoins.
☘️ However, if 64.67 breaks, dominance could initiate another bullish wave.
📅 Total2 Analysis
As for Total2, after activating the 1.16 and 1.13 triggers, it dropped to the 1.1 zone and is now making a pullback to its previous support—similar to Bitcoin.
💥 For a long position, we’ll need a Dow Theory confirmation. For a short, we can wait for a pullback to 1.13 and look for a bearish confirmation to enter.
📅 USDT.D Analysis
Now onto Tether dominance: yesterday, after breaking 4.79, it moved up to 4.98. Following that, it reversed and is now back down to 4.79.
🔑 If 4.79 breaks, Tether dominance could drop further to 4.70 and 4.64. But if it holds and finds support there, another bullish leg may begin.
❌ Disclaimer ❌
Trading futures is highly risky and dangerous. If you're not an expert, these triggers may not be suitable for you. You should first learn risk and capital management. You can also use the educational content from this channel.
Finally, these triggers reflect my personal opinions on price action, and the market may move completely against this analysis. So, do your own research before opening any position.

TradeCityPro | Bitcoin Daily Analysis #108👋 Welcome to TradeCity Pro!
Let’s dive into the analysis of Bitcoin and key crypto indices. As usual, in this analysis, I’ll review the futures session triggers for New York.
⏳ 1-Hour Timeframe
As you can see in the 1-hour timeframe, yesterday the 105087 trigger was activated, and now after a pullback to that level, the price is heading toward the 103899 support.
💥 If you entered a short position based on the 105087 trigger, you can hold it until 103899. If you haven’t opened a position yet, you can consider today’s triggers.
🔽 The first short trigger for today is the 103899 level. A break below this level can start a major bearish move. Personally, I’ll enter a short if this level breaks.
⚡️ Breaking below 38.95 on the RSI will give us a suitable momentum confirmation. If selling volume increases, the probability of a bearish move will rise.
📈 For long positions, our first trigger is the same 105087 level. If a higher low is formed compared to 103899 and this level breaks, it will provide a good long opportunity.
💫 The main long trigger is 106586. If this level is broken, the uptrend can resume and price could move toward higher resistance levels.
👑 BTC.D Analysis
Looking at Bitcoin Dominance, a range box has formed between 63.93 and 64.23.
✨ A break above 64.23 confirms bullish continuation, while a break below 63.93 confirms a bearish trend in dominance.
📅 Total2 Analysis
Moving to Total2, yesterday it closed below 1.17, and now after a pullback, it's heading toward 1.16.
✅ If 1.16 breaks, a short position can be opened. If the downward move turns out to be fake, a break above 1.18 gives us a long trigger.
📅 USDT.D Analysis
Looking at Tether Dominance, yesterday it confirmed above 4.70 and is now moving toward 4.79. A break of 4.79 could signal a continuation of the upward move.
📊 If it closes back below 4.70, the price could move toward 4.64. A break below 4.64 would signal a bearish trend in USDT dominance.
❌ Disclaimer ❌
Trading futures is highly risky and dangerous. If you're not an expert, these triggers may not be suitable for you. You should first learn risk and capital management. You can also use the educational content from this channel.
Finally, these triggers reflect my personal opinions on price action, and the market may move completely against this analysis. So, do your own research before opening any position.

TradeCityPro | Bitcoin Daily Analysis #107👋 Welcome to TradeCity Pro!
Let’s dive into Bitcoin and key crypto indices. As usual, in this analysis I’ll walk you through the triggers for the New York futures session.
⏳ 1-Hour Timeframe
As you can see in the 1-hour timeframe, yesterday the price made another upward move and formed its resistance at the 106586 level and a bottom at 105087.
📈 For a long position, considering the uptrend in higher timeframes such as the daily and weekly, we can enter upon a breakout of 106586. A bounce of the RSI from the 50 level can act as a good confirmation for the position.
📊 Buying volume is currently increasing, but the price is still sitting on the support bottom and hasn’t moved upward yet. If this volume inflow continues, a breakout of 106586 would be a strong confirmation for a long position.
🔽 For a short position, the first trigger is the breakdown of the 105087 bottom. If this level is broken, we can enter a short. The main short trigger is at 103899.
💥 Conditions are currently favorable for a short position, and the current candle has strong bearish momentum. So, if 105087 breaks, a short position would be appropriate.
👑 BTC.D Analysis
Let’s look at Bitcoin Dominance. After a pullback to the 64.23 level, the next bearish leg continued to 63.93. If 63.93 breaks, the downtrend is likely to continue and the price could fall to 63.50.
✅ If 63.93 holds, dominance may start moving back up toward 64.67.
📅 Total2 Analysis
Now let’s check out Total2. This index is still below the 1.18 level, and breaking this level would confirm a bullish move.
✨ A new bottom has also formed at 1.17. If this level breaks, we can look for a short position.
📅 USDT.D Analysis
Now to Tether Dominance. This index has formed a box between 4.64 and 4.70.
🔔 A breakout above 4.70 could initiate a bullish move in dominance, while a breakdown below 4.64 could trigger a bearish move.
❌ Disclaimer ❌
Trading futures is highly risky and dangerous. If you're not an expert, these triggers may not be suitable for you. You should first learn risk and capital management. You can also use the educational content from this channel.
Finally, these triggers reflect my personal opinions on price action, and the market may move completely against this analysis. So, do your own research before opening any position.

TradeCityPro | Bitcoin Daily Analysis #106👋 Welcome to TradeCity Pro!
Let’s dive into Bitcoin and the key crypto indices. As usual, I’ll be reviewing the futures triggers for the New York session.
⏳ 1-Hour Timeframe
On the 1-hour chart, the 105800 trigger was activated yesterday and Bitcoin’s trendline was broken. However, the price failed to hold above 105800 and quickly fell back below, making it a fake breakout.
⚡️ For now, I’m keeping the 105800 level as the long trigger to observe how the price reacts. We need to wait for a clear reaction to this zone to better refine the trendline. On the next test, if it breaks successfully, we can enter a long position.
🔍 If a higher low forms above 103899 and the RSI finds support above 50, the likelihood of breaking the 105800 resistance increases, potentially leading to a stronger upward move.
✨ On the short side, since the 105800 breakout failed, bearish momentum could increase. A breakdown below 103899 would trigger a short position with a target at 10750.
If you’ve already opened a short position before this trigger, be aware that it's a risky trade and shouldn’t be relied on as a long-term position.
👑 BTC.D Analysis
The downtrend in Bitcoin dominance has continued following the breakdown of 64.29, and now it has also broken below 64.15, heading toward 63.87.
⭐ For now, BTC dominance is temporarily bearish. If the market corrects, Bitcoin might fall harder, but if the market recovers, altcoins could perform better — unless BTC dominance reverses trend.
📅 Total2 Analysis
Yesterday, the long trigger at 1.16 was activated, and now the index has reached 1.18. Thanks to falling Bitcoin dominance, altcoins have outperformed Bitcoin.
✔️ If 1.18 breaks, the uptrend could continue. Key levels to watch next are 1.21 and 1.24.
📅 USDT.D Analysis
This index formed a lower high below 4.79 yesterday and is now retesting 4.70 after breaking below it.
🎲 If this pullback gets rejected, it confirms weakness in USDT dominance — which supports long positions on altcoins. However, if USDT.D climbs back above 4.70 and it turns into a fake breakdown, there’s a strong chance it could revisit 4.79 or even break that resistance.
❌ Disclaimer ❌
Trading futures is highly risky and dangerous. If you're not an expert, these triggers may not be suitable for you. You should first learn risk and capital management. You can also use the educational content from this channel.
Finally, these triggers reflect my personal opinions on price action, and the market may move completely against this analysis. So, do your own research before opening any position.

ECB Signals More Action as Eurozone Outlook WaversECB Signals More Action as Eurozone Outlook Wavers
EUR/USD rebounded to near 1.1370 in Monday’s Asian session as the US Dollar weakened after legal shifts in tariff rulings. On Thursday, the US Court of Appeals backed Trump’s tariff policy, overturning Wednesday’s lower court decision that had declared his April 2 executive orders unlawful.
Trade tensions escalated as Trump announced plans to double tariffs on steel and aluminum imports to 50%. In response, the European Commission warned it would retaliate, despite both sides agreeing to accelerate talks after extending the EU tariff deadline to July 9.
Meanwhile, Eurozone economic concerns persist. ECB’s Klaas Knot cited inflation uncertainty, while François Villeroy de Galhau said policy normalization is likely not finished, suggesting more action ahead.
The key resistance is located at 1.1460 and the first support stands at 1.1300.

Yen Rises Amid Trump Tariff Threat and China DisputeThe Japanese yen rose to around 143.5 per dollar on Monday, marking its third straight session of gains as rising global trade tensions lifted demand for safe-haven currencies. The move followed President Trump’s threat on Friday to double tariffs on steel and aluminum imports to 50% starting June 4. Japanese steelmakers like JFE Holdings and Kobe Steel fell, while Nippon Steel was less affected after Trump praised its planned merger with U.S. Steel. Meanwhile, U.S.-China tensions grew as China denied Trump’s claim of breaching a recent Geneva trade agreement. On the domestic front, Japan’s Q1 capital spending beat expectations, with investment rising across both manufacturing and services, reflecting solid internal momentum.
The key resistance is at $143.50 meanwhile the major support is located at $143.00.

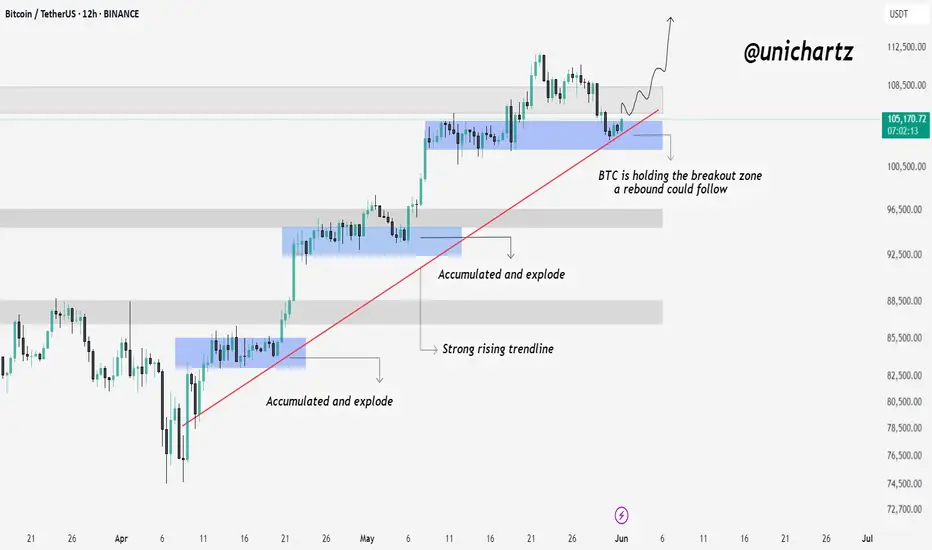
Bitcoin Retests Breakout Zone – Will It Bounce Again?Hello traders, here is the Quick CRYPTOCAP:BTC update
Bitcoin is currently holding right at the previous breakout zone, which also aligns with the rising trendline and previous accumulation area.
This zone has acted as a strong launchpad in the past — where BTC accumulated and exploded higher. If buyers defend this level again, we could see another rebound play out from here.
As long as BTC holds this structure, the bullish trend remains intact.
Bitcoin Correction or Trap? Watch This Support Zone CloselyExclusive #Bitcoin Update
I got lots of DMs, people are asking:
Do you think the bull trend is finished, or is it just a correction and pullback?
Guys, first stop panicking.
This is exactly what the shark wants you to do. Don’t let them shake you out.
Let’s get to the chart:
My previous chart got invalidated, and the current situation is that CRYPTOCAP:BTC is defending strongly around the $104.8K to $104.3K support zone.
According to the FIB level, we’re currently at the 0.383 level. This area has previously served as strong resistance, so it can now function as effective support.
If bulls manage to bounce from this area and push above $107K, we could trigger a sharp move toward the $112K–$113K liquidation zone,
where we have almost $12B in short liquidations acting as a strong magnet!
Let's talk about the worst-case scenario, in case we break down below this supportive area, then we have
200 EMA and a strong support around $101.4k to $101.8k.
I’ll keep you posted as things unfold. If you find my updates helpful, don’t forget to like and follow for more! #Bitcoin2025
CRYPTOCAP:BTC BITSTAMP:BTCUSD BINANCE:BTCUSDT

Yen Strengthens Beyond 144 on InflationThe Japanese yen rose past 144 per dollar, extending gains after Tokyo’s core inflation beat expectations, increasing the likelihood of a 25 bps BOJ rate hike in July.
BOJ Governor Kazuo Ueda said recent forecast adjustments were due to global risks and lower oil prices but reaffirmed the short-term policy stance remains focused on the 2% inflation goal. The yen also gained from safe-haven flows after a U.S. court reinstated Trump’s reciprocal tariffs.
Resistance is at 144.50, with further resistance at 145.40 and 146.10. Support levels stand at 143.50, 143.00, and 142.10.

Fed Minutes and Tariff Delay Support SilverSilver traded near $33.15 on Thursday, steady after Fed minutes showed a cautious rate stance amid economic uncertainty and trade tensions. The Fed held rates at 4.25%–4.5%, awaiting clearer data. Bond market volatility and questions about the dollar’s role weighed on sentiment. Silver remains under pressure from trade risks but gains support from being undervalued versus gold and a fifth year of global supply deficits. Markets now await US GDP and PCE data. Trump’s delay of the EU tariff and Brussels’ pledge to speed talks slightly increased risk sentiment.
The first critical support for gold is seen at 33.80 and the first resistance is located at 32.30.

Gold Extends Decline as Safe-Haven Demand WeakensGold fell below $3,260 on Thursday, its fourth straight decline, as easing tariff fears reduced safe-haven demand. The drop followed a U.S. court ruling that Trump exceeded his authority in imposing tariffs, ordering their removal. The decision is expected to be appealed. Fed minutes showed a cautious stance as officials assess policy impacts, citing risks of both inflation and job losses. Meanwhile, U.S. gold exports to Switzerland surged in April after metal tariffs were lifted, shifting global trade flows.
The first critical support for gold is seen at the $3245 and the first resistance is located at $3295.
Sterling Holds Ahead of U.S. GDPGBP/USD trades near 1.3435 on Thursday, pressured by a stronger US Dollar after a court blocked Trump’s “Liberation Day” tariffs, ruling he lacked authority to impose them. Markets now await preliminary US Q1 GDP data. Fed minutes showed rising uncertainty, with policymakers favoring a cautious, steady rate path. In the UK, food inflation rose for a fourth month, prompting Barclays to delay its rate cut forecast to February 2026, which may support the Pound.
The first critical support for gold is seen at 1.3425 and the first resistance is located at 1.3600.
