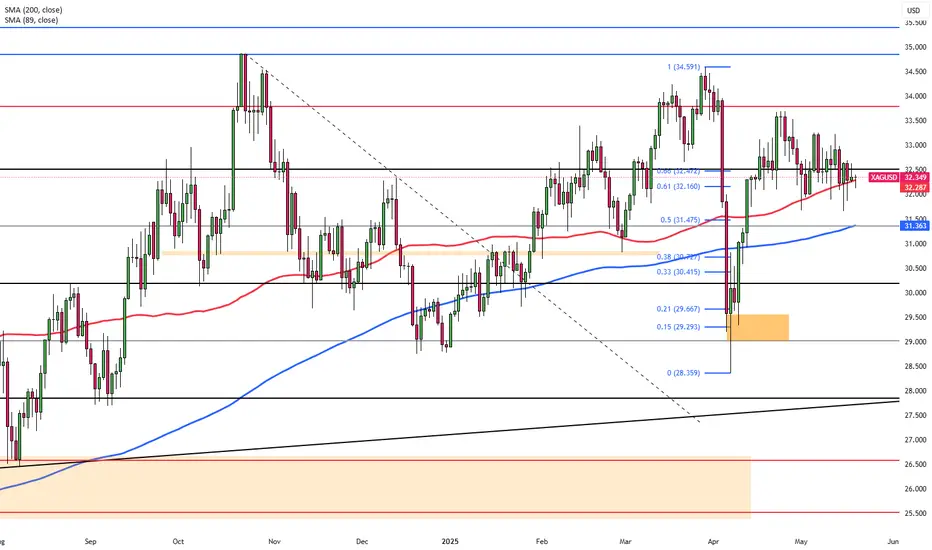
Silver Holds Near $32.60 on CeasefireSilver hovered around $32.20 per ounce during Tuesday’s Asian session, easing for a third consecutive day as safe-haven demand faded. The hopes for a Russia-Ukraine ceasefire, announced by U.S. President Trump after a call with President Putin, tempered market uncertainty and weighed on silver’s appeal.
However, losses were limited following Moody’s downgrade of the U.S. credit rating and a series of weak economic data, including CPI, PPI, and retail sales. These reinforced expectations for two Fed rate cuts this year, likely starting in September, according to the CME FedWatch Tool projections.
Strong industrial demand, especially from the solar sector, continues to support silver’s longer-term outlook. Markets now look for upcoming Fed speeches for further direction.
XAG/USD faces resistance at $32.50, with higher levels at $33.80 and $34.20. Support is seen at $31.40, followed by $30.20 and $29.80.
Dailyanalysis
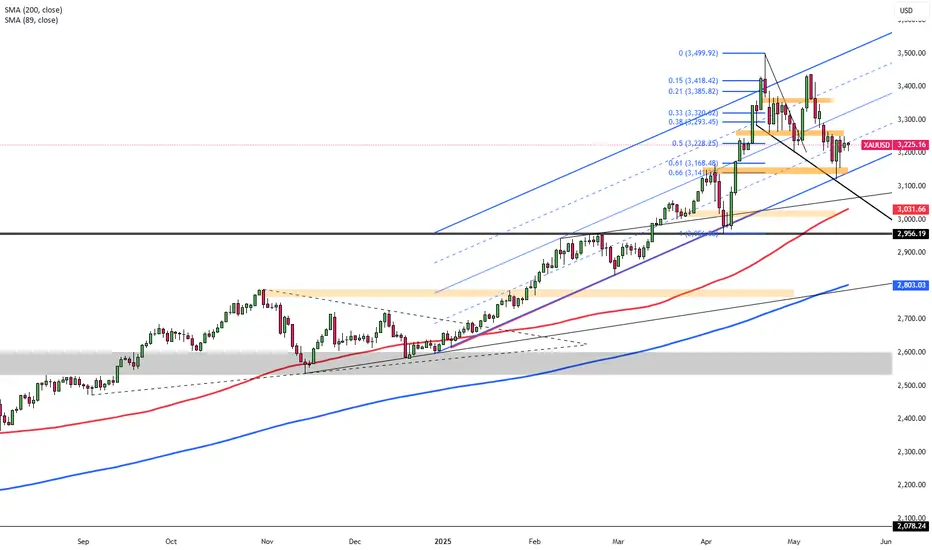
Gold Slips with Ceasefire HopesGold declined below $3,320 per ounce as hopes for a ceasefire between Russia and Ukraine reduced the appeal of safe-haven assets. The drop followed a statement by US President Donald Trump announcing that both nations had agreed to "immediate" talks, potentially without US involvement, after a conversation with Russian President Vladimir Putin.
On Monday, gold had gained 0.6% in response to Moody’s downgrade of the US credit rating to Aa1 from Aaa, which raised concerns about long-term debt sustainability. However, with geopolitical tensions easing and investors awaiting fresh comments from Federal Reserve officials, gold reversed course.
XAU/USD now finds resistance at $3,250, with further levels at $3,300 and $3,350. On the downside, support is seen at $3,120, followed by $3,030 and $2,956.
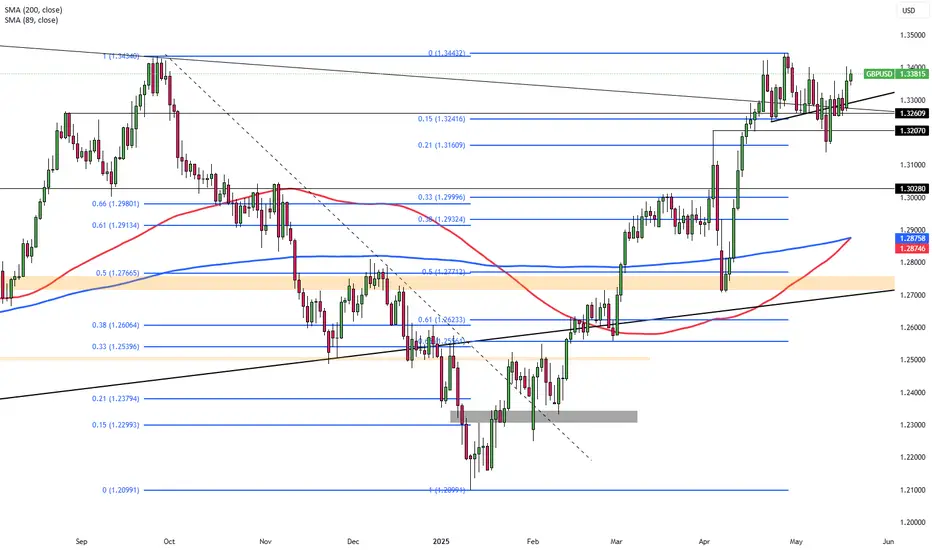
Pound Climbs Above $1.336 on Strong UK DataThe British pound rallied past $1.336, reaching a one-week high and inching closer to its April peak of $1.34. The move was fueled by renewed optimism after the UK and EU reached a comprehensive post-Brexit agreement covering energy cooperation, defense partnerships, and fisheries rights through 2038.
Supporting the pound further, recent UK data exceeded expectations. GDP rose 0.7% in Q1 and 1.3% annually, easing pressure on the Bank of England to cut interest rates aggressively. Although rate reductions remain on the table, the strength of the economic rebound gives policymakers more flexibility.
Despite some concerns about rising unemployment and slowing wage growth, the upbeat GDP print has helped offset fears of an impending recession. Meanwhile, the US dollar continued to weaken following Moody’s credit downgrade, providing additional support to the pound.
GBP/USD now faces resistance at 1.3450, with higher targets at 1.3550 and 1.3700. Support is located at 1.3160, followed by 1.3000 and 1.2960.
Yen Steadies on US Credit DowngradeThe Japanese yen held firm near 144 per dollar, marking its fourth straight session of gains, bolstered by a weaker US dollar in the wake of Moody’s downgrade of the US credit rating. The move, prompted by fiscal concerns and rising deficits, dented dollar confidence globally.
Despite this, Japan’s own economic data weighed on sentiment, with GDP shrinking by 0.2% in Q1, its first contraction in a year and worse than anticipated. Investors are also closely watching the upcoming Japanese trade data with concerns about the impact of potential new US tariffs. A third round of US-Japan trade talks is set to begin in Washington by the end of the week, led by Japan’s chief negotiator Ryosei Akazawa.
USD/JPY faces immediate resistance at 148.60, with higher levels at 149.80 and 151.20. Key support is seen at 139.70, followed by 137.00 and 135.00.

TradeCityPro | Bitcoin Daily Analysis #96👋 Welcome to TradeCity Pro!
Let’s move on to the Bitcoin and major crypto index analysis. As usual, I’m going to review the triggers for the New York futures session.
⏳ 1-Hour Timeframe
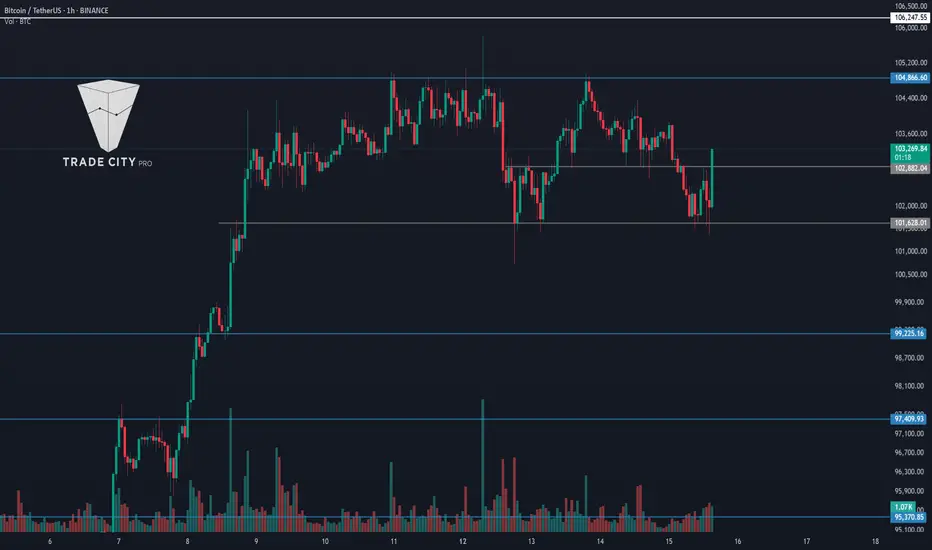
As you can see on the 1-hour chart, yesterday we had a bullish move that extended up to the 106247 level.
🔍 However, as I previously mentioned, this is a very sensitive zone for price action, and we might see sharp reactions from it. That’s exactly what happened—price faced a strong rejection after reaching this level and dropped down to 102882.
📊 Market volatility is currently very high, and the risk of getting stopped out in either direction is significant. So we need to be cautious and avoid getting caught in fake moves.
💥 Personally, I recommend avoiding trades right after such volatility and waiting for a new structure to form. But if you’re planning to take a position, keep the risk very low.
⚡️ For a short position, our first trigger is a break below 101628. Alternatively, we could also enter based on how the price reacts to 102882.
📈 For a long position, we currently have no clear setup until price structure forms. The only long triggers I can give for now are the breakouts of 104800 and 106247.
👑 BTC.D Analysis
Bitcoin dominance has started a new uptrend and has even closed above 63.71. Given the healthy structure of this trend, if 64.04 breaks, we can confirm a full bullish breakout for BTC.D.
💫 If BTC dominance continues rising while the market moves up, Bitcoin will likely outperform most altcoins.
📅 Total2 Analysis
Looking at Total2, the 1.17 support broke yesterday, and now this index is set up for further downside correction. For now, it seems the market is in a decision-making phase.
🧲 If we get a lower low and lower high below 1.17, the chance of a move toward 1.1 increases significantly.
📅 USDT.D Analysis
Now for USDT dominance—yesterday it faked out the 4.60 level twice and is currently holding above 4.70, heading toward 4.82.
🧩 If this move turns out to be a fake and price stabilizes below 4.70 again, it would give us a strong signal for a bullish market and a bearish turn for USDT dominance.
❌ Disclaimer ❌
Trading futures is highly risky and dangerous. If you're not an expert, these triggers may not be suitable for you. You should first learn risk and capital management. You can also use the educational content from this channel.
Finally, these triggers reflect my personal opinions on price action, and the market may move completely against this analysis. So, do your own research before opening any position.

BTC/USD 4H Chart targets and stoplossHello everyone, let's look at the 4H BTC to USD chart, in this situation we can see how the price has come out of the downtrend channel on top, and the upward movement after leaving the channel is close to the height of the downtrend channel.
Let's start by defining the targets for the near future that the price has to face:
However, at the beginning we can see how the price is struggling with a strong resistance zone from $103882 to $108349. Next, we have potential targets:
T1 = 112,740 USD
T2 = 116,525 USD
Т3 = 120,000 USD
Now let's move on to stop-loss in case the market continues to fall:
SL1 = 100,551 USD
SL2 = 97,446 USD
SL3 = 92,525 USD
SL4 = 88,286 USD
The RSI indicator shows that in the 4H interval, the movement is at the upper limit of the range, which clearly affects the sideways movement on the chart.

TradeCityPro | Bitcoin Daily Analysis #95👋 Welcome to TradeCity Pro!
Let’s dive into the Bitcoin analysis and key crypto market indicators. As usual, I’ll break down the triggers for the New York futures session.
⏳ 1-Hour Timeframe
As you can see on the 1-hour chart, yesterday the price bounced from the 102882 level and is now moving toward 104204.
🔍 I mentioned yesterday that if the price prints a higher low above 101628, we could open a position on a breakout of 104204. That scenario played out, and now that the price has risen from 102882, we’re approaching 104204. So, a breakout above 104204 is a long trigger.
📈 The next long trigger is at 104800, and breaking that level could push the price toward the main resistance at 106247.
💥 For a short position and bearish confirmation, ideally, we’d want to see a lower high below 104204. If that happens, a break below 102882 becomes a valid short trigger.
🔽 The main short trigger and confirmation of a bearish reversal would come with a break of 101628.
📊 Keep an eye on volume—if volume increases as the price approaches any of these levels, the chances of a breakout increase significantly.
👑 BTC.D Analysis
Bitcoin Dominance moved slightly higher yesterday but got rejected from 63.71 and failed to reach 63.95.
✨ Currently, BTC.D is heading toward 63.30. If this level breaks, it could trigger a new bearish leg down toward 62.65 and 62.07.
📅 Total2 Analysis
Looking at Total2, this index couldn’t hold below 1.17 yesterday and bounced, currently reaching 1.19.
✔️ If the price holds above 1.19, that would be the first confirmation of bullish momentum. However, this move might also just be a pullback to 1.19—so if price gets rejected here, a break of 1.17 becomes the next short entry.
📅 USDT.D Analysis
Tether Dominance was rejected from 4.70 and may be heading back toward the 4.51 support.
🧩 A break below 4.60 could give us an early bearish signal. The main short trigger remains the 4.51 level.
❌ Disclaimer ❌
Trading futures is highly risky and dangerous. If you're not an expert, these triggers may not be suitable for you. You should first learn risk and capital management. You can also use the educational content from this channel.
Finally, these triggers reflect my personal opinions on price action, and the market may move completely against this analysis. So, do your own research before opening any position.

TradeCityPro | Bitcoin Daily Analysis #94👋 Welcome to TradeCity Pro!
Let’s go over the Bitcoin analysis and major crypto indexes. As usual, I’ll cover the New York futures session triggers for you.
⏳ 1-Hour Timeframe
As you can see, yesterday the price was rejected from the 104204 level and formed a lower high compared to 104800. Currently, there's a strong chance the short trigger will activate, so let’s review those triggers.
🔽 For a short position, the area where the price is currently consolidating—102882—is a suitable trigger. If this level breaks, the price could drop to 101628.
📊 One note about this trigger: the zone between 102882 and 101628 is a major support range. Every time the price has entered it, it’s formed long wicks and exited with strong bullish candles.
✨ So, if we enter a position based on this trigger, the volatility of the candles increases the chance of getting stopped out. On the other hand, using a large stop loss isn’t ideal either, since these trades go against the main trend and work better with a tight stop to hit the target faster.
💥 The next trigger is the break of 101628, which seems more reasonable. Breaking this level confirms a deeper correction and opens the path toward levels like 99225.
✔️ For a long position, if the price prints a higher low above 101628, we can confirm a bullish bias with the break of 104204. A higher low indicates strong bullish momentum, allowing us to use a slightly riskier trigger.
⚡️ However, if the price falls to the bottom of the box and then returns to the top, the main long trigger becomes a breakout above 104800.
🔍 Today, most of the market volume is on the sell side, and red candles are getting solid volume, so a correction to the box bottom seems likely. Either way, we have to wait for the triggers to activate.
👑 BTC.D Analysis
Bitcoin Dominance continues its bullish move after breaking the descending trendline. Yesterday, it printed a higher low and broke 63.30, reaching 63.61, and is now consolidating below that level.
🔔 If this level is broken too, we’ll have the first confirmation of a trend reversal in dominance. Full confirmation will come after BTC.D holds above 63.95.
📅 Total2 Analysis
Let’s move to Total2. Yesterday, the 1.19 trigger activated, and the price dropped to 1.17. The reaction to 1.18 wasn’t strong or clean, so I’ve adjusted the support level to 1.17.
📉 Today, we can open a short position if 1.17 is broken. For a long, if the price moves above 1.19, we can go long on altcoins that trigger accordingly.
📅 USDT.D Analysis
Now looking at Tether Dominance. Yesterday, it reacted to 4.70 and is now forming a higher low, heading back toward that level.
☘️ I see strong bullish momentum on the chart, and I believe the probability of breaking 4.70 is high. If it breaks, USDT.D could move up to 4.82.
❌ Disclaimer ❌
Trading futures is highly risky and dangerous. If you're not an expert, these triggers may not be suitable for you. You should first learn risk and capital management. You can also use the educational content from this channel.
Finally, these triggers reflect my personal opinions on price action, and the market may move completely against this analysis. So, do your own research before opening any position.

TradeCityPro | Bitcoin Daily Analysis #93👋 Welcome to TradeCity Pro!
Let’s dive into the analysis of Bitcoin and key crypto indices. As usual, in this analysis, I’ll go over the triggers for the New York futures session.
⏳ 1-Hour Timeframe
Yesterday I mentioned the 102882 trigger for opening a position. The price made a bullish leg upward but failed to reach the 104866 resistance and is now moving back down.
🔍 If a lower high is formed compared to 104866 and the price approaches the 101628 support, we can open a position upon a breakdown of that level.
✨ The RSI oscillator is moving below the 50 zone, and with the selling volume coming into the market, the likelihood of forming a lower high than 104866 increases.
💥 Confirmation for a short position on the 101628 break could come from RSI entering the Oversold zone. Volume must also rise significantly, as the overall trend is still bullish, making short positions very risky. If you open one, make sure to secure profits quickly.
📈 For a long position, our trigger is still the 104866 breakout—no major change from previous days. The main resistance remains at 106247.
👑 BTC.D Analysis
Bitcoin dominance continued its upward movement to 63.30 yesterday and is now moving downward again. A breakdown of 62.65 would confirm the continuation of the downtrend in dominance.
🔼 For BTC.D to turn bullish again, it needs to break above 63.30 and could start another bullish leg if that happens.
📅 Total2 Analysis
This index didn’t move much higher yesterday due to the rise in Bitcoin dominance. It failed to reach its previous highs and is now near the 1.19 support.
📊 We can define a key support zone between 1.18 and 1.19. A breakdown of this zone could signal the start of a deeper correction.
📅 USDT.D Analysis
A range has formed between 4.51 and 4.69, and this index is consolidating within it.
🔑 A breakout in either direction could give us a trade setup. Breaking above 4.69 confirms a bullish move, while breaking below 4.51 signals a bearish trend and potential market rally.
❌ Disclaimer ❌
Trading futures is highly risky and dangerous. If you're not an expert, these triggers may not be suitable for you. You should first learn risk and capital management. You can also use the educational content from this channel.
Finally, these triggers reflect my personal opinions on price action, and the market may move completely against this analysis. So, do your own research before opening any position.

Silver Retreats on Semiconductor TensionsSilver pulled back to around $32.50 in Friday’s Asian session, giving up part of its recent gains following reports that the U.S. plans to blacklist several Chinese semiconductor firms. Given silver’s integral role in electronics and chip manufacturing, the news weighed on sentiment.
Demand for precious metals has also weakened with easing trade tensions, as the U.S. and China agreed to reduce tariffs, cutting U.S. duties from 145% to 30% and China’s from 125% to 10%. Despite this, silver found support from a weakening U.S. dollar, which followed soft economic data reinforcing expectations for Federal Reserve rate cuts. Powell, however, warned that persistent supply shocks could complicate inflation control moving forward.
Resistance begins at $32.50, with further levels at $33.80 and $34.20. Support is seen at $31.40, followed by $30.20 and $29.80.

Gold Slides Toward $3,220Gold fell to approximately $3,220 per ounce, on track for a weekly loss of more than 3% as appetite for the precious metal diminished with easing global trade tensions. The 90-day tariff truce between the U.S. and China reduced fears of a drawn-out trade war, while geopolitical concerns also eased with a stable India-Pakistan ceasefire.
Talks between Russia and Ukraine are losing momentum. Although soft U.S. inflation data has reinforced expectations for at least two Federal Reserve rate cuts this year, Fed Chair Powell cautioned that future inflation may be volatile due to persistent supply shocks.
Key support is located at $3,120, followed by $3,030 and $2,956. Resistance levels are seen at $3,250, then $3,300 and $3,350.

Pound Gains on Strong UK GDPThe British pound climbed to $1.3320 on Friday after strong UK GDP data showed the economy grew 0.7% in Q1 and 1.3% year-over-year, easing pressure on the Bank of England to cut rates aggressively. While a cut is still likely, the solid growth figures suggest urgency has diminished. At the same time, a softer U.S. dollar, driven by speculation that the U.S. may be allowing depreciation to support exports, has supported sterling. However, the UK’s broader outlook remains mixed, with rising unemployment and slowing wage growth signaling uneven momentum.
GBP/USD faces resistance at 1.3350, with additional levels at 1.3450 and 1.3550. Support levels are at 1.3160, 1.3000, and 1.2960.

TradeCityPro | Bitcoin Daily Analysis #92👋 Welcome to TradeCity Pro!
Let’s dive into today’s analysis of Bitcoin and key crypto indices. As usual, I’ll walk you through the futures session triggers for the New York session.
⌛️ 1-Hour Timeframe
As you can see in the 1-hour timeframe, the price has broken below the 102886 support and dropped to 101628, where it found support and is now making its way back toward the 102886 level.
✨ If the 102886 level is broken again, we could open a long position targeting the main recent high of the market at 104886.
🌩 The 104886 zone is a very significant level, and breaking it could initiate the next bullish leg for Bitcoin. However, the all-time high resistance at 106247 remains a solid barrier, forming a key supply zone between 104886 and 106247.
✔️ Since this zone is a major area of supply, it’s best to already be in a position before price reaches it. There’s a strong chance of a sharp move, and the breakout may not provide a clear confirmation candle, making it difficult to catch an entry in real time.
🔽 For short positions, our current trigger is the 101628 level. A breakdown here could begin a deeper correction. Key support levels to watch are 99225 and 97409.
👑 BTC.D Analysis
Moving on to Bitcoin dominance—yesterday, the trendline we had drawn was broken, and now dominance is heading toward 63.12.
🧩 The break of this trendline doesn’t indicate a trend reversal just yet. The bearish momentum in this current leg has been strong, and for a full reversal, we would need to see a higher high and higher low form on higher timeframes.
🔔 For now, the next corrective zones for dominance are at 63.61 and 64.10.
📅 Total2 Analysis
Let’s look at the Total2 index. Like Bitcoin, it has undergone a correction and has reached the 1.18 support level.
🎲 The current short trigger is the 1.18 level, and a breakdown here would confirm a deeper correction.
🔼 For long positions, the 1.24 and 1.26 levels are suitable triggers.
📅 USDT.D Analysis
Now let’s analyze Tether dominance. The index has corrected to the 4.69 level.
☘️ If 4.69 is broken, the market could undergo a deeper correction toward 4.82. On the other hand, if the price gets rejected from this level, the likelihood of a move back down to 4.51 increases.
❌ Disclaimer ❌
Trading futures is highly risky and dangerous. If you're not an expert, these triggers may not be suitable for you. You should first learn risk and capital management. You can also use the educational content from this channel.
Finally, these triggers reflect my personal opinions on price action, and the market may move completely against this analysis. So, do your own research before opening any position.
Risk Appetite Weighs on GoldGold hovers near $3,155, attempting to stabilize after falling more than 2% the previous day. The metal trades below $3,200, pressured by improved risk appetite following U.S.-China tariff reductions and upcoming U.S. data releases, including PPI and Retail Sales.
Fed Chair Powell’s speech is also in focus, as markets seek clues on interest rate policy. While the weaker Dollar has lent gold some support, traders remain cautious ahead of potential rate-cut signals.
Key resistance is seen at $3,235, followed by $3,300 and $3,350. On the downside, support begins at $3,120, then $3,030 and $2,956.

UK Data in Focus as Pound Tests 1.3300GBP/USD trades near 1.3280 early Thursday, recovering recent losses as the dollar softens with ongoing trade policy discussions. Optimism over reduced U.S. tariffs on British goods like cars and steel helps strengthen the appeal of the Pound.
However, weaker UK employment data and slow wage growth may increase pressure on the BoE to consider further easing. Traders now await UK Q1 GDP and U.S. CPI data. Despite global uncertainties, improving trade conditions have reduced bets on aggressive Fed cuts, with markets now pricing a 74% chance of a 25 bp cut in September instead of July.
The pair faces resistance at 1.3320, with higher levels at 1.3450 and 1.3550. Support sits at 1.3160, then 1.3000 and 1.2960.

Euro Rises Near 1.1200 on Reserve StatusEUR/USD traded around 1.1200 during Thursday’s Asian session, rebounding ahead of the Eurozone’s Q1 2025 GDP report. The Euro remains supported by its rising role in global reserves, with Capital Economics noting its strongest position in years. U.S. policies under President Trump set this shift in motion, which is seen as weakening the dollar’s appeal as a popular asset. Germany’s increased fiscal spending has also lifted euro demand.
Despite ECB officials signaling more rate cuts, the Euro holds steady against a softer U.S. Dollar, which remains pressured by lingering trade uncertainty. Markets are now focused on U.S. retail sales and PPI data, while speculation grows that the U.S. might allow a weaker Dollar to aid exports.
EUR/USD faces resistance at 1.1260, with further upside near 1.1460 and 1.1580. Support begins at 1.1040, followed by 1.1000 and 1.0960.

Japan Pushes Back on Auto TariffsThe Japanese Yen strengthened to around 146 per dollar, marking its third straight gain as global trade concerns weighed on the U.S. Dollar. Asian currencies broadly rose with speculation that the U.S. may be favoring a weaker Dollar to aid trade talks. Trump’s administration argues that undervalued Asian currencies create unfair competition for American exporters.
Meanwhile, Japan continues U.S. trade negotiations, with PM Shigeru Ishiba pushing for a deal that includes the auto sector and the removal of the 25% car tariff.
USD/JPY faces resistance at 148.60, with further levels at 149.80 and 151.20. Major support is seen at 139.70, then 137.00, and 135.00.

TradeCityPro | Bitcoin Daily Analysis #91👋 Welcome to TradeCity Pro!
Let’s dive into the Bitcoin and major crypto index analysis. As usual, I'll go over the key triggers for the New York futures session.
⏳1-Hour Timeframe
As you can see, Bitcoin made a bullish move yesterday after breaking above 102,882 and reached as high as 104,866.
✔️ After hitting 104,866, the price failed to break this resistance and got rejected, pulling back to retest 102,882 with a wick.
✨ As long as the price stays above 102,882, I consider the market momentum bullish. I still hold my long position opened around 85,000 and plan to open another one if we break 104,866.
📈 So the best long trigger is a clean breakout above 104,866. The next resistance is 106,247, which makes the 104,866 breakout a bit riskier due to proximity to that major supply zone.
🔽 For short setups, the first trigger is again 102,882. If the price forms a lower high below 104,866, a breakdown of 102,882 could justify a risky short.
📊 Personally, I’m not opening any shorts yet since higher timeframe trends are bullish. My first valid short trigger would be a breakdown of 101,628.
👑 BTC.D Analysis
Bitcoin dominance continues to fall and has now reached the 62.07 support level and is reacting to it.
💫 If 62.07 breaks, we could see another bearish leg down to 61.34.
🔼 For BTC.D to flip bullish, we first need to see the descending trendline break and then look for confirmation and a long trigger from that.
📅 Total2 Analysis
After breaking through 1.24, Total2 moved up to 1.26 and is now pulling back to retest 1.24.
🧩 If 1.24 holds and the price breaks above 1.26, there’s a strong chance it continues toward 1.31. This would confirm a long setup for altcoins.
🔔 For short positions, the only valid trigger for now is a breakdown of 1.18.
📅 USDT.D Analysis
Tether dominance faked a breakdown below 4.51 yesterday but has now bounced back above it.
💥 Currently, we should wait for the price to retest 4.51 again and reassess that support. If it breaks down cleanly, we’ll get confirmation of bearish momentum for USDT.D, which would support a bullish trend in the broader crypto market.
❌ Disclaimer ❌
Trading futures is highly risky and dangerous. If you're not an expert, these triggers may not be suitable for you. You should first learn risk and capital management. You can also use the educational content from this channel.
Finally, these triggers reflect my personal opinions on price action, and the market may move completely against this analysis. So, do your own research before opening any position.

EURUSD - at Resistance: Will it drop to 1.11300?OANDA:EURUSD price is now at a strong resistance level, this is an area where it has struggled to break through in the past and reversed to the downside. It's also where sellers have stepped in before, so it’s worth keeping an eye on, especially for anyone considering short trades.
If we start seeing signs that the price is getting rejected here: like long wicks, bearish candles, or buyers starting to lose momentum, I think we could see a move down toward the 1.11300 level. But if price breaks through this zone clearly, that might dismiss the bearish idea and suggest even more upside will continue.
This area is pretty important and could give us a better idea of where price is headed next.
Just sharing my thoughts on support and resistance, this isn’t financial advice. Always confirm your setups and manage your risk wisely.

TradeCityPro | Bitcoin Daily Analysis #90👋 Welcome to TradeCity Pro!
Let’s dive into Bitcoin and major crypto indices analysis. As usual, I’ll walk you through the key triggers for the New York futures session.
⏳ 1-Hour Timeframe
As you can see, the price has found support at the 101,628 level and is now moving back up toward the 104,866 resistance.
⭐ The first trigger for a long position was the breakout of 102,882, which confirmed the activation of a double bottom pattern and could’ve been a good entry point for a long.
✔️ The next key triggers are at 104,866 and 106,247. If you don’t already have a position open, you can enter on a breakout above these levels—but keep in mind it’s risky since there’s a strong supply zone nearby.
💥 From the RSI oscillator, a breakout above 57.41 can serve as confirmation of bullish momentum. In that case, you can take on more risk in long positions.
📉 For short positions, the first trigger is the breakdown of 101,628. If the price sets a lower high below 104,866, you can consider entering a short on the break of 101,628.
👑 BTC.D Analysis
Moving on to Bitcoin dominance—yesterday, dominance made a fakeout to the downside but came back above 62.65.
⚡️ To continue its downtrend, we can use 62.65 as the bearish trigger again. For a bullish confirmation, the next trigger is a breakout above 63.61.
📅 Total2 Analysis
Total2 had a pullback to 1.18 and is now heading back toward 1.24.
✨ We’ll confirm bullish continuation on a breakout above 1.24, and this can be used as a trigger for long positions.
🔽 For shorts, if the price prints a lower high under 1.24, a risky short could be considered on a breakdown below 1.18.
📅 USDT.D Analysis
Now looking at Tether dominance—like I mentioned yesterday, we were watching the 4.51 level for confirmation. That level held as support and blocked further Bitcoin upside.
🔔 Currently, a breakdown below 4.51 would confirm bearish continuation. If 4.70 breaks to the upside instead, we get confirmation of a deeper market correction.
❌ Disclaimer ❌
Trading futures is highly risky and dangerous. If you're not an expert, these triggers may not be suitable for you. You should first learn risk and capital management. You can also use the educational content from this channel.
Finally, these triggers reflect my personal opinions on price action, and the market may move completely against this analysis. So, do your own research before opening any position.

TradeCityPro | Bitcoin Daily Analysis #89👋 Welcome to TradeCity Pro!
Let’s dive into the Bitcoin analysis and key crypto indexes. As usual, in this analysis I’ll go over the futures triggers for the New York session.
⏳ 1-Hour Timeframe
In the 1-hour timeframe, as you can see, Bitcoin is still below the 104866 resistance level and is ranging underneath this zone.
💥 Today, an important news update came from Trump: a deal has been made between China and the U.S., and the two countries have agreed to reduce tariffs for 90 days.
✔️ The impact of this news was that Bitcoin made a wick toward 106247 but didn’t reach it, pulled back, and is now again below the 104866 area.
✨ At the moment, the 104866 level is a suitable trigger for opening a position, but be aware that there’s a significant resistance zone at 106247. Personally, I won’t open a position just on the break of 104866 because it's very close to the ATH zone, and the probability of entering a corrective phase is high.
⚡️ If a correction begins, the first support level for price is at 102391. If the RSI stabilizes below 50, the likelihood of a correction increases.
🔽 As for short positions, we should wait until the market shows a trend reversal.
👑 BTC.D Analysis
Now let’s look at Bitcoin dominance. Yesterday, the dominance chart made a slight upward correction and is now breaking below the 62.65 low.
🧩 If the downward move in dominance continues, altcoins could make another leg upward. The next support for dominance is at 62.17.
📅 Total2 Analysis
Now for the Total2 analysis. The 1.24 area, which was our long trigger, is being broken—and if it confirms, the price could rise up to 1.31.
⭐ This confirmation, along with the drop in Bitcoin dominance, could give us good long setups on altcoins.
📅 USDT.D Analysis
Now to Tether dominance. This index hasn’t triggered yet and is currently sitting at the 4.51 support. If this index also confirms a bearish move, the risk of opening long positions will be much lower.
💫 The next support level for Tether dominance is at 4.37.
❌ Disclaimer ❌
Trading futures is highly risky and dangerous. If you're not an expert, these triggers may not be suitable for you. You should first learn risk and capital management. You can also use the educational content from this channel.
Finally, these triggers reflect my personal opinions on price action, and the market may move completely against this analysis. So, do your own research before opening any position.

TradeCityPro | Bitcoin Daily Analysis #87👋 Welcome to TradeCity Pro!
Let’s get into the analysis of Bitcoin and major crypto indices. As usual, I’ll review the triggers for the New York Futures session.
⏳ 1-Hour Timeframe
On the 1-hour timeframe, Bitcoin moved sideways yesterday as I mentioned, and after the RSI exited the Overbuy zone, it corrected down to the 102391 area.
🔍 This was a very minor correction, mainly due to the RSI leaving the Overbuy zone. Currently, the oscillator has reset, and if it re-enters Overbuy, we can confirm the start of bullish momentum.
✨ Now the candle has closed above the 103642 area, and if the price stabilizes above this level, it could move toward the main resistance at 106247.
📊 In my opinion, the price will move toward 106247 and then enter a correction because the breakout of 103642 was accompanied by increased volume, and if this volume continues, the probability of this move increases.
📉 If the correction starts from the current level, the first support we have is 102391, and after that, there is no solid support until 99337.
🧩 The reason I’m not using Fibonacci to find support zones is that the price hasn’t confirmed the start of a correction yet, and a proper top hasn’t been formed. I’m waiting for that top and confirmation of the correction before identifying key correction levels.
✔️ For now, only these two support levels are important, and as long as the price is above 99337, the trend remains bullish.
📈 For opening a position today, the Bitcoin trigger at 103642 has been activated and is currently getting a pullback. If you get confirmation from this pullback, you can enter a position — but be careful, there's a very important resistance at 106247 and that zone is highly significant.
👑 BTC.D Analysis
Let’s move to Bitcoin dominance. Yesterday, dominance had a slight correction and pause, and today it broke the 63.61 area and is moving toward the 63.23 support.
⚡️ It seems there’s strong bearish momentum in dominance, and if it continues to drop, I believe it could easily break 63.23 and move further down.
📅 Total2 Analysis
Let’s check out Total2. Yesterday, the 1.17 trigger for this index also activated, and you could open positions on altcoins.
💥 The next resistance we currently have is the 1.22 area, and considering the drop in Bitcoin dominance, this index can easily move toward that resistance.
🔔 At the moment, I can’t give you any trigger on this index — you can only enter based on confirmation from individual coins.
📅 USDT.D Analysis
Now let’s look at Tether dominance. This index has also continued its move and after a short pause, broke below 4.65 and is moving downward.
🎲 For now, the trend in dominance is bearish, which pushes the market upward.
❌ Disclaimer ❌
Trading futures is highly risky and dangerous. If you're not an expert, these triggers may not be suitable for you. You should first learn risk and capital management. You can also use the educational content from this channel.
Finally, these triggers reflect my personal opinions on price action, and the market may move completely against this analysis. So, do your own research before opening any position.
