Gold Slips Toward $3,290 on Trade OptimismGold extended losses for a third day, dropping toward $3,290 as market appetite for risk improved ahead of U.S.-China trade talks. The announcement of a U.S.-UK trade deal also contributed to reduced safe-haven demand. The Fed held rates steady as expected, warning of risks to inflation and jobs but avoiding any hint of preemptive cuts. Still, gold is poised for a weekly gain.
Resistance is seen at $3,360, $3,430, and $3,500, while support holds at $3,270, $3,200, and $3,165.
Dailyanalysis

Pound Steadies with Trade Deal ReliefThe GBP/USD pair opened Thursday with gains following the Bank of England’s expected 25 basis point rate cut, but the pound’s momentum faded as attention turned to U.S. trade developments. By Friday morning, the pair was trading around 1.3240.
Sentiment shifted toward the U.S. dollar after the Trump administration announced an upcoming trade deal with the UK, helping Britain avoid steep reciprocal tariffs originally set to resume on July 9. While some relief came from Trump’s earlier ‘Liberation Day’ delay, a broad 10% tariff on all UK imports to the U.S. remains on track, potentially weighing on sentiment. Refined ethanol has been fully exempted, though U.S. import data shows none has been sourced from the UK in over 15 years.
If GBP/USD breaks above 1.3280, resistance levels come in at 1.3450 and 1.3550. Support lies at 1.3160, followed by 1.3000 and 1.2960.

Euro Nears 1.1230 on Cautious ECBEUR/USD edged up to 1.1230 in Friday’s Asian session, paring earlier losses caused by stronger U.S. data and easing trade tensions that supported the dollar. The euro remains under pressure as markets price in possible ECB rate cuts by June, though officials maintain confidence in inflation reaching the 2% target by year-end.
The pair faces resistance at 1.1260, with further upside capped near 1.1460 and 1.1580. On the downside, support is seen at 1.1150, followed by 1.1100 and 1.1050.

Yen Falls Past 145 as Dollar StrengthensThe Japanese yen weakened past 145 per dollar, hovering near a one-month low as the U.S. dollar strengthened with improving global trade sentiment and diminishing expectations of near-term U.S. rate cuts. The greenback gained momentum after President Trump announced a preliminary trade deal with the UK, the first since broad U.S. tariffs were introduced last month. He also signaled that tariffs on China could be eased, depending on the outcome of high-level trade talks set for this weekend in Switzerland.
Adding pressure on the yen, Fed Chair Powell dismissed the idea of a preemptive rate cut, citing persistent inflation risks and labor market concerns. In Japan, personal spending rose more than expected in March, suggesting resilience in consumption, though a third straight monthly drop in real wages highlighted broader economic challenges.
Resistance stands at 145.90, with further levels at 146.75 and 149.80. Support is found at 139.70, then 137.00 and 135.00.

TradeCityPro | Bitcoin Daily Analysis #85👋 Welcome to TradeCity Pro!
Let’s move on to the analysis of Bitcoin and key crypto indices. As usual in this analysis, I’ll review the futures triggers for the New York session.
📰 Yesterday, the U.S. interest rate decision came out, which remained unchanged and didn’t have much impact on the market—this was expected for some time. Now that the news had no real effect, the market can continue its previous trend.
⏳ 1-Hour Timeframe
As you can see in the 1-hour timeframe, after the news came out yesterday, the price ranged a bit and then moved upward, triggering the 97409 level. I hope you entered a position with that trigger because I had emphasized it strongly.
✔️ Currently, the price has reached the 99337 zone and is stabilizing above it. If this holds, the next resistance level is 101965.
💥 The RSI oscillator is also in the Overbuy zone, which is helping the price maintain its bullish momentum. There’s a resistance at 75.77 on the RSI, and if that breaks as well, we could see a very sharp move in the chart.
📊 Buy volume has been strong in this leg and aligns with the trend. If volume starts decreasing, divergence will appear, and we’ll get the first sign of trend weakness. Just remember—weakness doesn’t mean trend reversal.
📉 As for short positions, I think by now you know my trading style. In a market like this, where momentum is strongly bullish and price is breaking resistance one after another, I don’t think opening a short position makes sense. We should wait for proper structure to form before considering a short.
👑 BTC.D Analysis
Moving on to Bitcoin dominance—yesterday the 65.28 zone was broken and price moved up near the top of the channel, but then reversed and has now dropped to the midline of the channel.
🔑 Currently, the dominant trend is still bullish, but short-term momentum is bearish, and there’s a good chance it drops further to 64.91.
⚡️ Since the higher timeframes are still bullish, we could see bullish momentum return at any time. Technically, the 64.91 zone is the next major support.
📅 Total2 Analysis
Let’s look at Total2—finally, the 1.05 trigger was activated, and Total2 started moving upward. I had strongly emphasized this trigger as well, and I hope you took advantage of it.
🧩 Price has now reached the 1.07 level, and if that breaks, it could move up to 1.1.
🔼 If this bullish move turns out to be a fakeout, the next valid triggers for short positions are a break of 1.03 and then 1.01.
📅 USDT.D Analysis
Now to Tether dominance—this index also broke the 4.99 level and is now trending downward.
🔍 If this move continues, we could see a drop to around 4.82. That would allow the market to continue its upward movement even further.
❌ Disclaimer ❌
Trading futures is highly risky and dangerous. If you're not an expert, these triggers may not be suitable for you. You should first learn risk and capital management. You can also use the educational content from this channel.
Finally, these triggers reflect my personal opinions on price action, and the market may move completely against this analysis. So, do your own research before opening any position.

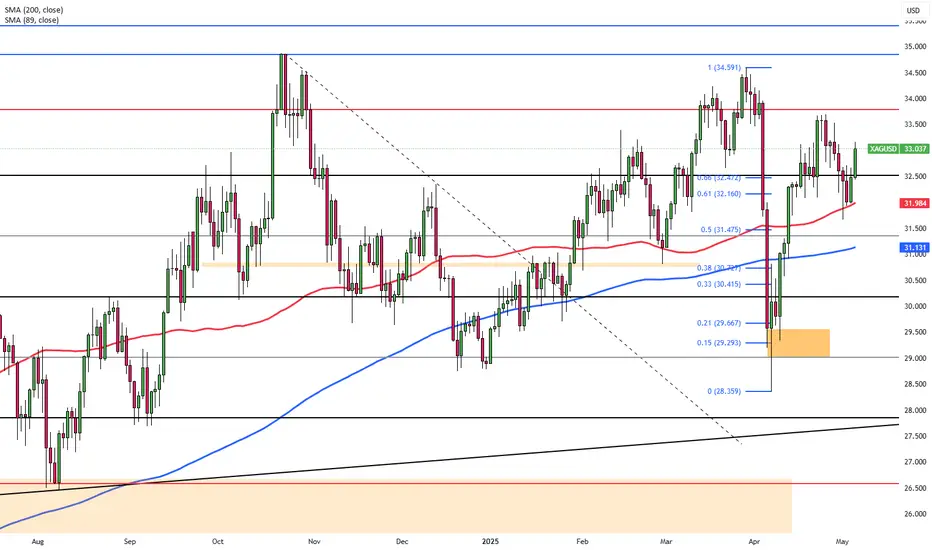
Silver Slips as Fed Holds RatesSilver rose more than 1% to approach the $33 mark on Thursday, supported by renewed interest on precious metals with ongoing trade and economic uncertainty. The Federal Reserve left interest rates unchanged, with Chair Powell citing heightened risks while dismissing the need for early rate cuts. Sentiment was also influenced by President Trump’s announcement of an imminent trade deal, reportedly with the UK, and his firm stance on maintaining tariffs against China ahead of upcoming negotiations.
Technically, resistance is seen at $33.80, followed by $34.20 and $34.85, while support levels are noted at $32.00, $31.40, and $30.20.

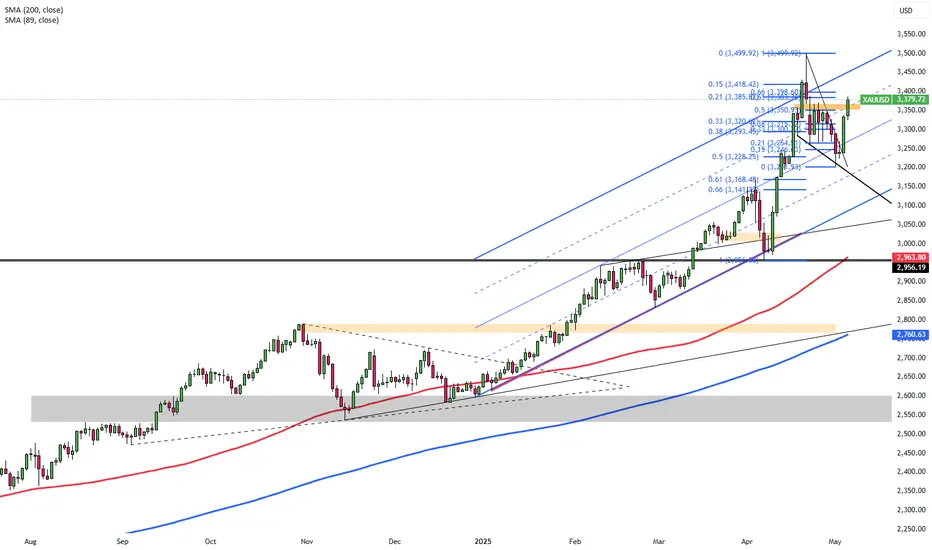
Gold Dips Toward $3,360 as Fed HoldsGold slipped to around $3,360 per ounce on Thursday, pressured by the Fed’s cautious tone after keeping rates unchanged. Chair Powell dismissed preemptive cuts and highlighted inflation and labor market risks, dampening demand for non-yielding assets. However, gold's downside was limited by trade uncertainties as Trump reaffirmed tariffs before U.S.-China talks in Switzerland.
Resistance is expected at $3,460, followed by $3,500 and $3,550. Support sits at $3,320, with further levels at $3,300 and $3,265.

GBP Steady Near $1.33, BoE Rate Cut ExpectedThe British pound hovered near $1.33 as traders awaited the BoE’s decision, with a 25 bps cut to 4.25% widely expected. Markets are also eyeing new economic forecasts for signals of further easing. While Trump’s tariff plans have stoked global slowdown fears, the UK is less exposed due to a U.S. goods surplus. A fresh trade deal with India, expected to generate £4.8 billion annually by 2040, may also cushion the economy.
If GBP/USD breaks above 1.3430, resistance levels come in at 1.3500 and 1.3550. Support lies at 1.3200, followed by 1.3050 and 1.2960.

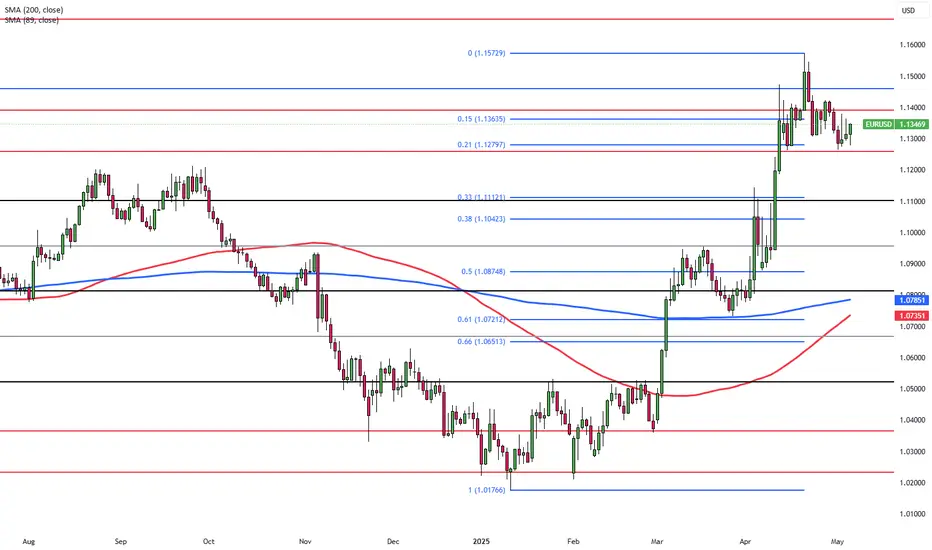
Euro Strengthens on Political ShiftsEUR/USD traded just above 1.1300 on Thursday, staying in a tight range as reduced political uncertainty in Europe and a softer U.S. dollar offered mixed cues. The euro was supported by news of Friedrich Merz becoming Germany’s chancellor, while the dollar struggled despite a hawkish Fed pause, as Powell flagged tariff-related risks. Traders are focused on Trump’s press conference at 14:00 GMT and U.S. jobless claims for near-term direction.
Resistance is seen at 1.1460, with higher levels at 1.1580 and 1.1680. Support lies at 1.1260, followed by 1.1200 and 1.1150.

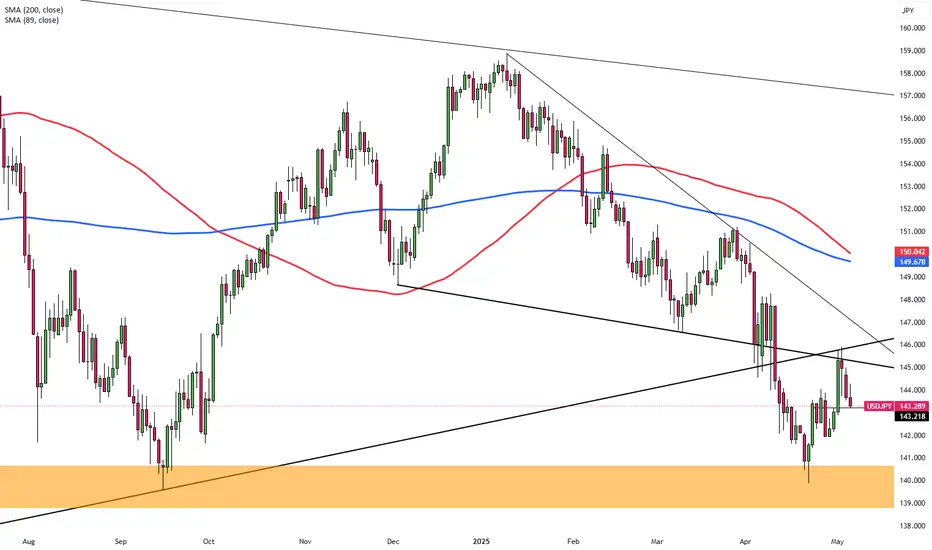
Yen Firms with BoJ CautionThe Japanese yen strengthened to around 143.6 per dollar on Thursday, recovering as rising global trade uncertainty stimulated demand for gold. The move followed President Trump’s announcement of a deal with a “big” country, reportedly the UK, and his refusal to cut tariffs on China ahead of U.S.-China talks in Switzerland. U.S.-Japan negotiations continue, with Tokyo aiming to finalize a bilateral deal by June. Meanwhile, BoJ minutes showed policymakers remain open to rate hikes if inflation targets are met, though they flagged external risks from U.S. trade policy.
Resistance stands at 145.90, with further levels at 146.75 and 149.80. Support is found at 139.70, then 137.00 and 135.00.

TradeCityPro | Bitcoin Daily Analysis #84👋 Welcome to TradeCity Pro!
Let’s dive into the analysis of Bitcoin and major crypto indices. As usual, I’m going to review the New York futures session triggers for you.
⏳ 1-Hour Timeframe
As you can see in the 1-hour timeframe, yesterday after news of tensions between India and Pakistan, Bitcoin moved upward and made a sharp rally to the 97409 zone, returning once again to this high.
📰 This news created fear in the market, and the buying that occurred was driven by fear and news impact. In my opinion, this bullish leg won’t be sustainable in the long term unless the price stabilizes above the 97409 level and starts a new upward leg.
✨ If the 97409 level is broken, we can enter a long position since it aligns with the current bullish trend, and we can position ourselves for the breakout with a wide stop-loss.
✔️ But make sure your stop-loss is wide and placed below the market’s main support because a significant resistance is being broken, and there's a high chance of volatility before the market actually moves upward. A tight stop-loss may get triggered before the actual rally begins.
💥 A momentum confirmation for today’s long position could be RSI entering the Overbuy zone, and if that happens, the chances of breaking 97409 increase significantly.
📉 For a short position, we should wait and see how the news impact plays out in the market. If it turns out to be driven by FOMO, naturally in the next few days, the price may move back down, and we could enter short positions on breaks of levels like 95370 or 93626.
👑 BTC.D Analysis
Let’s move to Bitcoin Dominance. Yesterday, dominance stabilized above the 64.91 level and managed to move up to 65.25.
🎲 Currently, Bitcoin is a much better option for long positions since dominance is rising, and even breaking 65.28 would confirm another bullish leg in dominance, potentially pushing it toward the top of the channel.
📅 Total2 Analysis
Let’s analyze Total2. Yesterday, this index faked a breakdown below 1.01 and simultaneously moved upward with the news, now reaching the 1.03 zone. A break of this zone could confirm a bullish move toward 1.05.
⭐ The main trigger for a long position remains the break of 1.05, and I strongly recommend being positioned if that level is broken.
🔽 For a short position, you can still enter on a break of 1.01 — I still think it’s a valid trigger.
📅 USDT.D Analysis
Now for USDT Dominance: yesterday, this index also faked a move above the 5.20 level and has since dropped to 5.04.
💫 Activation of the 5.04 trigger could be confirmation for a long position and a sign of USDT dominance starting to decline. The main trigger remains the break of the 4.99 bottom.
❌ Disclaimer ❌
Trading futures is highly risky and dangerous. If you're not an expert, these triggers may not be suitable for you. You should first learn risk and capital management. You can also use the educational content from this channel.
Finally, these triggers reflect my personal opinions on price action, and the market may move completely against this analysis. So, do your own research before opening any position.

Stromm | GOLD Bullish Continuation in PlayIt’s good to see Gold OANDA:XAUUSD getting the attention it deserves again. But honestly, the performance it’s putting in right now is just insane.
If you zoom into the 4-hour chart, you’ll spot a clear Demand Continuation Pattern:
Rally → Base → Rally.
In simple terms: strong move up, sideways consolidation, strong move up again.
The first rally pushed Gold up 9.77% within a few days, followed by a sideways base, and then another 9.6% rally straight into the $3,500 mark.
With commodities like Gold, you really feel how powerful psychological levels are — $3,000, $3,500, $4,000 — all massive magnet zones where large investors naturally look to take profits.
Now, after tagging $3,500, we’ve pulled back.
If this Demand Continuation structure holds, here's how I see it playing out:
Inside the current base, there’s a 4-hour order block, and it’s the one I’m watching most closely.
Ideally, we get a push up into the 4h Balance Price Range between $3,336–$3,347, followed by a rejection that sweeps the Previous Weekly Low, tagging that 4h order block for a proper retest.
From there, a move toward the 8h Balance Price Range would be good.
Now, two possibilities:
Best case for bears: After retesting that 4h zone, we fall further — possibly targeting $3,050.
Sneaky scenario: We fake a drop to trigger stop-losses, push back up toward $3,510, then properly roll over.
On the monthly chart, it gets even more interesting:
Given the massive rejection off $3,500, I wouldn’t rule out a much deeper retracement toward $2,500–$2,000 before Gold makes another serious attempt at $4,000.
That would perfectly fit into a larger Elliott Wave structure, completing a Wave 3 or setting up a Wave 5 push later.
(And yes — catching a Wave 3 top is brutal — especially when it is an all-time high)
Unless geopolitical events massively change the landscape, it feels like $3,500 is a strong local top — for now.
But if the world starts burning again?
Gold might have other plans.

TradeCityPro | Bitcoin Daily Analysis #83👋 Welcome to TradeCity Pro!
Let’s dive into the Bitcoin analysis and key crypto indices. As usual, I want to review the triggers for the New York futures session.
🔍 Today, I’ll provide the analysis in the 4-hour timeframe, since not much has changed on the 1-hour chart compared to yesterday, and it's better to take a slightly longer-term look at the chart.
⏳ 4-Hour Timeframe
As you can see in the 4-hour chart, we have an upward leg that started from the 84,000 zone and extended to 97,108. Currently, it's ranging between 93,626 and 95,370.
✔️ The main market top lies at 97,108, but the price has formed a range slightly lower, with 93,626 acting as support.
⚡️ There's a strong divergence visible in the RSI — while Bitcoin has formed three consecutive higher highs, RSI has printed lower highs. This divergence was activated when RSI broke below 50, and the price corrected to 93,626.
📊 In my opinion, the market has now digested the divergence, but the impact it had was a correction down to this level. If 93,626 breaks, deeper corrections could follow.
✨ The 93,626 zone overlaps with the 0.236 Fibonacci retracement and forms a PRZ. If this level breaks, we can open a short position. I open this kind of trade in lower timeframes as a scalp and take quick profits, since it’s counter-trend.
🔽 The maximum short-term target I expect for this trade is the 91,945 area. It's possible that the price corrects further or even reverses trend, but it's not logical in my strategy to hold these kinds of trades longer.
🔑 The key supports ahead are 91,945 (which overlaps with 0.382 Fibonacci), and further down are the 0.5 and 0.618 Fibonacci levels.
📈 For a long position, breaking 95,370 is currently the best trigger. You can also enter on a break of 97,139, but there's strong resistance at 98,828 that could halt the upward move.
🔼 If the price corrects and reaches 91,945, you can consider a long entry based on the price’s reaction to the supports I mentioned.
👑 BTC.D Analysis
Let’s move on to Bitcoin dominance. On the 4-hour chart, there’s an ascending channel where price is moving, with multiple touches. Right now, it’s testing resistance at 64.91.
☘️ If this level breaks, dominance could move up to the top of the channel. There’s also a very important static resistance at 65.59. If price reaches this area, we need to watch its reaction.
📅 Total2 Analysis
Now onto Total2. Similar to Bitcoin, it had a bullish leg, but corrected more deeply — down to the 0.382 Fibonacci retracement, and now it’s at the 1.01T support.
⭐ If this zone breaks, the next supports are at the 0.5 and 0.618 Fibonacci levels. There’s also a strong support at 980B, and the major bottom is at 932B.
📉 For a short position, breaking 1.01T is suitable. For a long position, a bullish reaction from this same area is a good trigger. The main long trigger is the break of 1.05T.
📅 USDT.D Analysis
Let’s move to Tether dominance. This indicator has reached a major top at 5.19. If this level breaks, it can move upward.
👀 If it breaks, the next resistance is 5.37. This move would coincide with a market correction or drop.
📊 To confirm a bearish Tether dominance (bullish market), rejection from 5.19 is a good trigger. The main trigger is still the break of 4.99.
❌ Disclaimer ❌
Trading futures is highly risky and dangerous. If you're not an expert, these triggers may not be suitable for you. You should first learn risk and capital management. You can also use the educational content from this channel.
Finally, these triggers reflect my personal opinions on price action, and the market may move completely against this analysis. So, do your own research before opening any position.

XAG/USD Stable Ahead of Fed DecisionSilver (XAG/USD) held steady on Tuesday, underpinned by safe-haven demand as U.S. tariff tensions and global growth concerns persisted. Although the U.S. dollar saw a slight recovery, silver maintained its ground with markets focused on the upcoming Federal Reserve policy decision. Expectations for unchanged rates and possible future easing could continue to lend support to silver in the near term.
The first resistance is seen at $33.80, with higher levels at $34.20 and $34.85 if momentum builds. Support begins at $32.00, followed by $31.40 and $30.20.
Gold Climbs on Safe-Haven DemandGold climbed to nearly $3,360 per ounce on Tuesday, marking its highest level in over a week, as renewed tariff threats from President Trump increased safe-haven demand. Trump announced a 100% tariff on foreign films and signaled upcoming measures targeting pharmaceuticals. Investors are now focused on the Federal Reserve’s policy decision, with rates expected to stay unchanged despite Trump’s push for cuts.
Resistance is expected at $3,385, then $3,450 and $3,500. Support stands at $3,300, followed by $3,265 and $3,200.
GBP Falls Ahead of Fed and BOE MeetingsSterling fell 0.24% to $1.3265 on Tuesday as the U.S. dollar firmed ahead of the Federal Reserve’s policy decision, with rates expected to remain unchanged. While the dollar recovered slightly, doubts over its safe-haven appeal and Trump’s tariff stance persist. Markets also await the Bank of England’s meeting, where a 25 bps rate cut is expected. Dovish signals or dollar softness may support GBP/USD.
If GBP/USD breaks above 1.3430, the next resistance levels are 1.3500 and 1.3550. Support levels are at 1.3200, followed by 1.3050 and 1.2960.

Euro Pressured Ahead of Fed DecisionThe euro is trading around $1.1315 on Tuesday, pressured by a stronger U.S. dollar ahead of the Federal Reserve’s policy decision, where rates are expected to remain unchanged. However, the dollar still faces headwinds from doubts over its safe-haven appeal and President Trump’s unpredictable tariff stance. A dovish Fed or continued skepticism toward the dollar may limit euro losses.
Resistance levels are seen at 1.1460, then 1.1580 and 1.1680, while support rests at 1.1260, followed by 1.1200 and 1.1150.
Yen Slips Toward 144 on Stronger DollarThe Japanese yen edged lower toward 144 per dollar on Tuesday, as the U.S. dollar strengthened amid optimism over potential U.S.-China trade talks and investor caution ahead of the Federal Reserve’s policy decision. President Trump suggested a possible reduction in tariffs on Chinese goods. Meanwhile, the Bank of Japan held rates steady but revised its growth and inflation outlook. Trading activity remained subdued due to a public holiday in Japan.
Resistance is located at 145.90, followed by 146.75 and 149.80. On the downside, support levels are at 139.70, then 137.00 and 135.00.
TradeCityPro | Bitcoin Daily Analysis #82👋 Welcome to TradeCity Pro!
Let’s dive into the analysis of Bitcoin and key crypto indicators. As usual, I’ll walk you through the futures triggers for the New York session.
⏳ 1-Hour Timeframe
As you can see, yesterday the price stabilized below 95370 and completed a downward leg to 93626, reacting exactly to the level I pointed out in the previous analysis.
✔️ I mentioned earlier that you could enter a short position after breaking 95370 — but remember, this position is against the higher timeframe trend, so the downward move will likely end once it hits the first support, since the market momentum remains bullish on larger timeframes.
💥 Currently, the price has reacted to 93626 and seems to be resting from the previous downward move. I believe a new range box may form between 95370 and 93626 — if that happens, I’ll go long on a break above 95370.
🔽 For short positions, given the bearish momentum in this timeframe, we can look to re-enter on a break below 93626 in the next retest.
📊 Watch volume and RSI today. The volume of red candles has been much higher than bullish ones, which increases the chance of a deeper correction. If you’re shorting, keep a tight stop-loss, take profits quickly, and treat it as a scalp trade.
📈 For long positions, since it’s against the short-term trend, you’ll need a wider stop — but if the correction ends and a new bullish leg begins, the trade may stay open longer.
🧩 As for RSI: as long as it stays below 50, market momentum is bearish. A break below 30 and entry into oversold increases the likelihood of more downside.
👑 BTC.D Analysis
Bitcoin dominance broke 64.77 yesterday and retraced to 64.60. If this downward move continues, we could see early signs of a trend shift.
✨ Important note: dominance has been in an uptrend on higher timeframes, so a break of 64.60 only confirms a short-term correction. Don’t take it as a trend reversal just yet.
💫 If dominance continues to drop and the market rises, altcoins could outperform Bitcoin. Conversely, if dominance rises again, Bitcoin will rally more than altcoins.
📅 Total2 Analysis
Total2 broke below 1.03 yesterday, retested it, and now looks set to continue downward. The next support is at 1.00 — if you’re already short, consider taking profits at that level.
☘️ We’ll get full trend reversal confirmation with a break below 1.00. For long positions, the 1.05 breakout is extremely important. I strongly recommend not missing that trigger if it happens.
📅 USDT.D Analysis
USDT dominance stabilized above 5.10 yesterday, moving further away from 4.99, and is now testing 5.19. A break above 5.19 would be a strong signal that a deeper market correction is starting.
🔑 On the flip side, a break below 4.99 is still the best and most important trigger to confirm the market’s return to a bullish trend.
❌ Disclaimer ❌
Trading futures is highly risky and dangerous. If you're not an expert, these triggers may not be suitable for you. You should first learn risk and capital management. You can also use the educational content from this channel.
Finally, these triggers reflect my personal opinions on price action, and the market may move completely against this analysis. So, do your own research before opening any position.

TradeCityPro | Bitcoin Daily Analysis #81👋 Welcome to TradeCity Pro!
Let’s get into the analysis of Bitcoin and the key crypto indices. As usual, I’ll review the futures triggers for the New York session.
⏳ 1-Hour Timeframe
As you can see, Bitcoin has continued its correction down to the 95370 level and is currently testing this zone.
✔️ If the price breaks below this level and moves further down, we will start to see signs of a trend reversal. However, for short positions, I personally prefer to wait for a confirmed trend reversal.
📈 For long positions today, if the price pulls back to the 95370 zone, you can consider entering. Confirmation of the pullback can be taken from lower timeframes through candlestick signals or structural breaks.
📊 Market volume increased during the last corrective leg, which could raise the probability of a break below 95370.
👑 BTC.D Analysis
Moving on to Bitcoin dominance — the range between 64.77 and 64.91 still holds, with price fluctuating within.
⚡️ A breakout above 64.91 would confirm the continuation of the uptrend. A break below 64.77 could suggest a deeper correction.
📅 Total2 Analysis
Looking at Total2, the 1.03 support has broken and price is now moving downward. If this trend continues, it could drop to lower support levels.
⭐ However, if the break below 1.03 turns out to be a fakeout, price could rebound and head back toward 1.05.
📅 USDT.D Analysis
Finally, USDT dominance has closed above 5.10 today and may be starting its bullish leg.
💥 If this upward move continues, the market could experience a broader sell-off. Should Bitcoin triggers activate, this would be a good context to consider short positions.
❌ Disclaimer ❌
Trading futures is highly risky and dangerous. If you're not an expert, these triggers may not be suitable for you. You should first learn risk and capital management. You can also use the educational content from this channel.
Finally, these triggers reflect my personal opinions on price action, and the market may move completely against this analysis. So, do your own research before opening any position.

TradeCityPro | Bitcoin Daily Analysis #80👋 Welcome to TradeCity Pro!
Let’s dive into the Bitcoin analysis and key crypto market indicators. As usual, I’ll review the triggers for the New York futures session.
⏳ 1-Hour Timeframe
Yesterday, price made a bullish move and broke the 97139 zone, but later it turned out to be a fake breakout, and now it’s moving downward.
🔍 It’s likely that this downward move is just a pullback toward the SMA99 zone, and price may bounce back up afterward. If SMA99 breaks, deeper corrections down to 95370 are possible.
✔️ In my view, as long as price stays above the 95370 zone, Bitcoin remains in an uptrend. Only once price drops below this level can we start identifying potential bearish triggers.
📈 For now, we need to wait for more structure to develop before entering any positions. The 97139 level still remains a strong bullish trigger, but it’s best to wait for a reaction to it first so we can pinpoint the exact line, and then enter upon its breakout.
⚡️ Nothing more to add about Bitcoin for now — it’s Saturday, a weekend, and the chances of ranging price action are high.
👑 BTC.D Analysis
Looking at BTC dominance, yesterday it made a slight corrective move and pulled back to 64.77, where it seems to have found support.
📊 The next bullish trigger is the breakout of 64.91. Overall, the trend is still bullish, so if you're considering multi-day or swing positions, Bitcoin remains a better choice than altcoins.
📅 Total2 Analysis
Turning to the Total2 chart, this index was rejected from the 1.05 resistance once again yesterday and failed to hold above it. Until that changes, altcoins likely won’t see any significant upward momentum.
🔑 For downside movement in Total2, the trigger remains a break below 1.03.
📅 USDT.D Analysis
Now to Tether dominance — yesterday, this index finally closed a candle below the 4.99 level, but it was a fakeout, and it moved back above, once again preventing the broader market from turning bullish. This fakeout could inject bearish momentum into the market, potentially leading to deeper corrections.
⭐ For now, the 4.99 level still serves as a strong trigger for a bearish USDT dominance and thus a bullish signal for the market. A break above 5.10, however, would be a solid trigger for USDT dominance to trend higher.
❌ Disclaimer ❌
Trading futures is highly risky and dangerous. If you're not an expert, these triggers may not be suitable for you. You should first learn risk and capital management. You can also use the educational content from this channel.
Finally, these triggers reflect my personal opinions on price action, and the market may move completely against this analysis. So, do your own research before opening any position.

TradeCityPro | Bitcoin Daily Analysis #79👋 Welcome to TradeCity Pro!
Let’s dive into Bitcoin and key crypto index analysis. As usual, in this analysis, I’ll walk you through the futures session triggers for the New York session.
⏳ 1-Hour Timeframe
On the 1-hour timeframe, as you can see, yesterday the price stabilized above the 95370 zone and continued its movement up to 97139.
✔️ The reason the price couldn’t move higher is that the RSI failed to stay above the 70 level and didn’t enter the Overbuy zone — it got rejected there. As a result, the price also got rejected from the 97139 resistance and is currently in a corrective phase.
🧩 The SMA25 indicator has now caught up to the price, and this could bring upward momentum into the market. If that happens, the price might resume its upward move, and breaking the 97139 high could lead to a continuation toward the 98828 zone.
📊 Volume increased during the bullish candles, but after reaching the 97139 high, volume returned to previous levels, and the price has been ranging.
⚡️ Today, if RSI enters the Overbuy zone, a bullish move is very likely — in that case, I recommend definitely holding a long position.
🔽 As for short positions and bearish sentiment on Bitcoin, as I’ve been saying for a while, we should wait for a proper trend reversal before entering short trades.
📈 If the price doesn’t respond to the SMA25 and keeps ranging, the next parameter that could drive bullish momentum is the SMA99.
👑 BTC.D Analysis
Moving to Bitcoin Dominance — BTC.D is still trending upward. Yesterday, after breaking the 64.72 ceiling, it started a new bullish leg, and so far, there’s no sign of trend weakness.
🎲 I suggest waiting for a new structure to form. For now, it’s still rising, and if this continues, Bitcoin will likely outperform altcoins.
📅 Total2 Analysis
Looking at Total2, this index was rejected from the 1.05 resistance yesterday. The reason is that Bitcoin dominance surged, meaning not much money flowed into altcoins, and Total2 couldn’t break its ceiling.
🔼 If BTC.D reverses and pulls back, a lot of capital could move into altcoins — in that case, we can consider opening long positions on altcoins.
📅 USDT.D Analysis
Now to Tether Dominance — another reason Bitcoin couldn’t extend its bullish leg yesterday was this indicator. Support at 4.99 held, preventing money from entering the market, and causing the correction phase.
💫 Currently, the 4.99 level remains a crucial trigger. If it breaks, the main bullish trend in the market could begin. On the other hand, a break above 5.10 would likely push the market into a deeper correction.
❌ Disclaimer ❌
Trading futures is highly risky and dangerous. If you're not an expert, these triggers may not be suitable for you. You should first learn risk and capital management. You can also use the educational content from this channel.
Finally, these triggers reflect my personal opinions on price action, and the market may move completely against this analysis. So, do your own research before opening any position.

Silver Slips on Trade Optimism and Weak Economic Data Silver prices dropped over 1% on Thursday, slipping to around $32 per ounce, dragged by reduced safe-haven demand following Trump's optimistic remarks on potential trade deals with China, India, Japan, and South Korea.
Weak economic data further pressured prices, with the U.S. economy contracting by 0.3% and China’s manufacturing PMI falling to a 16-month low, raising concerns about industrial demand.
Today, silver is showing signs of recovery amid improved risk appetite, with the market focus on the $34.90–$35.00 resistance zone as a key technical level.
Narrow Range: $31.30 – $33.70
Wide Range: $28.50 – $34.90/35.00
