AUDUSD RangeboundMixed PMIs and US-China tussles probe buyers in the pair which is likely extending sideways grind above 55-EMA support.
Break below 55-EMA will drag the pair lower. Resumption os upside will see test of cloud base resistance.
Dailyforecast

BTC SHOWING SOME BULL RETRACEMENT BTC is holding the price at the major support not closing below the major monthly support, he tested it and moved below and returned back to the support price which shown that BTC may actually be trying some retracement of some bullish if the bearish impulse fails in the next coming days. My advise for those that are willing to invest on BTC should start investing some spare i mean small of their capital, and if it drop they should also invest more before the next bull move is goint to start

Daily Supports and Resistances // 15th April 2022(((Since I value your time, I always provide a concise summary - feel free to request more)))
Here, I expect that the price will rise to 40297, then 41062, and possibly 41511 before the end of the trading day.
Valid until 16th April
For your trade: The supports and resistances are evident; just check their repeatability:)

Gold hits fresh monthly high after Technical:
The near–term support is around $1950,
The yellow metal faces strong resistance of $1970, any breach above will take to the next level $1982/$2000/$2020.

Gold (XAUUSD) 4H Chart ForecastGold hits a fresh 8-month high as geopolitical tension intensifies. Russian President Putin has announced military operations in Donbas and explosions heard in Ukraine cities of Odesa, Kharkiv. The increase in demand for safe-haven assets is pushing the yellow metal higher. US 10-year yield lost more than 7% from yesterday's high of 2%.
DISCLAIMER: ((trade based on your own decision ))
<>

XAUUSD (GOLD) 4H ForecastFactors to watch for gold price action-
Global stock market- Bearish (Positive for gold)
US dollar index –Bullish (negative for gold)
US10-year bond yield- Bullish (negative for gold)
Technical:
The near–term support is around $1780, violation below targets $1750. Significant reversal only below $1750.The yellow metal facing strong resistance $1820, any violation above will take to the next level $1835/$1860/$1877$1912 is possible
DISCLAIMER: ((trade based on your own decision ))
<>

XAUUSD (GOLD) 4H ChartGOLD (XAUUSD) again bearish or soon breakout?
We can expect breakout and huge pump here too and on daily charts , it is more clear.
But in lower time frames we can see that correction and local fall is also expected like the red arrow on the chart.
DISCLAIMER: ((trade based on your own decision ))
<<💚💚💚💚💚💚💚💚press like👍 if you enjoy💚💚💚💚💚💚💚💚💚💚>>

EURUSD Sell the Pullback after BreakoutEURUSD has been falling within a falling channel for more than a month.
The pair is still showing strong bearish signs as it just broke below another consolidation and fell near the top of the falling channel.
Wait for pullback towards the supply level around 1.1560, between FR50% and 61.8%.
Target profit aim for 30 to 50 pips.

Gold Extends GainThe gold climbed further at the beginning of the week, following a strong bullish rebound from last week.
By now, there are multiple breakouts of falling trendlines and highs which also resulted in the formation of higher lows and higher highs.
We will wait for an opportunity to buy the pullback, expecting the price to retrace to 1755 - 1750 demand level.
If it goes beyond it will be back to 1745. Otherwise, a bullish continuation will see the price to 1780 supply level.

Is NASDAQ Out of the Wood?Nasdaq along with other US stock indices has been recovering a big chunk of losses since last week.
However, obviously, we are not out of the wood, and if we ain't, do we sell or wait?
There's still a pretty good chance we see the market tank for a second time and one of the reasons is that the pullback is still well lesser than 10%.
If you go back and look at every major pullback up to early 2020, you would have realized every major pullback went well over 10%
Another consideration is the current fundamentals are different as well - we now have a serious risk of inflation while back then we don't and the market has a lot to pump the stock market with their stimmy checks from the Fed.
Right now, we are seeing a probably M formation in the making, a formation of a bearish bat completed and just nicely seated between the Fibo levels of 61.8% and 78.6%.
Well, this trading could go wrong as far as the stock market is concerned, I think we do have a valid trade setup to sell with low risk and high reward ratio.
Besides, the price is considerably high if we based on the entire range of the market as marked out with a channel.

Let's Sell Oil at Range TopOil rebounded and recovered losses from last week but is once again resisted at the top of the entire symmetrical triangle.
Commodity prices have been somewhat cooling off a little as China clamps down on hoarding of supply which could somewhat cool off the oil market for a short while.
Traders may consider selling at the range top now with very limited risk on the upside and a pretty good reward if it goes down even to the equilibrium level just below 64.

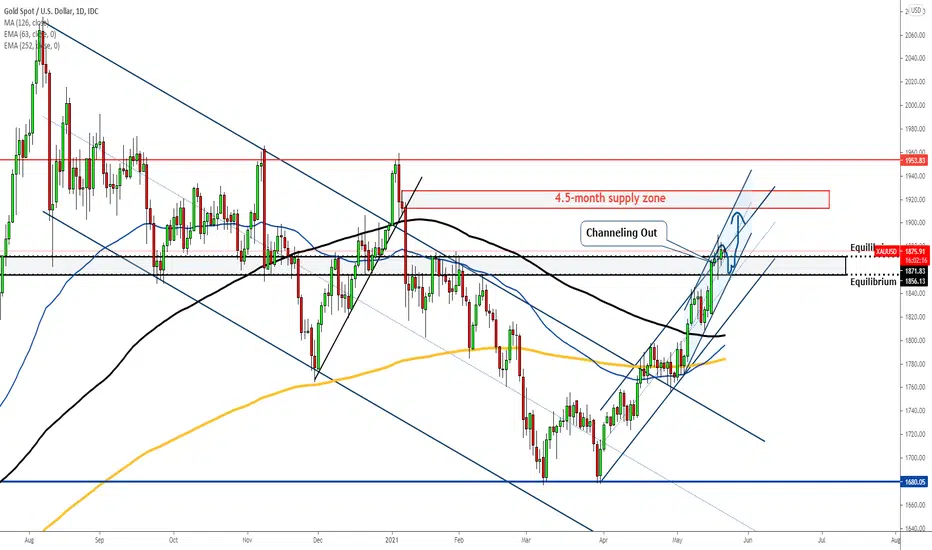
Gold Channeling Out of Another ChannelGold has been rising within a 1.5-month rising channel and the top of the channel was somewhat breached earlier this week.
However, gold struggled to make another jump as it was actually resisted at the top of another rising channel that's channeling out of the 1.5-month channel.
By now, it is obvious that the gold is currently in the process of consolidation, and based on what we've seen, it is very likely that the price will take a little dive before it shoots back up just like a person diving into the bottom of a pool and resurfaces.
We can still consider buying some on every pullback but we now target 1856 as the best price to buy.
AUDUSD Intraday BuyThroughout the day, AUDUSD has been forming nothing but higher highs and higher lows.
It has also broken above 0.7786, a neckline to the previous 2 lows.
In any case, sellers are definitely looking very weak and buyers will be able to take over easily as it now finds support at the bottom of a rising channel.

Gold Breaks Resistance; Awaiting PullbackThe gold opened low but climb throughout the Asia session and reached the equilibrium level at 1856.
The price has clearly broken above a 1-week resistance and may continue so within its current 2-month rising channel.
Wait for a pullback to 1842 to buy in again, targeting the equilibrium level at 1856, and then the top of the channel at 1871.

EURUSD: Price Action Buy at Channel BottomEURUSD has found support yesterday at 1.206, a previous resistance just a week ago.
Additionally, it was also supported at the bottom of a 1.5-month rising channel and a moving average.
And since this week's market is range-bound, there's a better chance EURUSD will rise today from the bottom of the week.

Bitcoin. Explosive move ahead? Hello Everyone,
Bitcoin is starting to look more promising as my previous analysis have shown some weakness with price action and waning selling momentum. If we close above $60,000 this week, I do believe we will continue higher.
Here are my technicals:
1. Weekly volume is starting to increase as price increases. This is confident bullish price action.
2. $60,000 held as a support line on our daily and it appears to be mostly wick which implies a buy-up or accumulation.
3. Weekly RSI has some room to grow before we hit the top of the trendline.
4. Daily Inverted Head and shoulders is very clear with the several closes above the $60,000 neckline.
So I would like to see some things happen before we end this week. Obviously the most important would be holding the $60,000 support line. I believe closing above this once massive resistance, will provide a major support area in which accumulation will occur. I also would like to see any small drops near $60,000 be bought quickly with volume. This indicates investor interest and more accumulation.
My targets are anywhere between $68,000 to $78,000 it just depends on what my indicators and gut are telling me.
As always, manage your risk, be patient, and good luck trading.

#KNCBTC #DAILYHi guys..its the latest analyze chart of KNCBTC in daily timeframe .if you are interested any crypto that you want analyze with me and any questions please do not hesitate and comment below the chart!
if u like it press like-comment and folow me.thx

#XLMUSDT #dailyHi guys..its the latest analyze chart of XLMUSDT in daily time frame.if you are interested any crypto that you want analyze with me and any questions please do not hesitate and comment below the chart!
if u like it press like-comment and folow me.thx

#ATOMUSDT #COSMOS #DAILYHi guys..its the latest analyze chart of COSMOSUSDT in daily .if you are interested any crypto that you want analyze with me and any questions please do not hesitate and comment below the chart!
if u like it press like-comment and folow me.thx

#ZRXUSDT #DAILYHi guys..its the latest analyze chart of ZRXUSDT in daily timeframe .if you are interested any crypto that you want analyze with me and any questions please do not hesitate and comment below the chart!
if u like it press like-comment and folow me.thx

#BANDUSDT #DAILYHi guys..its the latest analysis chart OF BANDUSDT IN DAILY TIME FRAME .if you are interested any crypto that you want analyze with me and any questions please do not hesitate and comment below the chart!

MTF killer zoneThis MTF Killer Zone, its drawn when yesterday or the last period closes, it so powerful .
The way I use it is buying and selling as a support and resistance zone (but its not support and resistance analysis) or at a retest when it break, and if its not touched by the price today or in the current period ... than the zone will be still valid for any time in the near future (3 to 4 days or periods in this example).
You can use it as a target if you already have an open position in the market, or using a time frame for entry and another for target.
I can send for you on request different time frame the MTFkillerzone, such as weekly and monthly also good for yearly.
I recommend to use it only major pairs, also any other financial instrument ( Commodities , indices, bonds, and equities) .
Enjoy the setup please! :)

GBPJPY: ABCD after Reversal on HarmonicJust a simple ABCD pullback after GBPJPY fell on a harmonic pattern.
Sell now or between 139.4 - 140.0
Safest SL at point D of harmonic at 140.7.
Target 137.9 and 136.0
