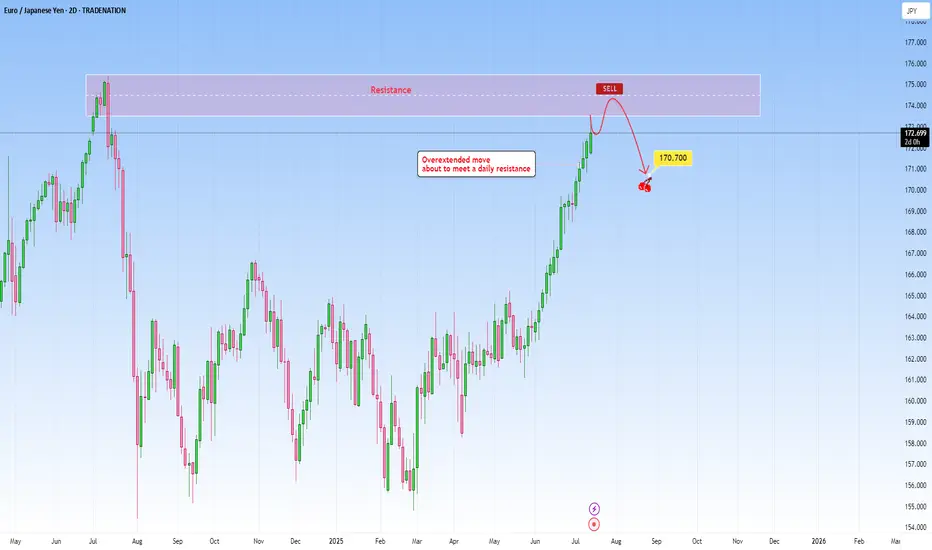
EURJPY: Overextended move to meet daily resistanceThe current market context on EURJPY shows an overextended move that has been pushing higher as price is about to reach a well-established daily resistance. The rally into this resistance lacks healthy retracements, and momentum is likely unsustainable without a deeper correction. The probability of a pause or reversal here under this circumstances increases substantially.
This extension exaggerates this imbalance making it a high probability setup. Volume and price action near this level becomes critical in this case. Signs such as long upper wicks, bearish engulfing patterns will hint that the move may be running out of steam.
I would be targeting a decent pullback towards 170.700.
Just sharing my thoughts for the charts, this isn’t financial advice. Always confirm your setups and manage your risk properly.
Disclosure: I am part of Trade Nation's Influencer program and receive a monthly fee for using their TradingView charts in my analysis.
Dailysignals
CAD/CHF: Break, Retest and Go?The market is in a strong downtrend, moving inside a visible steep channel. Price recently pulled back into a previous support-turned-resistance zone. This move appears corrective in nature, with sellers likely waiting for signs of exhaustion before re-entering in the direction of the existing trend.
Now price is reacting to the resistance zone and rejecting further upside, suggesting potential continuation lower. Ideally if price retests without closing significantly above it and forms bearish price action confirmation, it would provide a high-probability short setup: pin bars or bearish engulfing candlesticks right at retest level would help confirm the signal.
From there, continuation toward the middle of the channel becomes likely. The target projection sits near the 0.57300 level. If price fails to break lower and instead closes above the resistance zone, the setup becomes invalid and would indicate potential reversal.
In short, sellers are watching for a break and retest, aiming to ride the move down to target of near 0.57300. The downtrend would be maintained as long as price respects the current resistance and shows more signs of bearish strength.
Just sharing my thoughts for the charts, this isn’t financial advice. Always confirm your setups and manage your risk properly.
Disclosure: I am part of Trade Nation's Influencer program and receive a monthly fee for using their TradingView charts in my analysis.

EURCAD at key resistance: Will price rebound to 1.5215?The price is currently at a strong resistance level, where it has struggled to break through and reversed sharply to the downside before. This makes the area particularly important to monitor, especially for traders considering potential short setups.
If we begin to see signs of rejection at this level, such as long upper wicks, bearish candlestick patterns, or a clear loss of buying momentum, we could see a move down toward the 1.5215 level . In this particular context I am targeting a very achievable bounce. But if price cleanly breaks out, that would rule out the bearish outlook and suggest even further upside will follow.
This area is pretty important and could give us a better idea of where price is headed.
Just sharing my thoughts on support and resistance, this isn’t financial advice. Always confirm your setups and manage your risk properly.

Netflix Skyrockets After Q1 Revenue Surge: What’s Next?📺 NASDAQ:NFLX has recently exhibited a strong bullish trend, supported by both technical breakout structure and positive fundamental developments. After an extended rally from the March lows, the stock managed to break above a key resistance zone between $1,080 and $1,100, it has now been decisively cleared. With this breakout, the structure confirms bullish momentum, and the expectation is for a retest of this newly formed support area before resuming the uptrend.
The price is currently around $1,133, and a pullback into the $1,060–$1,080 zone would present a high-probability buy opportunity. This aligns with classic price action behavior: after a breakout, markets often retrace to test former resistance, now turned support. If we see it retest, it would validate the technical setup for a continuation move toward the projected target of $1,220.
🌟From a fundamental perspective, the recent Q1 earnings report (released on April 17, 2025) added strong fuel to the upside momentum. Netflix reported $10.54 billion in revenue for the quarter, exceeding Wall Street’s expectations and representing a 13% year-over-year growth. Net income also impressed, coming in at $2.9 billion. Perhaps more telling than the earnings themselves was Netflix’s decision to stop reporting quarterly subscriber numbers. This shift in focus toward profitability and revenue per user signals confidence in their monetization model and emphasizes a transition to a more mature phase of growth. Management’s tone on the earnings call adds to all this, citing growing traction in its ad-supported tier and plans to expand into live sports and podcast-style content.
💰Technically, the overall structure remains bullish. The breakout is clean, and volume is supportive. The area above $1,140 has low volume resistance, which means price can move relatively easily toward the next psychological barrier at $1,220. Any deeper pullback that breaches below $1,020 would invalidate the short-term bullish bias, as it would signal a failure to hold above former resistance and could mean the start of a deeper correction toward the trendline support from last October.
🚀 In conclusion, the current market behavior suggests Netflix is in the process of forming a bullish continuation, supported by a clean breakout above prior resistance, robust financial performance, and an optimistic revenue outlook.
Price is likely to retest the breakout zone, offering a potential long setup anticipating a move higher if momentum remains strong. The technical picture is backed by future growth plans, making Netflix a stock to watch closely in the coming weeks for confirmation of the pullback and continuation.

US DOLLAR at Key Support: Will Price Rebound to 103.000TVC:DXY is currently approaching an important support zone, an area where the price has previously shown bullish reactions. This level aligns closely with the psychological $100 , which tends to have strong market attention.
The recent momentum suggests that buyers could step in and drive the price higher. A bullish confirmation, such as a strong rejection pattern, bullish engulfing candles, or long lower wicks, would increase the probability of a bounce from this level. If I'm right and buyers regain control, the price could move toward the 103.00 level.
However, a breakout below this support would invalidate the bullish outlook, potentially leading to more even more downside.
This is not financial advice!

Tesla: bounce expected at $200 Support?NASDAQ:TSLA is currently approaching an important support zone, an area where the price has previously shown bullish reactions. This level aligns closely with the psychological $200 mark, which tends to carry added weight in the market .
The recent momentum suggests that buyers could step in and drive the price higher. A bullish confirmation, such as a strong rejection pattern, bullish engulfing candles, or long lower wicks, would increase the probability of a bounce from this level. If I'm right and buyers regain control, the price could move toward the 260.00 level.
However, a breakout below this support would invalidate the bullish outlook, potentially leading to more downside.
This is not financial advice but rather how I approach support/resistance zones. Remember, always wait for confirmation, like a rejection candle or volume spike before jumping in.

GOLD Trending Higher - Can buyers push toward 3,238?OANDA:XAUUSD is trading within a well-defined ascending channel, with price action consistently respecting both the upper and lower boundaries. The recent bullish momentum indicates that buyers are in control, suggesting a potential continuation.
The price has recently broken above a key resistance zone and may come back for a retest. If this level holds as support, it would reinforce the bullish structure and increase the likelihood of a move toward the 3,238 target, which aligns with the channel’s upper boundary.
As long as the price remains above this support zone, the bullish outlook stays intact. However, a failure to hold above this level could invalidate the bullish scenario and increase the likelihood of a pullback toward the channel’s lower boundary.
Remember, always confirm your setups and trade with solid risk management.
Best of luck!

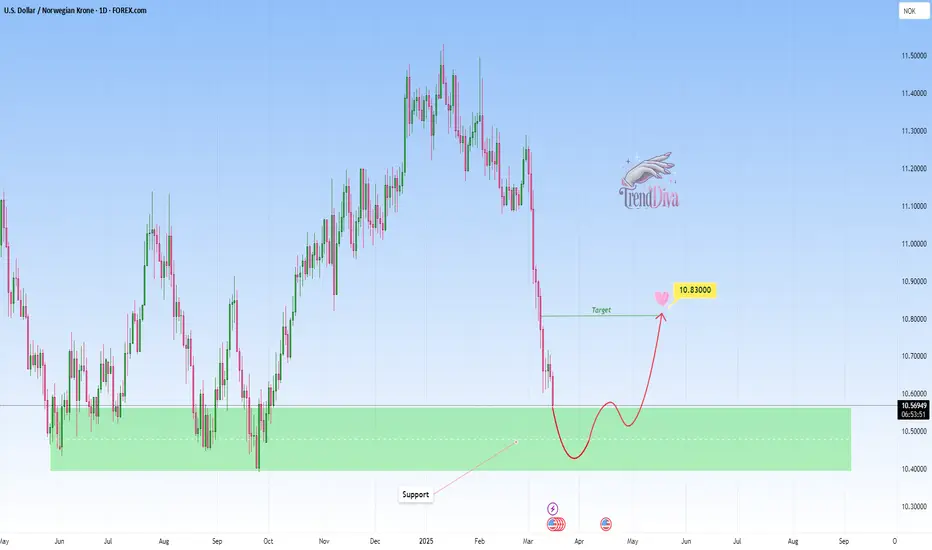
USDNOK - Buy opportunity towards 10,8300?OANDA:USDNOK is testing a clear support area, marked by previous bullish reversals and strong buyer interest. The recent bearish move into this zone suggests a potential buying opportunity if buyers confirm control.
If bullish signals, such as strong rejection wicks or bullish candlestick patterns, emerge, I anticipate an upward move toward 10,8300. If the support fails to hold however, further downside could be expected.
Remember, always confirm your setups and trade with solid risk management.
Platinum at Key Support Zone – Will Buyers Step In?OANDA:XPTUSD is approaching a significant support zone, marked by prior price reactions and strong buying interest. This area has previously acted as a key demand zone, increasing the likelihood of a bullish bounce if buyers step in.
If the price confirms support within this zone through bullish price action—such as long lower wicks or bullish engulfing candles—we could see a reversal toward 978.700, a logical target based on previous market structure and price behavior.
However, if the price breaks below this support zone and sustains, the bullish outlook would be invalidated, potentially leading to further downside.
Just my take on support and resistance zones—not financial advice. Always confirm your setups and trade with solid risk management.
Best of luck!

EURGBP at major support zone: Bullish Rebound ExpectedOANDA:EURGBP is approaching a significant support zone, highlighted by previous price reactions and strong buying interest. This area has historically acted as a key demand zone, increasing the likelihood of a bounce if buyers step in.
The current market structure suggests that if the price confirms support within this zone, we could see a bullish reversal. A successful rebound could push the pair toward the 0.83350 level, a logical target based on past price behavior and structural confluence.
Just my take on support and resistance zones—not financial advice. Always confirm your setups and trade with solid risk management.
Best of luck!

USDJPY - at potential Buy SetupOANDA:USDJPY is nearing a significant support area that has reversed bearish trends into bullish momentum. This support level aligns with prior price reactions and represents a strong foundation for potential upward moves.
If buyers confirm their presence with bullish price action, such as long lower wicks or bullish engulfing candles, I expect the price to go toward 151,100. Also, a break below this support could signal further bearish continuation.
Just my take on support and resistance zones—not financial advice. Always confirm your setups and trade with solid risk management!

SPX500: Possible bounce from key support toward 5,980?FOREXCOM:SPX500 has reached a significant support zone, highlighted by previous price reactions and strong buying interest. This area has acted as a key demand zone, increasing the likelihood of a bullish bounce if buyers step in.
The current market structure suggests that if the price confirms support within this zone, we could see a bullish reversal. A successful rebound could push the price toward 5,980 . However, if the price breaks below this zone, the bullish outlook may be invalidated, opening the possibility for further downside.
Just my take on support and resistance zones—not financial advice. Always confirm your setups and trade with solid risk management.
Best of luck!

GBPCAD at Key Resistance: Potential Selling Opportunity to 1.789OANDA:GBPCAD is trading near a robust resistance zone that aligns with prior price rejections. This area has previously attracted strong selling interest, making it a critical point to watch.
If bearish confirmation appears, such as strong upper wicks or bearish candlestick patterns, I anticipate a move toward 1.78900. But a break above this level could signal further upside and invalidate the bearish setup.
-Carefully evaluate price action at this zone before entering positions.
-Just my take on support and resistance zones—not financial advice. Always confirm your setups and trade with solid risk management.

NZDSGD at Key Resistance – Will Sellers Step In? OANDA:NZDSGD has reached a significant resistance zone. This area has historically acted as a supply zone, increasing the likelihood of a pullback if sellers step in.
The current market structure suggests that if the price confirms a rejection from this resistance, we might see a move lower toward the 0.76670 level , a clear target based on past price behavior and current market structure.
Just my take on support and resistance zones—not financial advice. Always confirm your setups and trade with solid risk management.
Best of luck!

USDCAD - Sell Opportunity After Support BreakOANDA:USDCAD recently broke through a significant support level, creating an opportunity for further bearish movement. The market is now retesting this level. A rejection off this area could push the price lower toward the 1,4120 level, confirming the breakout's strength. A failure to hold resistance could indicate a continuation of the bullish trend.
Traders should look for bearish confirmation signals, such as bearish engulfing candles or increasing sell volume, before entering short positions.
Just my take on support and resistance zones—not financial advice. Always confirm your setups and trade with solid risk management.

EURNZD - Buy Setup at Clear ZoneOANDA:EURNZD is approaching a clear support zone, marked by prior bullish reactions and buyer interest. This zone has consistently reversed bearish trends in the past, making it an interesting area to watch.
If buyers step in and confirm the support with bullish price action, such as long lower wicks or bullish engulfing patterns, I anticipate a move upward toward 1,83500. But if a break below this zone occurs, it could signal increased selling pressure and invalidate the bullish outlook.
Just my take on support and resistance zones—not financial advice. Always confirm your setups and trade with solid risk management.

SILVER at Key Resistance Zone - Sellers Ready to Step In?OANDA:XAGUSD is testing a key resistance zone, an area that has previously triggered strong selling pressure, making it a key level to watch.
If rejection occurs at this zone, such as through wicks, bearish engulfing patterns, or an increase in selling volume, sellers could regain control and drive the price lower toward the 31.650 target. This aligns with a short-term pullback scenario within the broader market structure.
However, a sustained breakout above this resistance would invalidate the bearish outlook, potentially opening the door for further upside.
This is not financial advice but rather how I approach support/resistance zones. Remember, always wait for confirmation, like a rejection candle or volume spike before jumping in.
Please boost this post, every like and comment drives me to bring you more ideas! I’d love to hear your perspective in the comments.
Best of luck , TrendDiva

Solana Buy Setup - Possible Next Big Move Towards $213!CRYPTOCAP:SOL is heading towards a key support zone, a level that has before seen strong buying interest. If this happens I can see this scenario play— price dips a bit below support, shaking out weak hands before reversing higher. It’s the classic liquidity grab, a move that could start the next leg up.
If this happens, we could see SOLANA take support with strength, signaling that buyers are stepping in aggressively. From there, momentum could build towards $213.
But there’s always the other side of the trade. If buyers fail here and SOL struggles, the direction could shift. What looks like a simple liquidity grab could turn into a breakdown, and be aiming for a deeper correction.
It all comes down to confirmation. Does price reclaim support with strength, or does it get stuck below resistance? That will be the key to watch.
Just my take on support and resistance zones—not financial advice. Always confirm your setups and trade with solid risk management!
Please boost this post, every like and comment drives me to bring you more analyses! I’d love to hear your perspective in the comments below.

WHEAT at Key Resistance Zone - Sellers Ready to Step In?PEPPERSTONE:WHEAT is approaching a key resistance zone, an area that has previously triggered strong selling pressure, making it a key level to watch.
If rejection occurs—such as wicks, bearish engulfing patterns, or a shift in momentum—sellers could regain control, driving the price lower toward the 559.0 target. This aligns with a short-term pullback scenario within the broader market structure. However, a sustained breakout above this resistance would invalidate the bearish outlook, potentially opening the door for further upside.
This is not financial advice but rather how I approach support/resistance zones. Remember, always wait for confirmation, like a rejection candle or volume spike before jumping in.
Please boost this post, every like and comment drives me to bring you more ideas! I’d love to hear your perspective in the comments.
Best of luck , TrendDiva

NZDUSD Approaching Key Resistance – Potential Sell SetupOANDA:NZDUSD is approaching a key resistance zone. Previously, this level has acted as strong supply area, leading to a bearish reaction. The ongoing bullish momentum suggests that buyers might test this level soon. A bearish confirmation, such as a strong rejection pattern, bearish engulfing candles, or long upper wicks, would increase the probability of a pullback. If sellers step in, the price could move toward the 0.56570 level.
This is not financial advice but rather how I approach support/resistance zones. Remember, always wait for confirmation, like a rejection candle or volume spike before jumping in.
Please boost this post, every like and comment drives me to bring you more ideas! I’d love to hear your perspective in the comments.
Best of luck , TrendDiva

LEAD at Key Resistance Level - Correction Incoming?FUSIONMARKETS:XPBUSD is currently testing a significant resistance zone. Previously, this area has acted as a strong barrier, leading to bearish reactions. The recent rally into this zone suggests a potential for sellers to step in and drive prices lower.
A bearish confirmation, such as a strong rejection pattern, bearish engulfing candles, or long upper wicks, would increase the probability of a pullback. If sellers regain control, the price could move toward the 1,967.000 level.
This is not financial advice but rather how I approach support/resistance zones. Remember, always wait for confirmation, like a rejection candle or volume spike before jumping in.
Please boost this post, every like and comment drives me to bring you more ideas! I’d love to hear your perspective in the comments.
Best of luck , TrendDiva

EURCAD - Sell Setup at Clear Resistance ZoneOANDA:EURCAD is approaching a significant resistance zone. This zone has consistently acted as a key area of interest where sellers regained control, leading to reversals. If the price confirms rejection through bearish price action, such as wicks signaling rejection, I anticipate a move downward toward the 1.49600 level.
However, if the price successfully breaks and holds above the zone, this would invalidate the bearish outlook and could open the door for further upside.
Proper risk management is essential, given the possibility of price breaking higher.
This is not financial advice but rather how I approach support/resistance zones. Always wait for confirmation, like a rejection candle or volume spike before jumping in. And let me know what you think of this setup in the comments!

NZDSGD - In a Clear Support Zone - Buying Opportunity Ahead?OANDA:NZDSGD is inside a key support zone that has previously acted as a strong demand level, leading to bullish momentum. The recent decline into this area suggests a potential opportunity for buyers to step in.
A bullish confirmation, such as a strong rejection pattern, bullish engulfing candle, or long lower wick, would increase the likelihood of an upward move. If buyers regain control, the price may head toward the 0.76630 level. This setup indicates a potential short-term rebound within the broader market structure
This is not financial advice but rather how I approach support/resistance zones. Remember, always wait for confirmation, like a rejection candle or volume spike before jumping in.
Please boost this post, every like and comment drives me to bring you more ideas! I’d love to hear your perspective in the comments.
Best of luck , TrendDiva
