DASH - Get Ready!Hello everyone, if you like the idea, do not forget to support with a like and follow.
DASHUSD is approaching a strong demand zone in green so we will be looking for buy setups on lower timeframes.
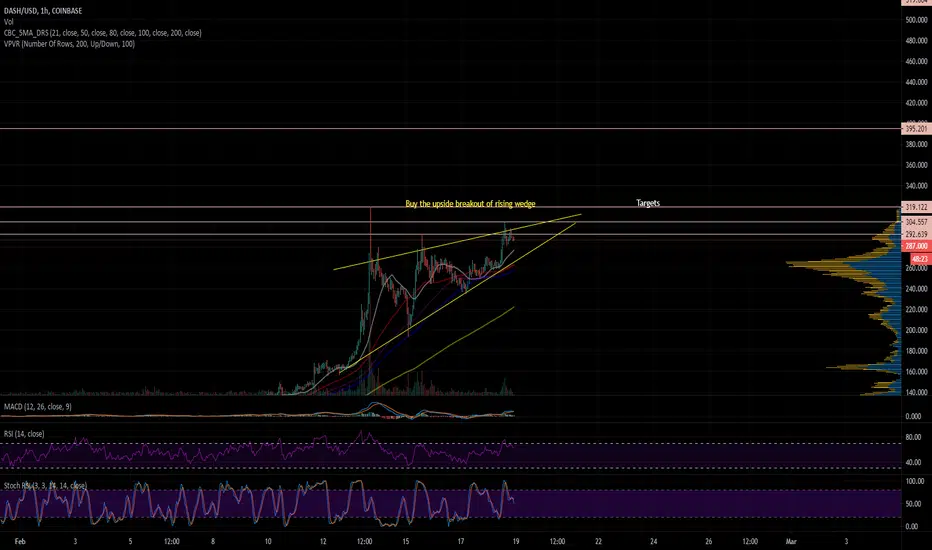
on H1: DASHUSD formed a valid channel in red so we are waiting for a new swing high to form around our upper red trendline to consider it our trigger swing. (projection in purple)
Trigger => Waiting for that swing to form and then buy after a momentum candle close above it (gray zone)
Until the buy is activated, DASHUSD would be overall bearish and can still break the demand downward.
Good luck!
~Rich
Dash

🔥Falling Wedge DASHSupport the idea with like!)❤️
#DASH/USD
📌Falling Wedge DASH
🔹Analytics: The asset is in a falling wedge, a breakout of the counter-trend will be a good signal for an upward movement, the RSI divergence confirms an upward outcome. I do not give exact points for entry-exit. Resistance lines - possible sell / correction, you can fix part of the position. All goals are shown on the chart. This is just my opinion, it may not coincide with yours.

DASH ready to explode!DASH is ready to explode!
DASH is since the last bullcycle in bearish market. Other Altcoins like ETH got out of it.
I think when BTC is again moving upwards, we can see an altseason and DASH surpassing it's ATH. The Fib Tool shows, that we can see 6500$ per DASH this year!
Wish y'all good luck! :D
20% DISCOUNT on Binance:
URK3CM0E

DASH at a low startWe entered the shopping area. When going up, a pattern of continued growth to the specified price zone will be formed. You can buy back a little, the biggest purchases should be when the price approaches the red line.
There is a very good reversal picture on small time frames, look at the clock.
The altseason indicator shows that now is the positive period for buying the altseason.
Happy trades, friends, and lots of money for you!
Donate:
USDT (TRX network, no commission): TSDf9xQjLGnUtpw838sHSBXZxG174BM5E7

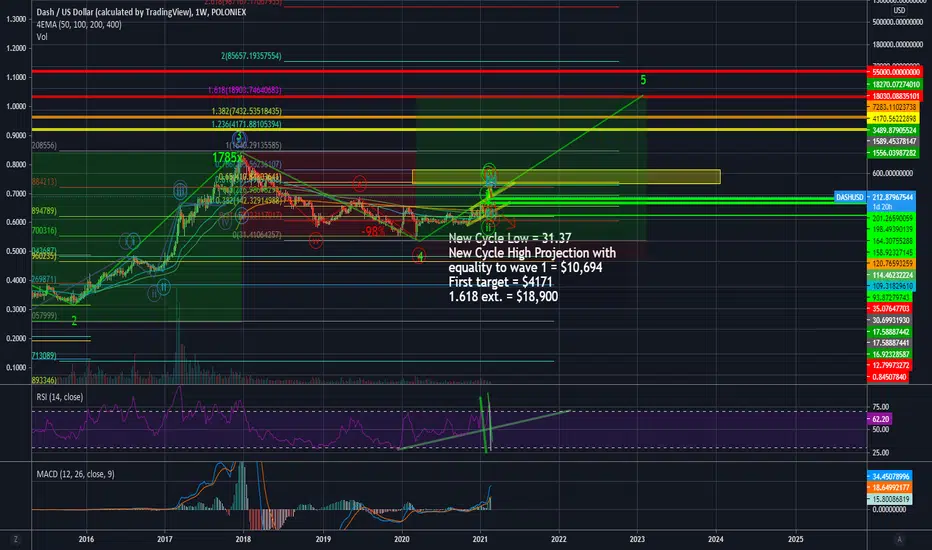
Lambo dreams.Just wanted to share how I see the DASH cycles. DASH is awesome!
I think we're in a short term correction right now, but that the higher trend is bullish. I see us inside the final 5th wave bull cycle and that it's going to be awesome like you can't believe, BUT... I am keeping a close eye on the dollar. USD is at a strange point where it could reverse and pull everything down for a bit, so if the dollar can continue a move higher next week I might wait a bit before buying unless something changes.
Looking at a possible long position at $160.


Keep DOORDASH on your watchlist, it is making a flag..!Daily candle close above 192 is key confirmation for breaking upward..! Wait for that!


🔥 DASH Falling After Weak BounceAfter a great bounce from $200, DASH seems to be falling again. To be precise, DASH is following Bitcoin to the letter. Check out my Bitcoin analysis below.
On the chart I’ve marked two potential areas of support, S1 and S2. These areas are based on recent swing lows and round numbers. Do your own due diligence.
Happy trading!


Dash can catch up really fastI'm not a volume expert, but I do see a repetitive pattern there
The dash is very volatile and could really catch up to the ATH in 3-4 months
By every push there is a drop in the volume and then again volume goes up...
There are almost no resistances and Dash being cage-less now
But how did the price go so high in 2018 when the volume was so poor?


DASH is Priming the PumpDash is getting ready to move to the upside, given that BTC can hold or maybe even move sideways ideally. Just a quick chart, this is not trading advice.

Buying Areas Of 12 Altcoins!Hi,
Thank you all for being active to comment on your favorite two altcoins. Hopefully, you find something helpful from the post below, and if you do then do not forget to hit the like button!
Here is technical analysis, breakout- and correction scenarios, of the top 12 mentioned altcoins, enjoy it!
1) LITECOIN (LTC/USD)
Too weak top to make a breakout trade, the best opportunity becomes after the correction to $150-$180 and criteria:
1) Trendline
2) Previous resistance becomes support
3) Daily EMA 50
4) If the current top stays then also Fibonacci levels 38 and 62 are supporting that area
2) CARDANO (ADA/USD)
Quite a strong breakout area, as shown - strong 4-hour candle close above the round number 1.0000.... (without any significant high wick), wait for a retest of it and it should be ready to go to the higher prices.
3) BINANCE COIN (BNB/USD)
Very strong buying area, $130-$160, after it gets a downwards correction. Too high to make a breakout trade so, the safest would be to wait for a correction. Bad luck if it doesn't come but it is the safest and strongest way to buy BNB. Criteria:
1) Previous resistance becomes support
2) The trendline
3) 4H EMA 50 and 100
4) 50% drop from the current peak. This criterion works perfectly IF the corrections become to the shown area ;)
4) RIPPLE (XRP/USD)
Two options, go right away for mid-, long-term perspective or wait for a break and retest of 0.65000 (higher light-blue area), Daily candle close above 0.65 will confirm it, it is also a bit safer to target after the breakout of 0.65. The first target should stay around 1.0000
5) EOS (EOS/USD)
The previously shared retest of 3.500 worked perfectly. Hopefully, we get another breakout and retest after that. Daily candle close above 6.000 and wait for a retest around 5.500.
6) POLKADOT (DOT)
Waiting for a correction to 17 - 21 and criteria:
1) Previously worked resistance become support
2) Daily 50 EMA
3) 50% drop from the current peak
7) DASH (DASH/USD)
Two areas, the higher one is a bit risky and the lower one is quite unlikely BUT I still wait for that lower one if I would like to buy DASH because the area is not retested and 50% drop matching perfectly with the lower shown buying zone.
8) AAVE (AAVE/USD)
It has several breakout opportunities: a 4-hour candle close above 500 and it should be ready to go higher. The second one - 4h candle close above 550 and it should be ready to go higher. So, choose what do you like but the strongest and the safest way is to wait for a correction at a bit lower prices.
$280 - $335 is a very strong support area with a lot of criteria matching each other in one zone:
1) Previously worked resistance becomes support
2) 50% drop from the current peak
3) Channel projection
4) Fibonacci retracement 62%
5) Equal waves from the top AB=CD
6) Daily 50 EMA
9) STELLAR (XLM/USD)
Breakout opportunity:
Again, I want to see lower prices and a perfect area would be around 0.30 - 0.38, criteria:
1) Previously worked resistance becomes support
2) 2x Fibonacci retracement 62%
3) 50% drop from the top
4) Daily 50 EMA
5) The trendline
10) VECHAIN (VET/USD)
Breakout opportunity: strong 4h candle close above 0.06, wait for a retest and it should be ready to climb.
The second opportunity is to wait for a correction to 0.03 - 0.037. Criteria:
1) The trendline
2) Fibo 62%
3) Channel projection
4) Previously worked resistance becomes support
5) 50% drop
11) REEF (REEF/USD)
Breakout opportunity: Wait for a 4h candle close above 0.045
The correction will drive the price to 0.0265 - 0.033 and the criteria are:
1) Previously worked resistance becomes support
2) Channel projection
3) Fibo 62%
4) 50% drop
5) The trendline
12) CHAINLINK (LINK/USD)
Breakout opportunity: wait for a 4H candle close above 35, wait for a retest and it should be ready to go higher.
Did you find anything useful?
Stay healthy,
Vaido

DASHUSDTSymmetrical triangle formingon the 4HR and 1Hr timeframes.
Wait for a break and close of the upper or lower trend line to confirm direction before takign the trade

Head and shoulders pattern on dash/btcA strong head and shoulders pattern observed from dashbtc chart.
Warning ⚠️
Try not to battle with the market.
It's not signal for sell or buy.


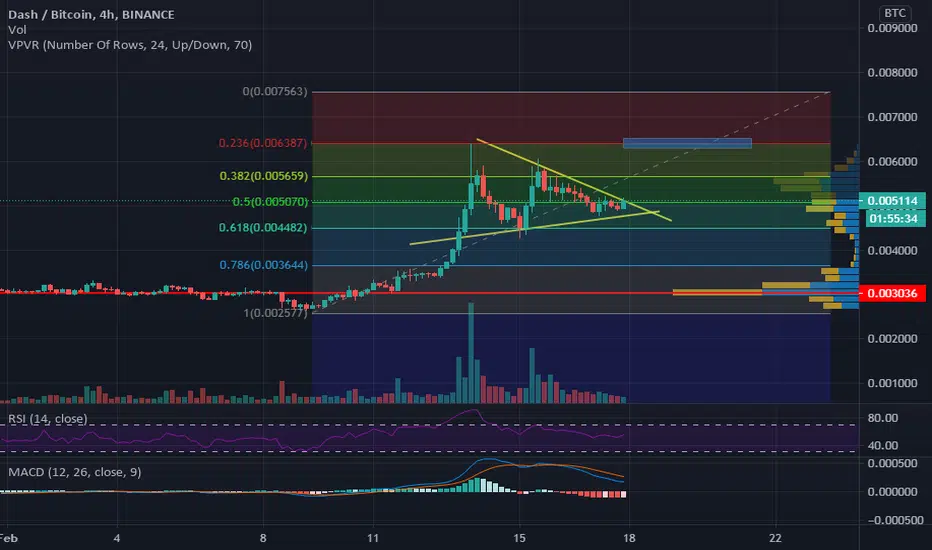
Possibilities in $DASHsaw an Ascending Channel or Rising wedge at $DASH 4hr tf...
This could be right, this could be wrong...
Trade at your own risk...


🔥 DASH Going Parabolic: New BNB?DASH has shown some crazy returns in the last couple of days. In my previous two analysis, I argued that price action was picking up and that a strong bullish move was at hand. Please take a look at my previous two DASH analysis for reference:
Currently, DASH has managed to break through R2 of my most recent analysis. Seeing the current price action, this new bullish move could be the start of something more. We've all seen BNB and the ridiculous move it made in the last few weeks, gaining almost 1,000%. DASH could potentially be the new BNB. I'm not seeing a 1,000% anytime soon, but if we continue with the current trend we could easily hit $500 within a few weeks.
Furthermore, investors who have missed the BNB train are most likely looking for another booming large cap coin to pump. DASH would be the ideal candidate. Agree?
On the chart I’ve marked two potential areas of resistance, $350 and $400. Do your own due diligence.
Happy trading!