DASH - Waiting For Breakout!Hi, this is my new update for DASH. After three days with red candles we are smashing all of them with one big green candle. Right now we are in a critical moment, first of all we have smashed both 100D moving average and 200D moving average at the same time and if today we close the candle above these levels then we are good to go, but we have one big trendline that we have already been rejected 6 times, so it is very important to get through it and close one candle above it. If we break the trendline the next stop is to test the resistance $215 and if we break that too then we are ready to fill the gap between $215-250. I expect professional traders are going to take positions when we close the candle above the trendline and we are going easily to break the $215 resistance. So be patient and don't PANIC ;)
Dashusd

Dash bull 300%I have no illusions that we will surpass the peak of 17, but this year's peak is a real goal. 200-300%
last year we made 600 percent from November 5th. this was our bottom. this year our bottom was July 16. If we do the same, then we still have the potential of 300%
my dream is 1000 dollars.
To be realistic - $ 700

DASHUSDT : Double bottom in the wedge In 4h chart
It still converging in the wedge but it broke out the blue short downtrend .
If price break out the neckline and stand firm,it make double bottom completed ,trading strategy as below .
SL: 185.2
TP1: 214.1
TP2: 232.5
TP3: 240.0
TP4: 248.0
TP5: 256.0
TP6: 281.9
If you like this analysis, give it a like or share your thought or let me know what crypto TA you want to know.

DASH | Huge Breakout Coming..!!#DASH/USDT (Update)
In daily timeframe, Consolidating in Symmetrical Triangle Pattern..
At the Moment, On the Verge of Breakout, Expecting Upside Breakout📈
Buy Some & Hold it for Midterm..!!
Please like the idea for Support & Subscribe for More ideas like this and share your ideas and charts in Comments Section..!!
Thanks for Your Love & Support..!!

DASHUSD ViewA trendline that can be drawn on the DASHUSD 1D chart
A clear pivot point
Very close to this point
Closer the better the buy potential

DASH - Future Projection SeriesIf you’ve read any of my previous “Future Projection” posts, skip down to the conclusion as these paragraphs are the same.
During the downturns in the market I spent time learning more about utilizing the charting functions in TradingView. I also watch a lot of youtube vids about crypto and charting concepts. I came across a good chunk of info on using the “log” function and what it could possible show me.
At this point in the crypto cycle, even though I feel we are nearing a parabolic stage, it is beyond the point to expect 50X or more from me or any basic Joe who “dabbles” in crypto investing. Think long term. What can I realistically (if that even exists in Crypto) expect a coin to perform in the next bull run. Well the log function gives me a level playing field to do just that.
Using the log function, I utilize a common start date as the beginning of my parallel channel. That date is the big drop Mar/20. The parallel channel runs from the bottom of the Mar/20 drop forward in time along the bottom dips. The top of the channel is the highpoint in the cycle.
The first future projection is created using the green trend lines, the first from the top of the cycle peak to the bottom, and another from that lowest point up forward in time to what I estimate as the timeframe for top cycle which approximates end of Q4, and my birthday Jan/7 so thats the future date for all graphs in this series.
The second future projection takes ratio’d growth into consideration. This is done using the blue trend line which starts at the first peak after the Mar/20 drop, using the top of arcs as the guidance. I carry this line forward to Jan/7.
Conclusion; At the time I drew this one the price was $1.98
First Projection $984
984 / 1.98 = 5 X
Second Projection $1,469
1,469 / 1.98 = 7.4 X
Now for a regular old fellow such as myself, a 5 to maybe 7 X on my money within the next few months is a good investment. It literally involves 2 trades. Timing is not a great big deal as long as you get in near 1.98 otherwise the X factors changes a lot. Timing to get out is the top of the curve. This is a day time factor. It’ll be “at the top” for days or a week. You’re not chasing a pump or a knife here, its a month(s) trade. Or a parabolic week so watch close.
I’ve done this for a lot of coins now and the results are sometimes very interesting in that, a popular coin just doesn’t have the numbers or that it really has good numbers. I found as an average I like results in the 5 or above range for the first projection and 15 or above for the second projection. If I utilize this investment concept and choose coins with similar numbers I can reasonably expect a 10-15 X overall. I’ll post a few others I find interesting for this bull run in the coming posts.
My thoughts, not advice Oklah. Cheers

DASH - Potential Long Opportunity If the prospect of another crypto bull cycle is upon us, this could be an opportunity to accumulate more KRAKEN:DASHUSD . The macro picture is a long standing Wycoff Accumulation pattern which appears to be nearing completion.

DASH - rocket at the start 😮🚀🚀A trend line has formed on the DASH chart. The price has already tested this trendline 5 times, with each test the resistance is weakening and a breakout may occur soon.
In addition, it is worth noting that the price is contracting and moving in small candles, which is also a signal of accumulation of strength before a breakout.
And of course don't forget to subscribe to our tradingview and other platforms, leave the name of the coin you want us to analyse in the comments. 💚

DASHUSDT - Buy after the timing showedBYBIT:DASHUSDT
4H trend chart
-
DASH is consolidating since falling from M pattern.
Now it is converging and accumulating.
If price can break through the downtrend line, trading strategy as below.
*Take some profit at Optional TP if price break the line in the lower part of chart.
-
Profit Targets:
a) 213.7----Fib(1)/Optional TP
b) 232~239.4----Fib(1.272~1.382)
c) 247.3----Fib(1.5)
d) 280.9----Fib(2)
Stop losses:
a) 176.8-----Red horizontal ray
-
If you like this analysis, smash the "like button" and leave a comment below to share your thoughts
or let me know what crypto you want to see!
Trading is a reflection of yourself. Learn more daily and be ready for every opportunity.
Have a nice trading!

DASHUSD Target Price 214.90DASHUSD closed above Diagonal Trend Level, Horizontal Support Resistance Level, EMA 10 Level, and EMA 20 Level.

BULLISH - DASHDASH: looks like a tank imo. Still consolidating in this symmetrical triangle before it rips to 490-500

Will DASHUSDT fall based on this Rising Wedge?!This is more of a lesson of rising wedge than a analyses if it go as planned (don't let the name decieve you! LOL)
the starting point and TP are on the chart.

DASHUSDT : Pattern completed and modify the SL
Click the pic to read last post and detail
The double bottom completed ,so we follow the last post modify SL 170.3 to 178.7 and the same TP.
TP1:198.8
TP2:213.1
TP3:218.9
TP4:225.1
TP5:251.3
If you like this analysis, give it a like or share your thought or let me know what crypto TA you want to know.

$DASH: Hold or sell?!Hello and welcome to this quick market analysis.
This one is recommended from one of you guys, I always respect my followers wishes so don’t be a stranger and comment your favorite chart and I will share my insights on it ;)
Basic data is written on the chart so I just review them here real quick:
.$DASH is printing higher lows on weekly time frame which is a very good sign
.Price is moving in a rising wedge, which is a continuation pattern so the drop is more possible rn.
.We are currently above the previous MSB and as long as we hold it I expect $DASH to break above this wedge and finish this term correction phase.
.Breaking out above this wedge is very bullish
.Best place to buy is either waiting for a breakout or testing the lower line of this wedge
(I PREFER BUY AT $190)
If you are holding $DASH, keep in mind that loosing $154-$145 will be very costly!
You tell me now, is $DASH bullish or bearish?

Dash DASHUSDT - Ascending channel + new ATH soon!- Dash DASH - Rank #65 on coinmarketcap
- On the weekly chart we can spot a huge ascending channel
- The price respects a support trendline
- Profit target is 1:1 extension or top of the channel
- For expected duration of the trade, probability, stop loss, profit target, entry price and risk to reward ratio ( RRR ) - please check my signature below ↓
- If you want to see more of these ideas, hit "Like" & "Follow"!

Dash doesnt have brakes!!Highest Probabilty for 5th is Orange
Green if Extended
Touching magneta Channel is where you look for exiting
Red is where all of this Invalid

Will DASH Surge after the pattern confirmation ?
In last post , price broke out the channel and hesitant.
In 4h timeframe ,there is a potential cup and handle pattern.
After price break out 198.8 , we can modify SL 170.3 to 178.7 and the same TP.
TP1:198.8
TP2:213.1
TP3:218.9
TP4:225.1
TP5:251.3
If you like this analysis, give it a like or share your thought or let me know what crypto TA you want to know.

DASH About To Break Above SoonWith the recent price action after last ABC correction, DASH has formed a nice triangle that could also act as a reversal pattern as there are clear higher lows being formed. If we break above the triangle on the 3rd attempt we have to then also break obove the $220.6 zone to invalidate an ABC correction (climbing above the B wave).
If all this happens, price should climb even higher breaking the final short term ressistence, sitting at $285. Market looks very bullish overall and the alt season is right arround the corner imo.
I am not a financial advisor so non of this should be taken as a financial advise. Stay safe.
BINANCE:DASHUSDT

DASH/USDTDash has been creating higher lows on the higher time frames for quite some time now. On the 4h TF, it has created a consolidation zone between 195 - 180 which is trying to break out off to the upside. On top of that, it has left a huge liquidity void from the last crash on 7th September which never got filled. I am expecting Dash to reclaim some of its price in its attempt to clear out the order clusters created by that liquidity void. We may see price retest at 211 and 230 resistances respectively.

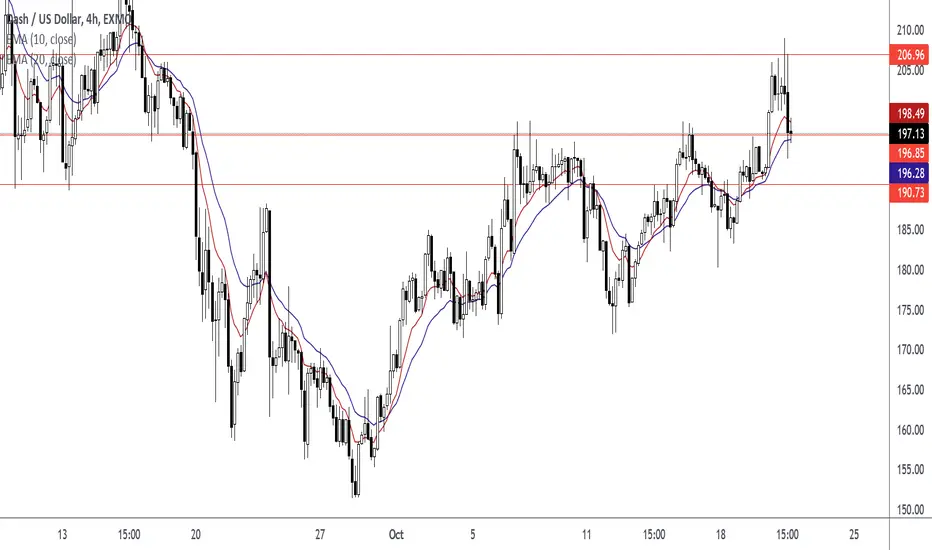
DASHUSD Target Price 198.59DASHUSD Dynamic Support Resistance and Static Support Resistance Levels
EMA 10 Level
Support Resistance Level
Fibonacci Level
EMA 20 Level

DASH LongHello friends
Dash at the good place for open long
you can wait to retest the line then open position or open now, but waiting for retest maybe more safe but it is possible that we go up without retesting the line!
I personally open position right now
Good Luck, have fun

Can DASH D breakout bearlish channel ?In DASHUSDT D
It is trying to breakout the bearlish channel.
If the breakout can be confirmation
*with short upper shadow
SL:170.3
TP1:198.8
TP2:213.1
TP3:218.9
TP4:225.1
TP5:251.3
If you like this analysis, give it a like or share your thought or let me know what crypto TA you want to know.
