DASH/USDT 1h (SHORT CALL)There is double top and Dashs Upside trend got broke. Targets on the chart. Please Follow and Like this post for more!
DASHUSDT

DASHUSDT : Potential double bottom and TP..In 4h chart
There is a potential double bottom in the 4h.
If price break out and stand firm above the neckline ,trading strategy as below.
SL: 139.9
TP1: 170.7
TP2: 176.0
TP3: 181.6
TP4: 187.2
TP5: 205.4
If you like this analysis, give it a like or share your thought or let me know what crypto TA you want to know.

DASHUSDT - AnalysisHi Traders,
Sharing my Technical Analysis with you. Solely meant to improve my learning curve. Hope you like it.
EngineeringRobo is Bullish for DASHUSDT at the moment.
Trading plan:
Buy:
50% now (2 buy signals + break the trendline)
25% if it bounches back on the 135 support line
25% if daily close at 172 support line
Sell:
50% at 250
25% at 325
25% at 450
Unless the signals tell me otherwise.
You have DASHUSDT? No rush to sell now.
Good luck & all the best,
Father of 3.

DASH - Nuclear Missile to $6,000I believe DASH is about to lead the "Privacy" hyped market. I think DeFi and Meme coins are done and a new trend will be privacy coins. DASH is a ticking timebomb in my personal opinion and $6,000 is my target for one DASH coin.

spot & hold DASHwe every body cheep DASH/USDT
now again DASH/USDT is on our situation that we want
buy and hold
we want take 25% profit from DASH team

DASH - Optimistic Road Map!Hello everyone, if you like the idea, do not forget to support with a like and follow.
DASH is approaching a strong support in green so we will be looking for buy setups.
on DAILY: DASH is forming a channel in brown but the upper trendline is not valid yet, so we are waiting for a new swing high to form around it to consider it our trigger swing. (projection in purple)
Long-term:
Trigger => Waiting for that swing to form and then buy after a momentum candle close above it (gray zone)
Short-term:
For the bulls to take over from a short-term perspective, we need a break above the last high. (green zone)
Meanwhile, until the buy is activated, DASH would be overall bearish can still trade lower till the lower till inside the green support.
Good luck!
All Strategies Are Good; If Managed Properly!
~Rich

Falling Wedge on DASHBTCFrom may 6th this year dash is forming a nice falling wedge (bullish wedge) these wedges are really good chart patterns especially after a great downward movement. But how we can tell that this downward move is a corection not the resume of the underlying downtrend eversince 0.12Btc (ATH)?
simply we can't say for sure but there are signs of reversal. First of all when doing these kind of analysis we should take a look at some fundamental features of the asset that we are willing to buy. We dont want to waste our money, right?! (as lot of people are doing right now).
The most important thing about dash is that this coin is one of the most used coins as day to day payments that even bitcoin is incapable of doing so without lighting network. Dash is among top ten ATM supported coins (just google it) and it is because of its speed and its very low fee among other coins. So back to the topic we now know that we are not talking about a hype. we are talking about something that has usecases right now and will be used for years because of its utility abilities regardless of price action.
About technicals:
As you may know I'm a quantitative analyst and I make indicators and trading systems with my colleague. I dont like to complicate things as other novice traders do and I dont like to use a lot of indicators. Most of the time you should see the bigger picture of market and should see the emerging opportunities and big reversals. You can not be precise about price and time.
We can say it is more probable that this downward movement is a correction to the upward movement that started from the begining of 2021 in DASHBTC pair because the downward move consumed more time and less price and it formed a falling wedge and now it is time to break this formation. A false break to downside is probable but odds of a soon reversal is pretty nice I suppose.
I putted a fibonacci on time axis and as you can see we are reaching 1.618 (an important ratio) of the time it took for dash to move up from 0.002326 in jan to 0.0083 in may. I'm not telling that we are reversing in immediate future but I found these ratios useful in manual trading. So to recap what I said it is wise to keep an eye on this chart and see the oppurtunity; You can buy in a possible false breakout or to wait for actual breakout to upside. I either case do not forget to use stoploss and mange your risk.

DASH - Super Signal? DASH is one of those coins that one day is not worth anything at all, and the next day everyone is trying to buy it. I wouldn't be surprised to see DASH trading at $1800 very soon

DASHUSDT Analysis (LOCAL VISION)Hello friends.
Please support my work by clicking the LIKE button(If you liked).Thank you!
Everything on the chart.
Entry: market and lower
TP: 168 - 188 - 210
after first target reached move ur stop to breakeven
Stop: ~122 (depending of ur risk). ALWAYS follow ur RM .
Risk/Reward 1 to 5
risk is justified
Good luck everyone!
Follow me on TRADINGView, if you don't want to miss my next analysis or signals.
It's not financial advice.
Dont Forget, always make your own research before to trade my ideas!
Open to any questions and suggestions.


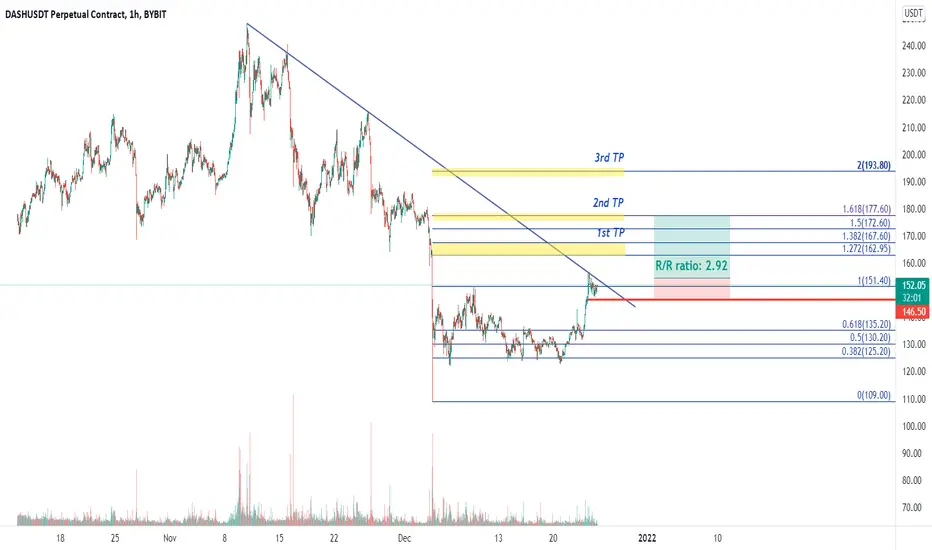
DASH - TP/SL for getting rid of this trend lineBYBIT:DASHUSDT
1H trend chart
-
DASH is squeezing under the downtrend line.
If price can break out the trend line, we can have a trading strategy with 2.92 R/R ratio.
-
Profit Targets:
a) 162.95~167.6----Fib(1.272~1.382)
b) 177.6----Fib(1.618)
c) 193.8----Fib(2)
Stop losses:
a) 146.5-----Red horizontal ray
-
If you like this analysis, smash the "like button" and leave a comment below to share your thoughts
or let me know what crypto you want to see!
Trading is a reflection of yourself. Learn more daily and be ready for every opportunity.
Have a nice trading!

DASHUSDT-SHORT There is a short position in DASHUSDT Dash
DASHUSDT Dash
🔴Short Now or set on Key Level 140.0
🟢Target 1 132.0
🟢Target 2 127.5
❌Stop loss 144.0
#K_Level

20% profit 4 holder in DASHOur team's opinion is to buy a dash and maintain it until it receives a 20% profit.
Stop Loss is your best friend.
step 1 = Weaker
sterp 2 = Stronger

DASHUSDT-LONGThere is a long position in DASHUSDT Dash
DASHUSDT Dash
🔵Long Now or set on Key Level 122.5
🟢Target 1 129.3
🟢Target 2 140.0
❌Stop loss 120.0
#K_Level

DASH - Breakout and TP/SLBYBIT:DASHUSDT
1H trend chart
-
DASH is breaking out the long-term downtrend line on 1H
If price can keep being here, trading strategy as below.
-
Profit Targets:
a) 133.3~134.1----Fib(1.272~1.382)
b) 135.85----Fib(1.618)
c) 138.65----Fib(2)
Stop losses:
a) 128.30-----Red horizontal ray
-
If you like this analysis, smash the "like button" and leave a comment below to share your thoughts
or let me know what crypto you want to see!
Trading is a reflection of yourself. Learn more daily and be ready for every opportunity.
Have a nice trading!

DASHUSDT-LONGThere is a long position in DASHUSDT Dash
DASHUSDT Dash
🔵Long Now or set on Key Level 134.3
🟢Target 1 154.8
🟢Target 2 169.2
❌Stop loss 125.3
#K_Level

DASHUSDT AnalysisHello friends.
Please support my work by clicking the LIKE button(If you liked).Thank you!
Everything on the chart.
open pos: market and lower
target: 230 - 275 - 320
after first target reached move ur stop to breakeven
stop: ~under 142 (depending of ur risk). ALWAYS follow ur RM .
risk/reward 1 to 3
risk is justified
Good luck everyone!
Follow me on TRADINGView, if you don't want to miss my next analysis or signals.
It's not financial advice.
Dont Forget, always make your own research before to trade my ideas!
Open to your questions or suggestions.


Dash to $420+ up, up!Dash is in good correction since May 2021, and it may form a good 'W', repeating local high and retracing back down to 0.618 fib.
Good Risk reward trade.
The worst scenario is breaking down the trendline, which could result in longer correction or even bear market.

DASHWe have very good trade on DASHUSD or DASHUSDT 2 buying options. one of them will be the winner, stay tuned.


DASHUSDT-SHORT There is a short position in DASHUSDT
DASHUSDT Dash
🔴Short Now or set on Key Level 181.8
🟢Target 1 171.0
🟢Target 2 160.3
❌Stop loss 189.0
#K_Level
