Will the Canada-US Trade Tension Continue to Impair CAD?Fundamental approach:
- USDCAD advanced this week, supported by broad US dollar strength and renewed trade tensions as the US announced higher tariffs on Canadian imports.
- The pair was further buoyed after the BoC left rates unchanged and signaled caution amid persistent core inflation and ongoing trade negotiations.
- Meanwhile, US labor data indicated that job openings were moderating growth while tariff-related uncertainty weighed on risk sentiment.
- The BoC’s decision to keep its policy rate at 2.75% cited domestic economic resilience and the unpredictable US trade policy outlook.
- At the same time, negotiations between Canada and the US over trade terms remained in an “intense” phase, with additional tariffs entering effect 1 Aug, adding to downside risks for the Canadian economy.
- USDCAD may remain elevated next week as markets monitor follow-through from new tariffs and assess further data on US jobs and Canadian trade. Potential progress or setbacks in Canada-US trade talks and upcoming economic releases could influence direction, while central bank policy signals and risk appetite will remain key catalysts.
Technical approach:
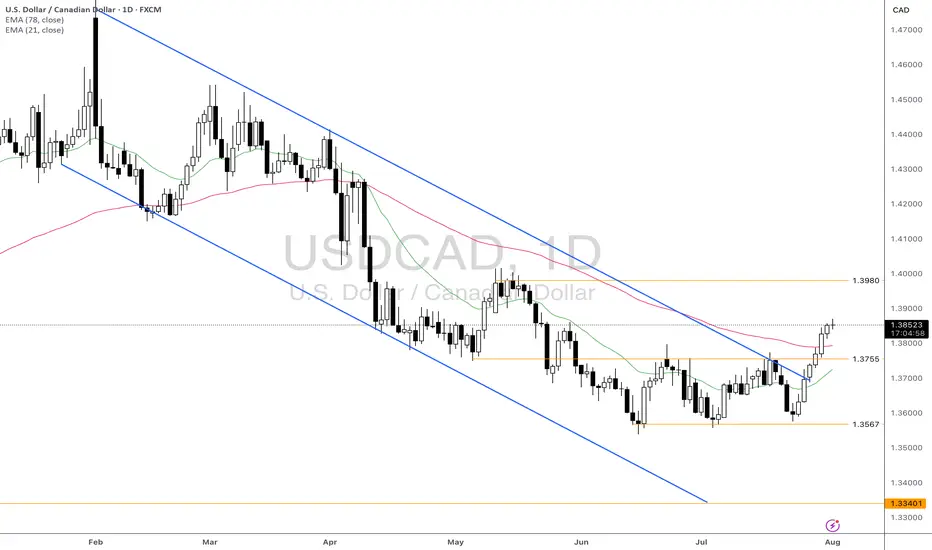
- USDCAD formed a Triple-bottom pattern at around 1.3567 and bounced up to break the neckline at 1.3755. The price also broke the descending trendline and closed higher than both EMAs, indicating a potential trend reversal.
- If USDCAD remains above the support at 1.3755 and both EMAs, the price may retest the resistance at 1.3980.
- On the contrary, closing below the support at 1.3755 and both EMAs may lead USDCAD to retest the key support at 1.3567.
Analysis by: Dat Tong, Senior Financial Markets Strategist at Exness
Dattong
Will Upcoming Data Determine the Next Gold's Direction?Macro approach:
- Gold retreated this week, reversing early gains to trade near four-week lows amid renewed US dollar strength and caution ahead of the Fed's policy decision.
- The retreat was mainly pressured by stronger-than-expected US economic data and a tentative revival in risk appetite, offsetting pockets of safe-haven demand.
- Key drivers included robust US GDP growth for 2Q, a bounce in consumer confidence, and the Fed's steady rates with a more hawkish tone, suggesting cuts may be further out.
- Meanwhile, recent US-EU and US-China trade deals eased some global uncertainty, damping gold's appeal as a hedge.
- Market participants also eyed the labor market's continued cooling, but resilient consumer spending further buoyed the dollar.
- Gold may remain volatile, with potential upside if upcoming US PCE inflation and NFP reports disappoint expectations. Any escalation in trade tensions or signals of Fed policy easing could renew support for gold prices.
Technical approach:
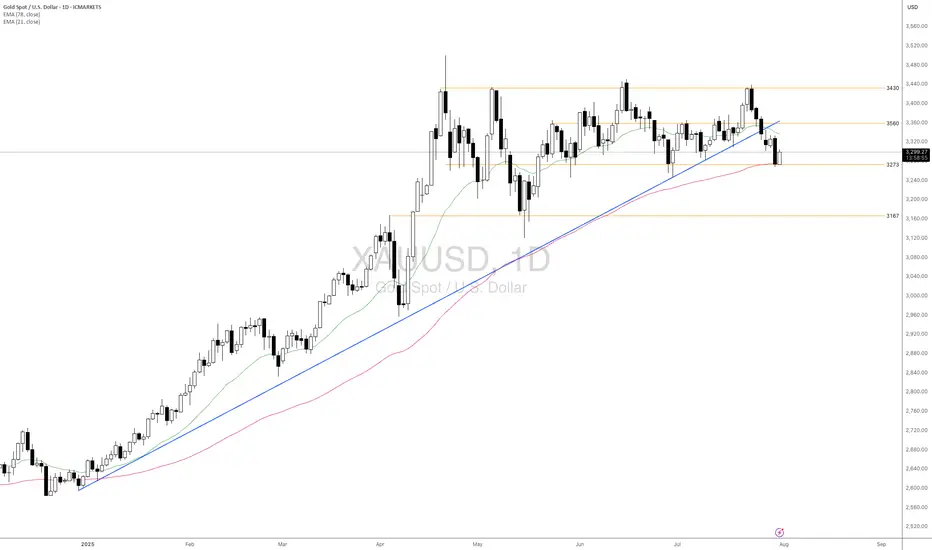
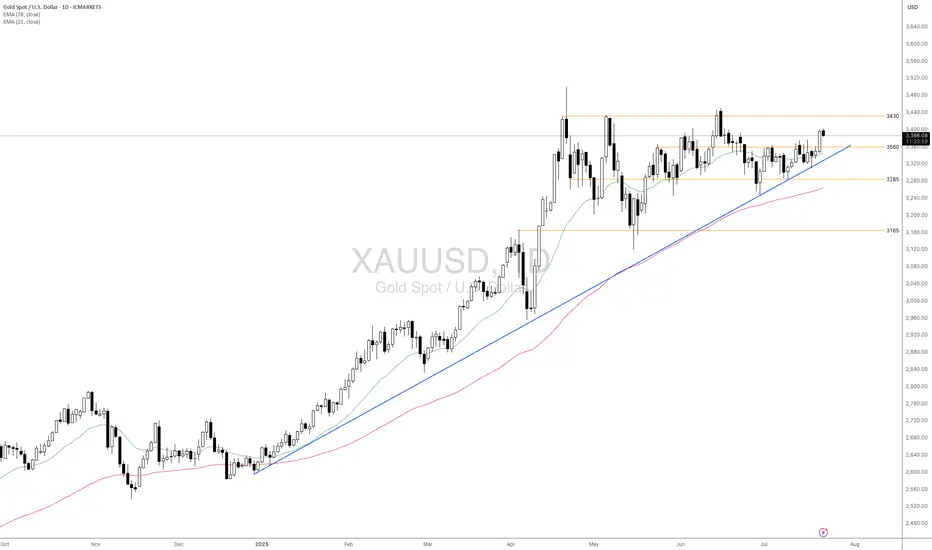
- XAUUSD fluctuated within the range of 3285-3560, which is below the broken ascending trendline. The price between the two EMAs awaits an apparent breakout to determine the next trend.
- If XAUUSD breaks below the support at 3273, confluence with EMA78, the price may plunge to retest the following support at 3167.
- On the contrary, remaining above the support at 3273 may lead XAUUSD to retest the resistance at around 3560.
Analysis by: Dat Tong, Senior Financial Markets Strategist at Exness
Will DXY Get Supported With Fresh US-EU Trade Agreement?Macro approach:
- The US dollar index has traded mixed since last week, pressured by lingering trade uncertainty and cautious market sentiment ahead of major economic events.
- Dovish Fed expectations and subdued US inflation continued to weigh on the greenback, while news of a fresh US-EU trade agreement and upcoming talks with China contributed to two-way price action.
- Economic data reflected a resilient labor market but flagged moderating US growth, with investors closely watching forthcoming GDP figures and the Fed's policy stance.
- The US dollar index may remain range-bound as markets await catalysts, including the Fed meeting, the 2Q GDP release, and key labor market data.
Technical approach:
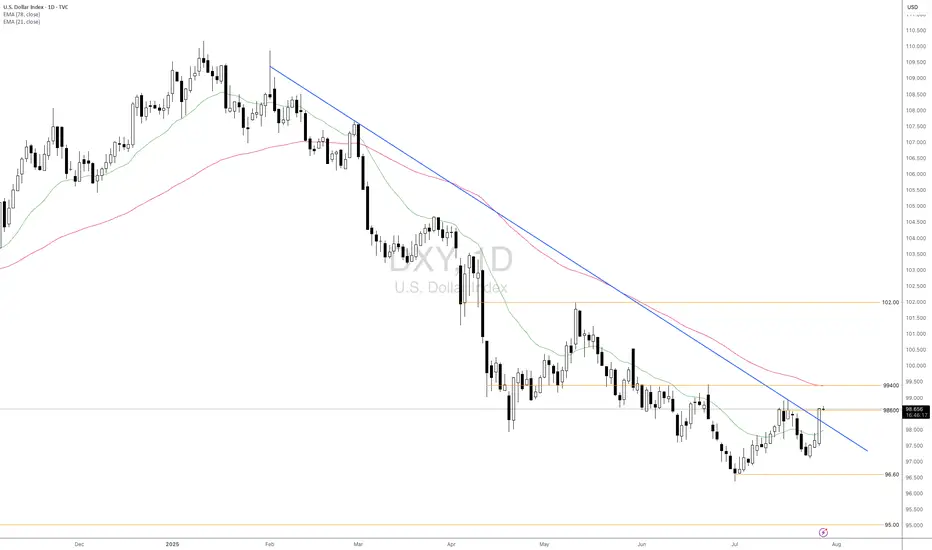
- DXY surged and closed above the descending trendline and the resistance at around 98600, indicating an early signal of a shift in the market trend.
- If DXY maintains above 98600, it may retest the following resistance at 99400, confluence with EMA78.
- On the contrary, closing below the descending trendline and EMA21 may prompt a retest of the swing low at 96.60.
Analysis by: Dat Tong, Senior Financial Markets Strategist at Exness
Will USTEC Continue Its Rallies Amid Better Market Sentiment?Macro approach:
- USTEC advanced modestly this week, supported by upbeat corporate earnings and resilience in economic data amid ongoing policy uncertainty.
- The index benefited from strong expected results in major tech firms such as Microsoft (MSFT) and Nvidia (NVDA), as top giant AI leadership, helping to bolster sentiment despite lingering concerns about tariffs and Fed policy direction.
- US macro data showed sticky inflation in key categories, robust retail sales, and falling jobless claims. This prompted the Fed to retain its cautious stance on rate cuts while markets reassessed policy expectations. Policy-related headlines and manufacturing sector developments also partly drove market volatility.
- USTEC could remain sensitive to incoming tech earnings, the 29-30 Jul Fed meeting, and potential US tariff announcements in early Aug. Persistent inflation and any surprises in central bank communication may drive volatility in the sessions ahead.
Technical approach:
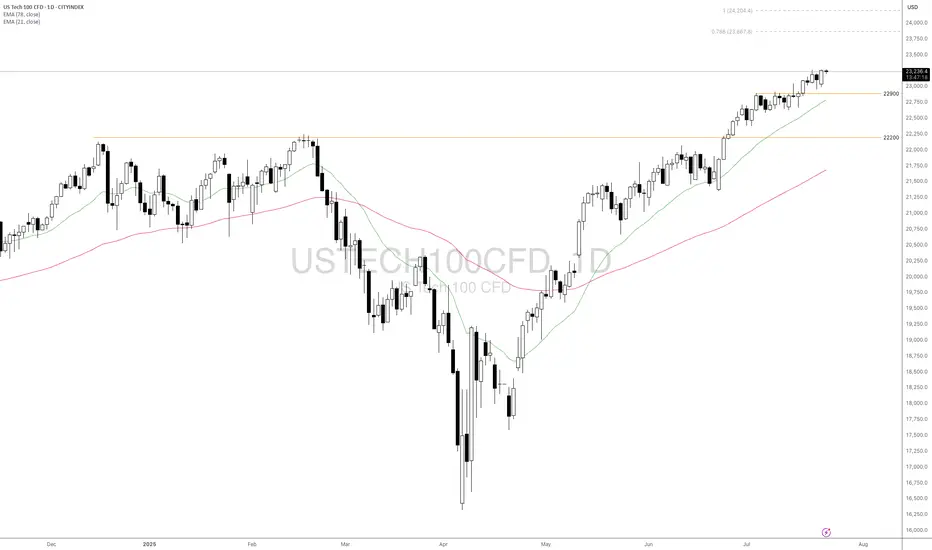
- USTEC trended higher and created a new record high. The price is above both EMAs, indicating a strong bullish momentum.
- If USTEC stays above the support at 22900, the price may continue toward the 78.6% Fibonacci Extension at around 23867.
- On the contrary, breaking below the support at 22900 and EMA21 may prompt a deeper correction to retest the following support at 22000.
Analysis by: Dat Tong, Senior Financial Markets Strategist at Exness
Will The Emerging Uncertainties Support Gold Ahead?Macro approach:
- XAUUSD advanced this week, supported by broad-based US dollar weakness and reviving safe-haven demand amid rising global trade tensions. The yellow metal briefly reached a five-week high as investors sought safety following headlines of escalating US tariffs and uncertainty over the Fed’s policy direction.
- Gold may remain well-supported if risk aversion persists, with upcoming global PMIs and further US trade developments set to guide market direction. Additional Fed commentary and central bank actions could trigger new volatility for XAUUSD throughout the week.
Technical approach:
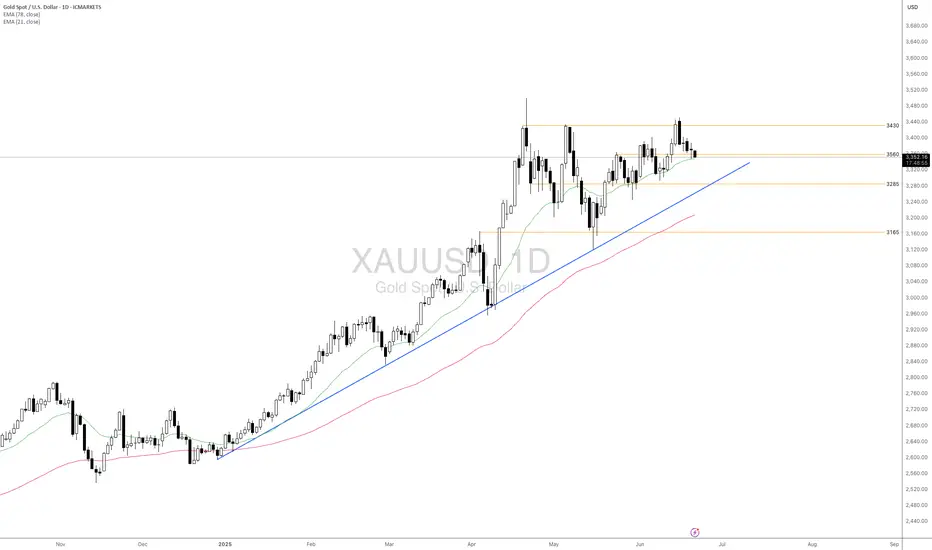
- XAUUSD remains above both the EMA21 and EMA78, reflecting ongoing bullish momentum. The recent price action shows consolidation below the resistance at 3430 after rejecting the swing high. In contrast, higher lows have formed above the ascending trendline and the support at 3285.
- If XAUUSD stays above the support at 3560, it may extend towards the previous swing high at around 3430 and open for another record high.
- On the contrary, if the price drops below the support at 3560 and the ascending trendline, it may retreat toward the following support at 3165.
Analysis by: Dat Tong, Senior Financial Markets Strategist at Exness
Will USTEC Continue to Climb Amid Key Catalysts Ahead?Fundamental approach:
- USTEC climbed to fresh record highs this week, supported by positive investor sentiment amid consolidation ahead of key catalysts.
- Sentiment was buoyed by expectations of continued AI and semiconductor strength, with Nvidia (NVDA) and Amazon (AMZN) registering gains, while Tesla (TSLA) rebounded on optimism despite recent volatility. However, persistent tariff threats and uncertainty around US trade policy generated caution, with markets jittery as investors eyed incoming earnings reports and inflation data releases for further direction. The term structure in tech remains constructive, with buyers stepping in on minor pullbacks, showing little sign of trend exhaustion.
- USTEC may face heightened volatility as the next round of corporate results and updates on US tariffs could shift sentiment. Upcoming earnings from major tech firms and macroeconomic releases, including key inflation and consumer confidence data, could set the tone for the index's next move.
Technical approach:
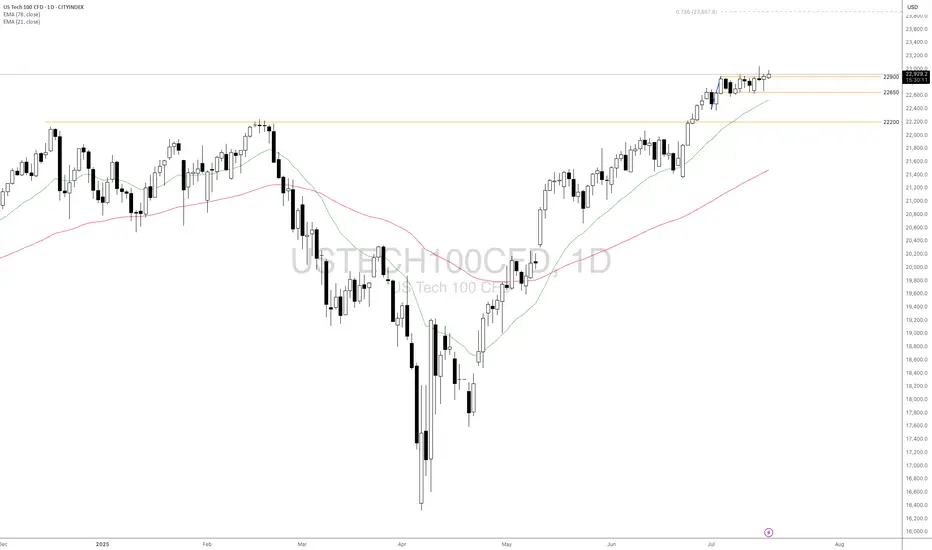
- USTEC closed above the range of 22650-22900, and also above both EMAs, indicating a strong upward momentum.
- If USTEC maintains above 22900, it may continue to rise to 78.6% Fibonacci Extension at around 23870.
- On the contrary, closing below 22900 may push the price to retest the previous support at 22650.
Analysis by: Dat Tong, Senior Financial Markets Strategist at Exness
Will The Prospect of a BoE Rate Cut Continue to Dampen GBPUSD?Macro approach:
- GBPUSD has weakened since last week, pressured by disappointing UK economic data and rising expectations of a BoE rate cut. Meanwhile, the US dollar found support amid cautious risk sentiment and anticipation of key US inflation data.
- UK GDP contracted for a second consecutive month in May, and recent labor market surveys signaled further cooling, reinforcing the case for the BoE's monetary easing. Governor Bailey reiterated that the path for rates is "downward," with markets now pricing in a high probability of a cut at the Aug meeting.
- Meanwhile, the US dollar was buoyed by safe-haven flows and firm inflation expectations ahead of the US CPI release, highlighting policy divergence between the Fed and BoE.
- GBPUSD may remain under pressure as traders await UK inflation and employment data, which could influence the BoE's next move. The pair could see further volatility with US CPI and Fed commentary also on the radar as potential catalysts.
Technical approach:
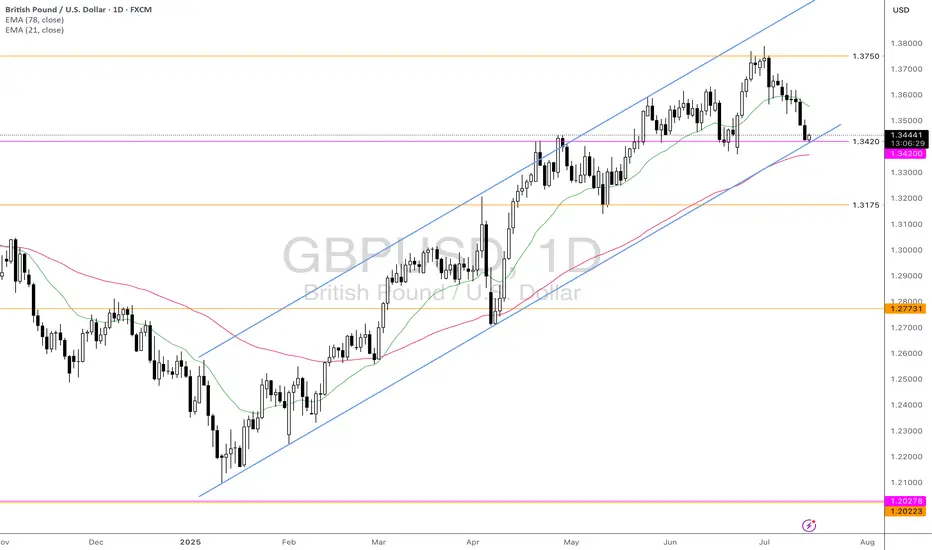
- GBPUSD is retesting the ascending channel's lower bound, confluence with the key support at 1.3420. The price is between both EMAs, indicating a sideways movement. GBPUSD awaits an apparent breakout to determine the short-term trend.
- If GBPUSD breaches below the support at 1.3420, the price may plunge toward the following support at 1.3175.
- On the contrary, holding above 1.3420 may prompt a short correction to retest EMA21.
Analysis by: Dat Tong, Senior Financial Markets Strategist at Exness
Gold Holds Above $3,300 Amid Trade Policy UncertaintyMacro approach:
- Gold traded defensively this week, consolidating above the $3,300 level amid shifting risk sentiment and anticipation of significant trade policy developments. The yellow metal's performance was pressured by a firmer US dollar and easing geopolitical tensions, as optimism around potential trade deals and tariff suspensions reduced safe-haven demand.
- Market drivers included resilient US economic data, the Fed's cautious stance on rate cuts, and ongoing trade negotiations. The 9 Jul deadline for suspended US tariffs and President Trump's threats of new levies on BRICS countries kept investors on edge, while the release of FOMC minutes and strong NFP further dampened expectations for imminent Fed easing. Despite these headwinds, underlying concerns over US fiscal deficits and global policy uncertainty supported Gold's longer-term appeal.
- Gold may remain volatile as markets await clarity on US trade policy and the 15 July US CPI release. Both could influence Fed rate expectations and risk appetite. Any escalation in trade tensions or disappointing economic data could revive safe-haven flows into Gold.
Technical approach:
- XAUUSD consolidated within a tight range of 3285-3560, just lightly above the ascending channel's lower bound. The price is at EMA21, indicating that a bullish momentum is still intact. The market is waiting for an apparent breakout to determine the trend.
- If XAUUSD breaks above 3560, the price may retest the following resistance at 3430.
- On the contrary, closing below support at 3285 may allow Gold to retest the following support at 3165.
Analysis by: Dat Tong, Senior Financial Markets Strategist at Exness

Gold Prices Pull Back Amid Profit-Taking and Unchanged Fed ratesMacro approach:
- Gold prices have recently pulled back as investors took profits at elevated levels to offset losses elsewhere amid rising geopolitical tensions in the Middle East and steady Fed holding rates.
- Speculation is mounting that the US may involve into the Middle East conflicts, raising fears of a broader regional tensions.
- Meanwhile, a dovish Fed outlook signaling two potential rate cuts this year and concerns over growing US debt continues to provide underlying support for gold prices.
Technical approach:
- XAUUSD is retesting EMA21, and the support level is around 3560. The price is above both EMAs, indicating that the upward momentum is intact.
- If XAUUSD closes below EMA21, it may continue to plunge and retest the following support at 3285, which is the confluence with the ascending trendline.
- On the contrary, remaining above 3560 may prompt a potential retest of the key resistance at around 3430.
Analysis by: Dat Tong, Senior Financial Markets Strategist at Exness
Will Oil Prices Face Downward Pressure After EIA's Forecast?Macro approach:
- The EIA’s latest short-term outlook projects weaker oil prices as rising global inventories weigh on the market. Sluggish demand growth and increased production are expected to push output above consumption, building stockpiles and adding pressure on prices.
- Traders are also monitoring the ongoing US-China trade talks in London. Sentiment remains cautiously optimistic after US Commerce Secretary Lutnick described the negotiations as progressing well.
- On the supply side, Saudi Aramco has reduced its Jul oil shipments to China by 1 million barrels compared to Jun, suggesting that the recent OPEC+ production hike may not translate into substantial new supply.
Technical approach:
- USOIL retested both the descending trendline and resistance near 64.50 before pulling back. The price remains above both EMAs, signaling that bullish momentum is still intact.
- A breakout above 64.50 and the descending trendline could open the door to 68.00–70.00.
- However, failure to clear this resistance may lead to a retreat toward the 60.00 support level.
Analysis by: Dat Tong, Senior Financial Markets Strategist at Exness

Can Tech Strength Still Drive Markets Amid Trade Tensions?Macro approach:
The Nasdaq 100 (USTEC) began Jun with strong momentum after its best monthly performance since 2023, fueled by robust tech earnings and a brief lull in tariff concerns.
- However, renewed US-China trade tensions resurfaced early in the week, briefly weighing on sentiment before a market rebound restored cautious optimism.
- Nvidia (NVDA) surged due to the continued demand for AI chips. At the same time, Tesla (TSLA) drew investor focus ahead of its 12 Jun robotaxi launch, helping maintain positive momentum in the face of geopolitical uncertainty.
Technical approach:
- USTEC is now testing the previous swing high near 218000, staying above both EMAs, a sign of ongoing bullish strength.
- A clear break above 21800 would likely open the path toward the record-high zone near 22200.
- Failure to do so may trigger a pullback toward the nearest support of around 20700.
Analysis by: Dat Tong, Senior Financial Markets Strategist at Exness

Is Gold’s Recovery Pausing or Gaining Momentum?Macro approach:
- Gold rebounded sharply from mid-May lows, fueled by renewed safe-haven demand following Moody’s downgrade of the US credit rating.
- However, the rally lost momentum near a two-week high as profit-taking and easing US-EU trade tensions cooled demand.
- Longer-term fundamentals remain supportive, with persistent central bank buying, particularly from China, underpinning bullish sentiment.
Technical approach:
- Technically, XAUUSD broke above its descending channel and retested the breakout. The price remains range-bound between 3285 and 3560, and we await a clear breakout.
- Closing above 3560 could open to 3430.
- On the contrary, a break below 3285 risks a decline toward 3135.
Analysis by: Dat Tong, Senior Financial Markets Strategist at Exness

Senate Advances Stablecoin Bill, JPMorgan Backs Bitcoin AccessFundamental approach
- The US Senate has cleared the GENIUS Act, its long-awaited stablecoin framework, after marathon talks. A final vote is expected after the Memorial Day break (26 May).
- JPMorgan Chase CEO Dimon says the bank will soon allow clients to trade bitcoin through third-party custody, adding fresh tailwinds to institutional demand.
- Spot-bitcoin ETFs are on track for a sixth straight week of net inflows, reinforcing the bid beneath prices.
Technical approach:
- Price is probing resistance at 106200 within a well-defined rising channel. The widening spread between both EMAs underscores building bullish momentum.
- A decisive close above 107000 opens the door to 113000.
- On the contrary, a drop through the support at 101400 would lead to a deeper correction to around the following support at 93000.
Analysis by: Dat Tong, Senior Financial Markets Strategist at Exness

Gold Eases as Risk Sentiment Improves, but Long-Term Demand IntaMacro theme:
- Gold prices retreated from recent highs as improved risk sentiment following the US-China trade deal and a stronger US dollar weighed on safe-haven demand.
- Gold ETFs recorded modest outflows in Apr, but the withdrawal slowdown suggests easing profit-taking pressure.
- In the near term, trade optimism may keep gold under pressure, though central bank demand and portfolio diversification continue to support the long-term outlook.
Technical theme:
- XAUUSD pulled back from the swing high near 3430, forming a lower high and moving into a sideways structure between EMAs.
- A close below 3230 could trigger further downside toward 3135,
- On the contrary, holding above 3230 may prompt a retest of the 3430 level.
Analysis by: Dat Tong, Senior Financial Markets Strategist at Exness

DXY Rebounds on Fed Pause and Trade Deal Hopes.Macro approach:
- DXY edged higher, recovering earlier losses as the Fed held rates and Powell was cautious.
- Jun cut hopes faded, though markets expect three cuts this year, potentially lifting DXY short-term.
- A potential US-UK trade deal also helps ease bearish sentiment on the dollar.
Technical approach:
- DXY is hovering around the key resistance at around 100.200, confluence with EMA21, indicating a potential short-term correction.
- If DXY closes above the resistance at 100.200, the price may continue to claim to retest the following resistance at 101.800.
- Conversely, closing below the current trendline may lead DXY to retest the swing low at around 98.000.
Analysis by: Dat Tong, Senior Financial Markets Strategist at Exness

Microsoft in Focus Ahead of Key Earnings, AI Outlook Under WatchMacro:
- Microsoft (MSFT) climbed on cautious optimism ahead of major earnings and economic data.
- Four of the “Magnificent Seven,” AMZN, AAPL, META, and MSFT, are set to report, with investors focusing on Microsoft (MSFT) today.
- Wall Street expects EPS of 3.22 USD and revenue of 68.44 B USD, both up YoY. Microsoft’s strength in AI, cloud, and enterprise software, along with its continued investment in AI talent and solid dividend history, makes this a closely watched report.
- Key drivers will be its results, AI/cloud growth outlook, and forward guidance, while any surprises could shift the stock sharply.
Technical:
- MSFT recovered and tested the resistance at around 396, confluence with EMA78. The price is sideways, and we await a clearer breakout to determine the following direction.
- If MSFT breaks above 396, the price may approach the following resistance at 405, confluence with the 100% Fibonancci Extension.
- On the contrary, remaining below 396 may prompt a retest to the support at around 378, confluence with the broken descending channel.
Analysis by: Dat Tong, Senior Financial Markets Strategist at Exness

Bitcoin Rallies on Stablecoin Optimism and Liquidity BoostMacro:
- The crypto market rebounded as sentiment improved following the US Treasury Secretary's proposal to ease stablecoin regulations, boosting trading volumes and risk appetite.
- On-chain data reflects growing activity. The average bitcoin trade size rose 15% MoM, overall volume jumped, and 78% of supply is now in profit.
- Liquidity support from the increasing M2 money supply in China and the US has further enhanced bitcoin's appeal.
Technical:
- BTCUSD surged to resistance near 94300, aligning with the 100% Fibo Extension, before forming a Doji candle that signals possible correction. The price remains above both EMAs, indicating a bullish shift.
- If the price breaks below 92000, it may leads to a pullback toward the 87000–90000 support zone, near the 23.6%-38.2% Fibo Retracement levels.
- A breakout above 94300 may open the door for a move toward the next resistance around 101400.
Analysis by: Dat Tong, Senior Financial Markets Strategist at Exness

Oil slumps as demand outlook dims and supply risesMacro:
- Oil prices stay weak as trade war fears weigh on global growth and energy demand.
- The IEA cut its 2025 oil demand growth forecast to just 730k bpd, the slowest pace in five years, down from 1.03 mln.
- Meanwhile, OPEC+ output is rising, with Saudi Arabia set to boost exports to China in May and Russia maintaining steady production, fueling oversupply concerns.
Technical:
- USOIL is in a clear downtrend fueled by lower highs and lows. The price is below both EMAs, indicating persistent downward momentum.
- If USOIL closes above the resistance at 63.30, the price may retest the following resistance at 65.80.
- On the contrary, remaining below 68.30 may pave the way to retest the support at 57.25 and 53.85, respectively.
Analysis by: Dat Tong, Senior Financial Markets Strategist at Exness

Will Gold Shine Again Once The Tariff Storm Is Settled?Macro:
- Gold prices have fallen since Trump's 'Liberation Day' tariff announcement, as global stock market pressure and hedge fund margin calls forced asset liquidations, including gold.
- Despite the short-term drop, gold remains a key medium-term hedge against recession risks and ongoing uncertainty once markets stabilize.
- High volatility may persist until tariff disputes are resolved and central banks clarify potential support measures.
Technical:
- XAUUSD fluctuates within the range of 2957-3055. The price is between both EMAs, indicating an intact sideways structure.
- If XAUUSD breaks below the support at 2957, the price may retest the following support at 2880.
- On the contrary, breaking above 3055 may lead to a record-high retest at around 3135.
Analysis by: Dat Tong, Senior Financial Markets Strategist at Exness

Will Bitcoin Continue Its Dip After Trump's Tariff Announcement?Macro:
- President Trump's recent tariff announcement has triggered sharp volatility in the crypto market, with Bitcoin falling below $84,000 amid fears of a global trade war and economic slowdown.
- The Crypto Fear and Greed Index remains in "Extreme Fear," signalling cautious investor sentiment.
- Despite the turbulence, institutional interest in Bitcoin remains strong, with firms like Strategy continuing to increase their holdings, showing long-term confidence in the asset.
Technical:
- BTCUSD is captured within a descending channel. The price rejected EMA21 after retesting it, indicating bearish momentum.
- If BTCUSD closes below the support at around 82000-82300, the price may retest the following support at 73000.
- On the contrary, closing above the resistance at 88500 may lead the price to approach the next resistance at 92000.
Analysis by: Dat Tong, Senior Financial Markets Strategist at Exness

Will Mixed Geopolitical News Limit the Downside of Oil Prices?Macro:
- Oil prices continued their decline following an agreement between the US and Russia to halt attacks on energy infrastructure, though without implementing a complete ceasefire.
- The market turned bearish amid expectations that Russian sanctions may be eased, potentially increasing the oil supply surplus.
- Uncertainty lingered as geopolitical tensions in the Middle East sent mixed signals. While the possibility of increased supply pushed prices down, fears of conflict disrupting oil production kept some upward pressure.
Technical:
- USOIL retested its descending channel's upper bound before rejecting the boundary and forming a bearish Engulfing Candlestick, which may provide a hint that bears are in control. The price is below both EMAs, indicating persistent bearish momentum.
- Breaking below the support at 65.80 may prompt another plunge to the 100% Fibonacci Extension at 64.00.
- Closing above 68.40 and breaking the descending channel's upper bound may shift the current structure sideways before retesting the following resistance at 70.20.
Analysis by: Dat Tong, Senior Financial Markets Strategist at Exness

USD Weakens as Fed Cuts Loom, Safe-Haven CHF GainsMacro:
- Economic concerns in the US, including slowdown risks and trade policy uncertainties, have weakened the US dollar against the swiss franc, benefiting from its safe-haven status.
- Traders expect 0.75% in Fed rate cuts this year, with a Jun cut fully priced. Investors now await Wed's US inflation report for further cues.
- Meanwhile, net long dollar positions in currency futures markets have significantly dropped from Jan's nine-year high, which may reduce the further extreme reallocation away from USD.
Technical:
- USDCHF bounced after reaching the support cluster of 0.8770-0.8800, which coincides with the 100% Fibonacci Extension. The price is below both EMAs, indicating persistent bearish momentum.
- If USDCHF remains above the support area of 0.8770-0.8800, the price may retest the resistance area of 0.8900-0.8915.
- On the contrary, a closing below 0.8770 may prompt a continuous decline to retest the following support area of 0.8617-0.8650, confluence with the 161.8% Fibonacci Extension.
Analysis by: Dat Tong, Senior Financial Markets Strategist at Exness

Oil Under Pressure Amid Tariff Tensions and OPEC+ UncertaintyMacro:
- Oil prices stabilised after hitting multi-month lows as the market weighed potential output increases in Apr and escalating tariff tensions among Canada, Mexico, China, and the EU.
- Meanwhile, the halted US military aid to the Eastern Europe conflict, and OPEC+ production decisions continue to pressure oil.
Technical:
- USOIL remains in a downtrend, consistently making lower lows while trading below both EMAs, signalling persistent bearish momentum. However, the price is nearing the oversold zone, supported by multiple key levels.
- If USOIL continues declining, it may retest 66.90 and 65.80, aligning with the 78.6% Fibonacci Extension.
- Conversely, holding above 66.90 could lead to a short-term sideways movement, with a potential retest at 70.20, confluence with EMA21, and the descending channel’s upper bound.
Analysis by: Dat Tong, Senior Financial Markets Strategist at Exness
