DAX H4 | Bullish uptrend to extend further?The DAX (GER30) could fall towards a pullback support and potentially bounce off this level to climb higher.
Buy entry is at 24,077.90 which is a pullback support.
Stop loss is at 23,850.00 which is a level that lies underneath a pullback support and a Fibonacci confluence zone identified by the 23.6% and 38.2% retracements.
Take profit is at 24,369.51 which is a multi-swing-high resistance.
High Risk Investment Warning
Trading Forex/CFDs on margin carries a high level of risk and may not be suitable for all investors. Leverage can work against you.
Stratos Markets Limited (tradu.com ):
CFDs are complex instruments and come with a high risk of losing money rapidly due to leverage. 63% of retail investor accounts lose money when trading CFDs with this provider. You should consider whether you understand how CFDs work and whether you can afford to take the high risk of losing your money.
Stratos Europe Ltd (tradu.com ):
CFDs are complex instruments and come with a high risk of losing money rapidly due to leverage. 63% of retail investor accounts lose money when trading CFDs with this provider. You should consider whether you understand how CFDs work and whether you can afford to take the high risk of losing your money.
Stratos Global LLC (tradu.com ):
Losses can exceed deposits.
Please be advised that the information presented on TradingView is provided to Tradu (‘Company’, ‘we’) by a third-party provider (‘TFA Global Pte Ltd’). Please be reminded that you are solely responsible for the trading decisions on your account. There is a very high degree of risk involved in trading. Any information and/or content is intended entirely for research, educational and informational purposes only and does not constitute investment or consultation advice or investment strategy. The information is not tailored to the investment needs of any specific person and therefore does not involve a consideration of any of the investment objectives, financial situation or needs of any viewer that may receive it. Kindly also note that past performance is not a reliable indicator of future results. Actual results may differ materially from those anticipated in forward-looking or past performance statements. We assume no liability as to the accuracy or completeness of any of the information and/or content provided herein and the Company cannot be held responsible for any omission, mistake nor for any loss or damage including without limitation to any loss of profit which may arise from reliance on any information supplied by TFA Global Pte Ltd.
The speaker(s) is neither an employee, agent nor representative of Tradu and is therefore acting independently. The opinions given are their own, constitute general market commentary, and do not constitute the opinion or advice of Tradu or any form of personal or investment advice. Tradu neither endorses nor guarantees offerings of third-party speakers, nor is Tradu responsible for the content, veracity or opinions of third-party speakers, presenters or participants.
DAX Index

#202526 - priceactiontds - weekly update - daxGood Evening and I hope you are well.
comment: Monday was neutral and the warning to bears that the markets do not care about the risk at hand. Tuesday’s gap up then was the sign of bull strength and defending the Globex gap was the sure sign we are going higher. Thursday was the bears giving up and since we have a measured move target up to 24700. I have drawn my 5-wave thesis on the chart, which I think is currently the most likely outcome. All depends if the US markets continue the squeeze as well. There is always the possibility that Friday marked the highs but that is very low and in the absence of bear bars, we can only assume higher prices.
current market cycle: trading range
key levels for next week: 23500 - 25000
bull case: Bulls made the bears give up on Thursday and since we have been going only up. The obvious next targets are 24500 and then 25000. As of now, there is absolutely no reason to assume we reverse from here and print lower lows again. Bulls took over control of the market again and we have two clear legs up, with a third one we may do a new ath but as always, every pattern can fail.
Invalidation is below 23500
bear case: Not much. A pullback is expected but so is the third leg up for W5 and everything below 23500 would be a huge bear surprise and cut this short. As of now I don’t think this chart can lead you to looking for shorts. We would need a break of two bull trend lines and prices below 23500 before you should think bearish again.
Invalidation is above 24400
short term: Bearish was the obvious read last weekend and when bears failed on Monday, it set the stage for an explosive move to the upside. That can always happen since we are in a profession where you play odds.
medium-long term from 2025-06-29: Bull surprise last week but my targets for the second half of 2025 remain the same. I still expect at least 21000 to get hit again this year. As of now, bulls are favored until we drop below 23000

2025-06-26 - priceactiontds - daily update - daxGood Evening and I hope you are well.
comment: Is this a bigger two-legged pullback to the 4h ema and now we strongly break above 23900 to go for 24200+ again? It’s my most likely case. It’s still not a good trade to buy above 23800 since that trapped you two times this week for 230 and 300 point pullbacks.
current market cycle: broad bull channel on the weekly chart. Daily chart is in a trading range 23000 - 24500
key levels: 23500 - 24500
bull case: Everything aligns for the bulls. They need the breakout above Tuesday’s high and then we go for the obvious big round number 24000 but I doubt we will stop here. Once the bears who sold above 23800 this week give up, I doubt there will be much resistance until maybe 24300 or higher. Anything below 23600 would be a huge bear surprise tomorrow and my bullish bias is likely wrong.
Invalidation is below 23000.
bear case: Bears don’t have much until they print below 23600 again. Can they hold the market below 24000 and keep this trading range alive? I doubt it. Bears tried 3 times this week and the bull gap to 23550 stayed open.
Invalidation is above 24100.
short term: Bullish. Still expecting 24000 and no print below 23600 tomorrow. Everything else would be a big bear surprise and we could go much lower than 23500 but this is the most unlikely scenario.
medium-long term from 2025-06-22: New bear trend has likely started on 2025-06-05 and we saw W2 conclude on Friday. Daily close below 23000 will be the confirmation for the bears and I have drawn 2 potential final W5 targets. I have written that we will see 20000/21000 again over the summer for many weeks/months now, this even is just another excuse for “analysts” to justify the move down.
trade of the day: Longs close to 23600 were the obvious trade today. The selling for 198 was at least 100 points stronger than I expected and stopped me out but I immediately went long again on the very strong buying below 23650 and closed the day with profits.

DAX Inverse Head and Shoulders target 24600!DAX (DE40) is about to complete an Inverse Head and Shoulders (IH&S) pattern, with the price currently stuck in range within the 4H MA50 (blue trend-line) and the 4H MA200 (orange trend-line).
A 4H candle closing above the 4H MA200, confirms the IH&S pattern and the bullish break-out technically targets the 2.0 Fibonacci extension, currently a little above 24600. On top of that, the break-out may be accompanied by a 1D MAD Bullish Cross, further confirmation of the bullish sentiment.
-------------------------------------------------------------------------------
** Please LIKE 👍, FOLLOW ✅, SHARE 🙌 and COMMENT ✍ if you enjoy this idea! Also share your ideas and charts in the comments section below! This is best way to keep it relevant, support us, keep the content here free and allow the idea to reach as many people as possible. **
-------------------------------------------------------------------------------
Disclosure: I am part of Trade Nation's Influencer program and receive a monthly fee for using their TradingView charts in my analysis.
💸💸💸💸💸💸
👇 👇 👇 👇 👇 👇

DAX H4 | Potential bearish reversalThe DAX (GER30) is rising towards a swing-high resistance and could potentially reverse off this level to drop lower.
Sell entry is at 23,740.18 which is a swing-high resistance.
Stop loss is at 23,960.00 which is a level that sits above the 61.8% Fibonacci retracement and an overlap resistance.
Take profit is at 23,341.19 which is a pullback support that aligns with the 61.8% Fibonacci retracement.
High Risk Investment Warning
Trading Forex/CFDs on margin carries a high level of risk and may not be suitable for all investors. Leverage can work against you.
Stratos Markets Limited (tradu.com ):
CFDs are complex instruments and come with a high risk of losing money rapidly due to leverage. 63% of retail investor accounts lose money when trading CFDs with this provider. You should consider whether you understand how CFDs work and whether you can afford to take the high risk of losing your money.
Stratos Europe Ltd (tradu.com ):
CFDs are complex instruments and come with a high risk of losing money rapidly due to leverage. 63% of retail investor accounts lose money when trading CFDs with this provider. You should consider whether you understand how CFDs work and whether you can afford to take the high risk of losing your money.
Stratos Global LLC (tradu.com ):
Losses can exceed deposits.
Please be advised that the information presented on TradingView is provided to Tradu (‘Company’, ‘we’) by a third-party provider (‘TFA Global Pte Ltd’). Please be reminded that you are solely responsible for the trading decisions on your account. There is a very high degree of risk involved in trading. Any information and/or content is intended entirely for research, educational and informational purposes only and does not constitute investment or consultation advice or investment strategy. The information is not tailored to the investment needs of any specific person and therefore does not involve a consideration of any of the investment objectives, financial situation or needs of any viewer that may receive it. Kindly also note that past performance is not a reliable indicator of future results. Actual results may differ materially from those anticipated in forward-looking or past performance statements. We assume no liability as to the accuracy or completeness of any of the information and/or content provided herein and the Company cannot be held responsible for any omission, mistake nor for any loss or damage including without limitation to any loss of profit which may arise from reliance on any information supplied by TFA Global Pte Ltd.
The speaker(s) is neither an employee, agent nor representative of Tradu and is therefore acting independently. The opinions given are their own, constitute general market commentary, and do not constitute the opinion or advice of Tradu or any form of personal or investment advice. Tradu neither endorses nor guarantees offerings of third-party speakers, nor is Tradu responsible for the content, veracity or opinions of third-party speakers, presenters or participants.

DAX: Move Down Expected! Short!
My dear friends,
Today we will analyse DAX together☺️
The price is near a wide key level
and the pair is approaching a significant decision level of 23,509.95 Therefore, a strong bearish reaction here could determine the next move down.We will watch for a confirmation candle, and then target the next key level of 23,438.51..Recommend Stop-loss is beyond the current level.
❤️Sending you lots of Love and Hugs❤️

2025-06-24 - priceactiontds - daily update - daxGood Evening and I hope you are well.
comment: Market stalled exactly at the 50% retracement from the bear leg 24627 down to 23061. I highly doubt we top out here but 24000 is a possible target for the high. Issue for the bears is that this is as bullish as it get’s right now. All markets printing big green candles and bears gave up. US markets are heading for new ath and they will likely print new ones this week. So thinking about topping out is dumb as of now. Will only look for longs closer to the 1h ema until we see much much bigger selling pressure and prices below 23500.
current market cycle: broad bull channel on the weekly chart. Daily chart is in a trading range 23000 - 24500
key levels: 23500 - 24000
bull case: Big Globex gap up, retest and go. Market is leaving gaps below and until they close, we are in a max bullish market. 24000 is the obvious target but we can do more. Any pullback now has to stay above 23700 or bears might come around again.
Invalidation is below 23000.
bear case: There is a tiny chance for the bears that this is just a retest of 24000 and the breakout price area and also the daily 20ema. Tiny. Don’t bet on it. You can not look for shorts until we close the next gap down to 23550ish.
Invalidation is above 24100.
short term: Bullish af. 24000 I see as given unless a newsbomb hits. Market should not drop below 23690 if bulls want to continue higher.
medium-long term from 2025-06-22: New bear trend has likely started on 2025-06-05 and we saw W2 conclude on Friday. Daily close below 23000 will be the confirmation for the bears and I have drawn 2 potential final W5 targets. I have written that we will see 20000/21000 again over the summer for many weeks/months now, this even is just another excuse for “analysts” to justify the move down.
trade of the day: Long on Globex or buying pullbacks near the 15m or 60m ema. All were profitable at least for scalps. When you see this much buying during Globex session and a perfect double bottom above a big bull gap, chances that this day is bearish are abysmally low so don’t look for shorts.

DAX H1 | Rising into an overlap resistanceThe DAX (GER30) is rising towards an overlap resistance and could potentially reverse off this level to drop lower.
Sell entry is at 23,858.94 which is an overlap resistance that aligns closely with the 61.8% Fibonacci retracement.
Stop loss is at 24,200.00 which is a level that sits above the 78.6% Fibonacci retracement and an overlap resistance.
Take profit is at 23,531.83 which is a pullback support that aligns the 38.2% Fibonacci retracement.
High Risk Investment Warning
Trading Forex/CFDs on margin carries a high level of risk and may not be suitable for all investors. Leverage can work against you.
Stratos Markets Limited (tradu.com ):
CFDs are complex instruments and come with a high risk of losing money rapidly due to leverage. 63% of retail investor accounts lose money when trading CFDs with this provider. You should consider whether you understand how CFDs work and whether you can afford to take the high risk of losing your money.
Stratos Europe Ltd (tradu.com ):
CFDs are complex instruments and come with a high risk of losing money rapidly due to leverage. 63% of retail investor accounts lose money when trading CFDs with this provider. You should consider whether you understand how CFDs work and whether you can afford to take the high risk of losing your money.
Stratos Global LLC (tradu.com ):
Losses can exceed deposits.
Please be advised that the information presented on TradingView is provided to Tradu (‘Company’, ‘we’) by a third-party provider (‘TFA Global Pte Ltd’). Please be reminded that you are solely responsible for the trading decisions on your account. There is a very high degree of risk involved in trading. Any information and/or content is intended entirely for research, educational and informational purposes only and does not constitute investment or consultation advice or investment strategy. The information is not tailored to the investment needs of any specific person and therefore does not involve a consideration of any of the investment objectives, financial situation or needs of any viewer that may receive it. Kindly also note that past performance is not a reliable indicator of future results. Actual results may differ materially from those anticipated in forward-looking or past performance statements. We assume no liability as to the accuracy or completeness of any of the information and/or content provided herein and the Company cannot be held responsible for any omission, mistake nor for any loss or damage including without limitation to any loss of profit which may arise from reliance on any information supplied by TFA Global Pte Ltd.
The speaker(s) is neither an employee, agent nor representative of Tradu and is therefore acting independently. The opinions given are their own, constitute general market commentary, and do not constitute the opinion or advice of Tradu or any form of personal or investment advice. Tradu neither endorses nor guarantees offerings of third-party speakers, nor is Tradu responsible for the content, veracity or opinions of third-party speakers, presenters or participants.

#202525 - priceactiontds - weekly update - dax futuresGood Day and I hope you are well.
comment: Full bear mode. Bulls tried 3 times to get some pullback going but only huge rejections on every try and since we have crossed the daily ema, we have not touched it or came close to it. Maybe we see some sideways movement around 23000 but given my uber bearish expectation due to US bombs on Iran, I can see a giant move down to 22000 and some stalling around it. Any price above 23700 means I am wrong and markets continue to ignore every risk under the sun.
1500 points down by the bears in two weeks is decent enough for a first leg. I market two potential W5 targets for the next weeks.
current market cycle: most likely new bear trend which can bring us to 21k or 20k over the next weeks
key levels for next week: 22000 - 23700
bull case: Can they try another “ignore the risk” move after the weekend news? I doubt it but anything can happen, so my invalidation for the bears is 23700. If they print it, we move sideways but I can not, for the life of me, see this printing new highs. If you are still holding long term longs on anything, I think you are late on running for the exit.
Invalidation is below 22900
bear case: Bears have been given another gift by orange face. The selling started two weeks ago, so it has nothing to do with Iran but it will likely help in confirming the trend and maybe accelerate it. The drawn channel is a rough guess for now. We have seen slow and steady liquidation the past 2 weeks and now we could see a shift to a huge “run for the exits” and type of “liberation-day” markets. 22000 is the big next target for bears since I expect 23000 or lower to get hit immediately on futures open.
Invalidation is above 23700
short term: Full bear mode. 23000 is almost a given and we could move quickly to 22000 over the next days. If we produce an island gap with the previous bull gap 22800-23100 (don’t take those numbers per tick value, this is not an exact science, many algos see the gap differently) it’s a huge confirmation and it could not be closed for months. If we do a big gap down and bulls close it, much less chance for the bears to continue down faster.
medium-long term from 2025-06-22: New bear trend has likely started on 2025-06-05 and we saw W2 conclude on Friday. Daily close below 23000 will be the confirmation for the bears and I have drawn 2 potential final W5 targets. I have written that we will see 20000/21000 again over the summer for many weeks/months now, this even is just another excuse for “analysts” to justify the move down.

DAX: Target Is Up! Long!
My dear friends,
Today we will analyse DAX together☺️
The recent price action suggests a shift in mid-term momentum. A break above the current local range around 23,435.79 will confirm the new direction upwards with the target being the next key level of 23,572.93 and a reconvened placement of a stop-loss beyond the range.
❤️Sending you lots of Love and Hugs❤️

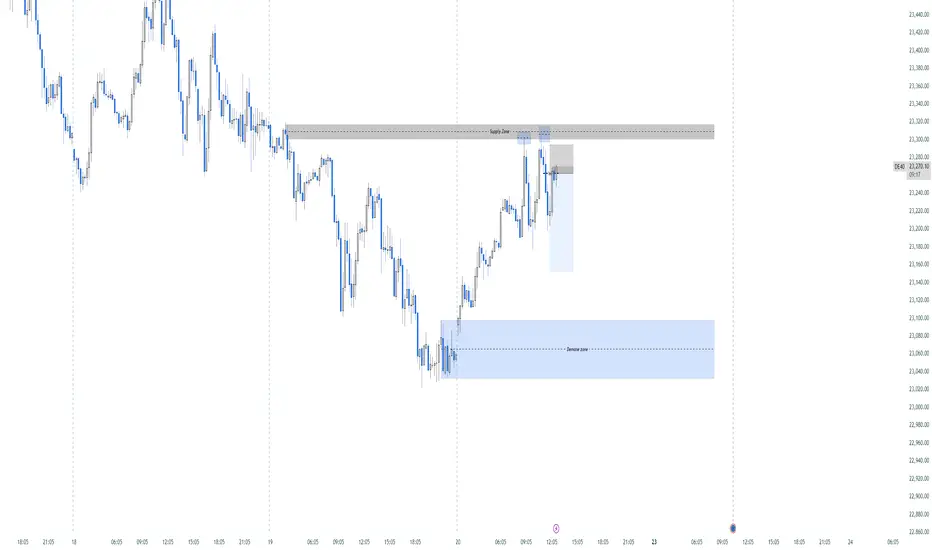
Possible Sell On Dax. Every thing taken into account, dax could shortly see a sell, given that a 1h Supply zone and 5 minute candles were rejected twice.
DAX H1 | Downtrend to extend deeper?The DAX (GER30) is rising towards a swing-high resistance and could potentially reverse off this level to drop lower.
Sell entry is at 22,230.41 which is a swing-high resistance that aligns closely with the 23.6% Fibonacci retracement.
Stop loss is at 23,460.00 which is a level that sits above the 50% Fibonacci retracement and a swing-high resistance.
Take profit is at 22,913.31 which is a swing-low support.
High Risk Investment Warning
Trading Forex/CFDs on margin carries a high level of risk and may not be suitable for all investors. Leverage can work against you.
Stratos Markets Limited (tradu.com ):
CFDs are complex instruments and come with a high risk of losing money rapidly due to leverage. 63% of retail investor accounts lose money when trading CFDs with this provider. You should consider whether you understand how CFDs work and whether you can afford to take the high risk of losing your money.
Stratos Europe Ltd (tradu.com ):
CFDs are complex instruments and come with a high risk of losing money rapidly due to leverage. 63% of retail investor accounts lose money when trading CFDs with this provider. You should consider whether you understand how CFDs work and whether you can afford to take the high risk of losing your money.
Stratos Global LLC (tradu.com ):
Losses can exceed deposits.
Please be advised that the information presented on TradingView is provided to Tradu (‘Company’, ‘we’) by a third-party provider (‘TFA Global Pte Ltd’). Please be reminded that you are solely responsible for the trading decisions on your account. There is a very high degree of risk involved in trading. Any information and/or content is intended entirely for research, educational and informational purposes only and does not constitute investment or consultation advice or investment strategy. The information is not tailored to the investment needs of any specific person and therefore does not involve a consideration of any of the investment objectives, financial situation or needs of any viewer that may receive it. Kindly also note that past performance is not a reliable indicator of future results. Actual results may differ materially from those anticipated in forward-looking or past performance statements. We assume no liability as to the accuracy or completeness of any of the information and/or content provided herein and the Company cannot be held responsible for any omission, mistake nor for any loss or damage including without limitation to any loss of profit which may arise from reliance on any information supplied by TFA Global Pte Ltd.
The speaker(s) is neither an employee, agent nor representative of Tradu and is therefore acting independently. The opinions given are their own, constitute general market commentary, and do not constitute the opinion or advice of Tradu or any form of personal or investment advice. Tradu neither endorses nor guarantees offerings of third-party speakers, nor is Tradu responsible for the content, veracity or opinions of third-party speakers, presenters or participants.

DAX | Bearish Below 23810–23690, Targeting 23395 and 23160DAX | Technical Analysis
The price has stabilized below the pivot zone (23810 – 23690), confirming the continuation of bearish momentum.
📉 As long as the price remains below 23810 and 23690, the downtrend is expected to persist, with a potential move toward 23395. A confirmed break below this level could extend the decline toward 23160.
Pivot Zone: 23810 – 23690
Resistance Levels: 24085, 24300
Support Levels: 23395, 23160
Trend Outlook: Bearish Momentum

DAX Can today's 1D MA50 test start a new rally?Last time we looked at DAX (DE40) more than 2 months ago (April 04, see chart below), we took a long-term buy on the 1D MA200 (orange trend-line) and the bottom of the 2.5-year Channel Up, targeting 25400:
The price reacted favorably, rising almost instantly, almost hitting the top of the Channel Up on June 05. Since then it got rejected and pulled back to hit the 1D MA50 (blue trend-line) today.
Based on the previous Bullish Legs of the Channel Up, this seems to be a technical correction (blue ellipse patterns) that only served as a 1D MA50 test to accumulate more buyers and extend the uptrend.
If the current Bullish Leg rises as high as the previous one (+38%), we should be expecting 25900 by the end of Q3.
-------------------------------------------------------------------------------
** Please LIKE 👍, FOLLOW ✅, SHARE 🙌 and COMMENT ✍ if you enjoy this idea! Also share your ideas and charts in the comments section below! This is best way to keep it relevant, support us, keep the content here free and allow the idea to reach as many people as possible. **
-------------------------------------------------------------------------------
Disclosure: I am part of Trade Nation's Influencer program and receive a monthly fee for using their TradingView charts in my analysis.
💸💸💸💸💸💸
👇 👇 👇 👇 👇 👇

2025-06-18 - priceactiontds - daily update - daxGood Evening and I hope you are well.
comment: Market has not traded above prior day’s high for 9 sessions. Can we do 10 and accelerate down? I would love it but it’s getting a bit unlikely without a better pullback. I can not see bulls coming back from this tbh but I have been wrong about this before. Bears need a big breakout below and accelerate down. Bulls some higher highs to continue sideways between 23000/24000.
current market cycle: broad bull channel on the weekly chart. Daily chart is in a trading range 23000 - 24500
key levels: 23000 - 24000
bull case: Any higher high will do and could lead to couple of legs up for 24000. Whole story because right now they don’t have any arguments besides having support around 23300 and bears unable to make meaningful lower lows. Time-wise we have been going down for 9 sessions and at some point bulls will give up hope and we flush down if they don’t reverse strongly over the next 1-2 sessions.
Invalidation is below 23000.
bear case: Clear target for bears is 23000 and leaving behind a decent gap 23700-24000. They are favored since we are only printing lower highs. Bears have to keep it below 23400 or risk hopeful bulls buying for 23505 which was last week’s close and if we close this week above it, it will be a weekly bull bar and likely a doji. That’s neutral and good for bulls. For this to go down, bears have to print a weekly bar closing on it’s low and below prior support.
Invalidation is above 23500.
short term: Neutral around 23300 but I think we can do 23000 this week. Don’t bet on the breakout before it happens. Shorts closer to 23500 are likely good, unless strong bulls overwhelm the bears tomorrow.
medium-long term from 2025-06-15: Bull trend has most likely concluded. Long term shorts are fine. Stop has to be at least 24508. I see it 70% or more that we will see 22000 before end of August.
trade of the day: Selling anything close to 23400 and buying anything at 23300. The early pump before EU open was a nasty bull trap but shorts with stop above yesterday’s high 23567 were the obvious trade.

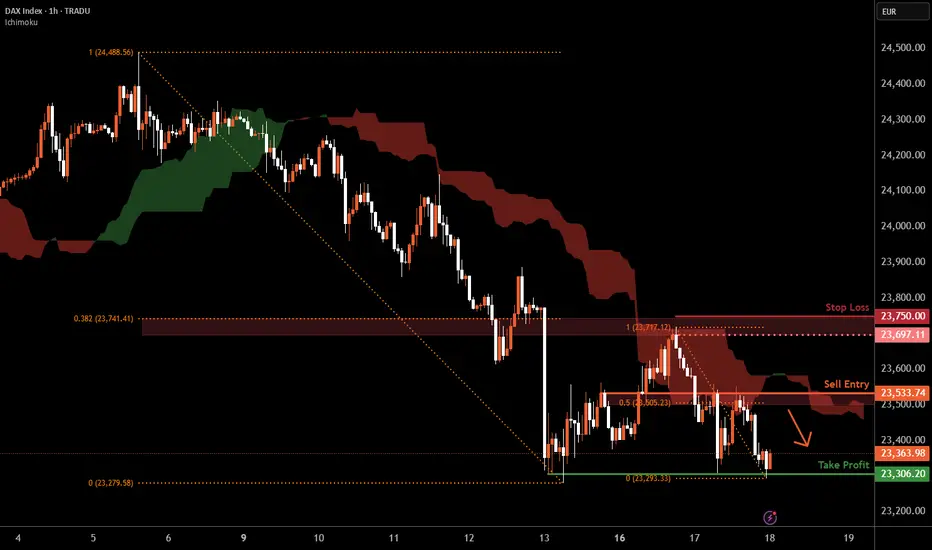
DAX H1 | Rising into a 50% Fibonacci resistanceThe DAX (GER30) is rising towards a pullback resistance and could potentially reverse off this level to drop lower.
Sell entry is at 23,533.74 which is a pullback resistance that aligns with the 50% Fibonacci retracement.
Stop loss is at 23,750.00 which is a level that sits above the 38.2% Fibonacci retracement and a swing-high resistance.
Take profit is at 23,306.20 which is a multi-swing-low support.
High Risk Investment Warning
Trading Forex/CFDs on margin carries a high level of risk and may not be suitable for all investors. Leverage can work against you.
Stratos Markets Limited (tradu.com ):
CFDs are complex instruments and come with a high risk of losing money rapidly due to leverage. 63% of retail investor accounts lose money when trading CFDs with this provider. You should consider whether you understand how CFDs work and whether you can afford to take the high risk of losing your money.
Stratos Europe Ltd (tradu.com ):
CFDs are complex instruments and come with a high risk of losing money rapidly due to leverage. 63% of retail investor accounts lose money when trading CFDs with this provider. You should consider whether you understand how CFDs work and whether you can afford to take the high risk of losing your money.
Stratos Global LLC (tradu.com ):
Losses can exceed deposits.
Please be advised that the information presented on TradingView is provided to Tradu (‘Company’, ‘we’) by a third-party provider (‘TFA Global Pte Ltd’). Please be reminded that you are solely responsible for the trading decisions on your account. There is a very high degree of risk involved in trading. Any information and/or content is intended entirely for research, educational and informational purposes only and does not constitute investment or consultation advice or investment strategy. The information is not tailored to the investment needs of any specific person and therefore does not involve a consideration of any of the investment objectives, financial situation or needs of any viewer that may receive it. Kindly also note that past performance is not a reliable indicator of future results. Actual results may differ materially from those anticipated in forward-looking or past performance statements. We assume no liability as to the accuracy or completeness of any of the information and/or content provided herein and the Company cannot be held responsible for any omission, mistake nor for any loss or damage including without limitation to any loss of profit which may arise from reliance on any information supplied by TFA Global Pte Ltd.
The speaker(s) is neither an employee, agent nor representative of Tradu and is therefore acting independently. The opinions given are their own, constitute general market commentary, and do not constitute the opinion or advice of Tradu or any form of personal or investment advice. Tradu neither endorses nor guarantees offerings of third-party speakers, nor is Tradu responsible for the content, veracity or opinions of third-party speakers, presenters or participants.
"Downside DAX" is what we will call it in July?Looking at the technical picture purely, we can see that weakness is starting to kick in. Will July be a negative month for DAX? Let's have a look.
XETR:DAX
Let us know what you think in the comments below.
Thank you.
77.3% of retail investor accounts lose money when trading CFDs with this provider. You should consider whether you understand how CFDs work and whether you can afford to take the high risk of losing your money. Past performance is not necessarily indicative of future results. The value of investments may fall as well as rise and the investor may not get back the amount initially invested. This content is not intended for nor applicable to residents of the UK. Cryptocurrency CFDs and spread bets are restricted in the UK for all retail clients.

DAX: Local Bearish Bias! Short!
My dear friends,
Today we will analyse DAX together☺️
The recent price action suggests a shift in mid-term momentum. A break below the current local range around 23,509.95 will confirm the new direction downwards with the target being the next key level of 23,389.15.and a reconvened placement of a stop-loss beyond the range.
❤️Sending you lots of Love and Hugs❤️

#004 DAX GERMANY 40: LONG Opportunity
GERMANY 40 – Possible Daily Reversal Starting: LONG on Strategic Support
Hello, I am Trader Andrea Russo, Founder of the SwipeUP Élite FX Method, and today I want to point out this investment on Germany 40 (DAX), in a long configuration from the 23,345 area.
🔍 Technical Context
In recent days, the DAX has undergone a strong correction that has brought the price from 24,800 to test the lows in the 23,200 area. This area corresponds to a long-term daily support level, already used in the past for institutional accumulations.
The price generated a strong bearish spike right at the opening of the cash session, but without closing below the previous lows. This behavior is often indicative of a pre-reversal bearish manipulation.
Confirming this scenario, a double bottom pattern has formed with positive divergence on the 8H and daily cyclical oscillators. In addition, volumes are growing right on the support: a typical signal of an invisible accumulation phase by institutional operators.
✅ Trade Strengths
Daily static support confirmed at 23,200–23,300, already defended several times in the past.
Manipulative spike evident in the first hour of cash opening, followed by rejection of the lows.
Bullish divergence on the cyclical indicators (WT_CROSS) in H8.
Favorable risk/reward ratio (~3.6:1), with well-defined technical stop loss.
Volatility under control: the VIX is stable and the US session opened without a selloff.
Neutral/positive macro environment: weak euro, expectations of monetary easing, low pressure on bonds.
Derivatives sentiment favorable: open interest rising in the 23,300–23,400 area on DAX futures.
🎯 Operating Levels
ENTRY: 23,345
STOP LOSS: 23,170
TAKE PROFIT: 24,007
📌 This positioning allows you to operate with limited risk and a realistic objective, perfectly compatible with standard technical movements on the German index in 2–3 days.
⏱️ Expected Timings
First directional candle expected within 8–16 hours (1–2 H8 candles).
Estimated duration of the trade: between 48 and 72 hours to reach the target.
🧠 Operating Conclusion
The long investment on DAX from 23,345 represents one of the clearest technical configurations seen in the last week on European indices.
The simultaneous presence of cyclical signals, manipulation, structure and static support offers a high probability of success.
The final target at 24,007 is technically and statistically achievable with rigorous management.
💬 Leave a like if you want to receive the 8H analysis update and comment your vision on Germany 40.
🔔 Follow the profile to not miss the next multi-asset updates!

2025-06-16 - priceactiontds - daily update - dax Good Evening and I hope you are well.
comment: Market is much weaker than sp500 and nq, which is always unusual. We are staying below 23724, which is good for the bears but we are in a weak bull channel and making higher highs and higher lows since the Friday sell spike. Both sides make money and market is currently in balance around 23560ish. Clear invalidation prices for both sides and until then it’s buy low, sell high and scalp.
current market cycle: broad bull channel
key levels: 23300 - 24000
bull case: Bulls want to accelerate upwards, close the Globex gap to 23800 and retest 24000. End of story. They are currently a bit favored since we are in a bull channel but only slightly. Market has to stay above 23500 if they want to continue higher. If broader bullishness on markets continues, dax won’t stay below 23800 tomorrow.
Invalidation is below 23500.
bear case: Given that US markets pumped again, dax lags big time. Bears need to keep the gap to 23800 open and print something below 23500 again. If they continue sideways, their chances of another leg down to 23000 become better. My weekly outlook was that we correct sideways for a couple of days before we get another leg down, So far I think this is unfolding.
Invalidation is above 23800.
short term: Neutral around 23650. Bullish really only above 23800 or closer to 23500. If we stay above 23560 tomorrow, I expect another try at 23700 and above 23742 bears will give up for at least 23800.
medium-long term from 2025-06-15: Bull trend has most likely concluded. Long term shorts are fine. Stop has to be at least 24508. I see it 70% or more that we will see 22000 before end of August.
trade of the day: Long around 23500 on EU open since Globex breakout from 23400 was bullish enough to expect a second leg up or at least a re-test of the high 23620 which would have been good for 100 points but was actually good for 220 if you held. The short around 23700 was tough. bears should signs of wanting a trading range with the structure after EU open and the sell-off from 23724 was unexpected in it’s strength since US markets pumped that hard.

Markets rally as missiles fly | how long can risk be ignored? Markets may be underpricing Israel and Iran risk.
Despite continued fighting—including high-impact strikes and rising casualties—global equities moved higher to start the week.
U.S. indices led the advance, with the Nasdaq gaining 1.5%, followed by the S&P 500 and Dow. Earlier in the session, European and Asian markets also closed higher, with Germany’s DAX up 0.8% and Japan’s Nikkei rising 1.3%. Now Asian markets are set to open for the second trading day of the week.
Tensions escalated further on Monday as Israel launched drone strikes on Iran’s state-run IRINN television headquarters in Tehran, interrupting a live broadcast. Additional Israeli attacks hit the South Pars gas field. In retaliation, Iran launched a fresh wave of missile attacks into Israel, killing at least five people.

DAX H4 I Bullish Bounce OfBased on the H4 chart analysis, the price is approaching our buy entry level at 23,196.26, a pullback support that aligns with the 23.6 Fibonacci retracement.
Our take profit is set at 23,655.66, a pullback resistance.
The stop loss is placed at 22,911.69, a swing low support.
High Risk Investment Warning
Trading Forex/CFDs on margin carries a high level of risk and may not be suitable for all investors. Leverage can work against you.
Stratos Markets Limited (tradu.com ):
CFDs are complex instruments and come with a high risk of losing money rapidly due to leverage. 63% of retail investor accounts lose money when trading CFDs with this provider. You should consider whether you understand how CFDs work and whether you can afford to take the high risk of losing your money.
Stratos Europe Ltd (tradu.com ):
CFDs are complex instruments and come with a high risk of losing money rapidly due to leverage. 63% of retail investor accounts lose money when trading CFDs with this provider. You should consider whether you understand how CFDs work and whether you can afford to take the high risk of losing your money.
Stratos Global LLC (tradu.com ):
Losses can exceed deposits.
Please be advised that the information presented on TradingView is provided to Tradu (‘Company’, ‘we’) by a third-party provider (‘TFA Global Pte Ltd’). Please be reminded that you are solely responsible for the trading decisions on your account. There is a very high degree of risk involved in trading. Any information and/or content is intended entirely for research, educational and informational purposes only and does not constitute investment or consultation advice or investment strategy. The information is not tailored to the investment needs of any specific person and therefore does not involve a consideration of any of the investment objectives, financial situation or needs of any viewer that may receive it. Kindly also note that past performance is not a reliable indicator of future results. Actual results may differ materially from those anticipated in forward-looking or past performance statements. We assume no liability as to the accuracy or completeness of any of the information and/or content provided herein and the Company cannot be held responsible for any omission, mistake nor for any loss or damage including without limitation to any loss of profit which may arise from reliance on any information supplied by TFA Global Pte Ltd.
The speaker(s) is neither an employee, agent nor representative of Tradu and is therefore acting independently. The opinions given are their own, constitute general market commentary, and do not constitute the opinion or advice of Tradu or any form of personal or investment advice. Tradu neither endorses nor guarantees offerings of third-party speakers, nor is Tradu responsible for the content, veracity or opinions of third-party speakers, presenters or participants.

#202524 - priceactiontds - weekly update - daxGood Day and I hope you are well.
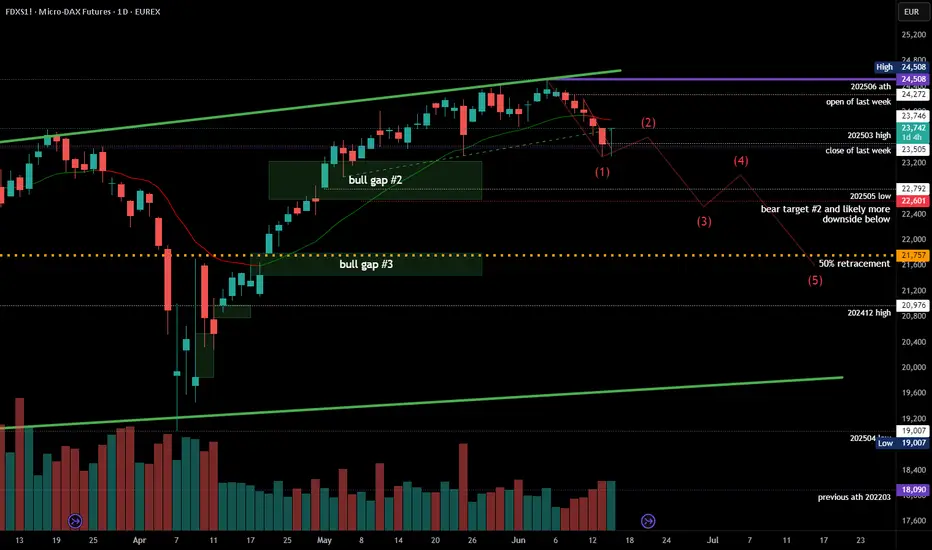
comment: Bears leaving no doubt who is in control of the market now. Volume is picking up on the move down and bear bars are getting bigger. I expect a bit more fighting around 23500 but once we break below, 23000 is the next target and also likely a gap close down to 22600. I have drawn my least bearish wave thesis on the chart where the 50% retracement gets hit over the next weeks. Much more bearish would be the 20000 target. If this selling continues without a pullback, I will adjust the legs.
current market cycle: trading range until we close below 23200 - then we are in the new bear trend. As of now the continuation inside the range is more likely.
key levels for next week: 22600 - 24000
bull case: Got nothing for the bulls but in case we trade back above 23580, we have to assume sideways for longer. I don’t think we can try another new ath after this selling. Bulls found support at the sell-spike from the 50% tariff announcement. If overall markets won’t sell off early on Monday, we can expect some sideways movement before market gets the next impulse up or down. Anything above 24100 would surprise me big time.
Invalidation is below 23280
bear case: 23280 is the price to break for more downside and 23580 is the most important price for bears to prevent the bulls from getting. If 23580 holds, we can do another strong leg down to close the gap 22600. If we go above, the next bear trend line would be around 23950ish and if we get there we will likely test 24000 again. After 5 consecutive bear bars, bulls can not hold longs in hope for another run at the highs. The bear bars are getting bigger and market tested above 24000 enough to know there are not enough buyers. Bulls tried 4 times to 3 times to continue the trend. Selling this top with long term shorts is as good as it gets. On lower time frames I expect a bit more sideways before another leg down.
Invalidation is above 23280
short term: Neutral but only on time frames lower than 4h. W1 has likely concluded but I expect at least a big second leg down to 22600ish. Bears have to keep it below 23580 or we could test back up to 24000.
medium-long term from 2025-06-15: Bull trend has most likely concluded. Long term shorts are fine. Stop has to be at least 24508. I see it 70% or more that we will see 22000 before end of August.