DAX: Already done? 📌🤔Since last Wednesday, the German stock index DAX has been rising again. In theory, the low of the turquoise wave alt.4 could already be in place. However, this scenario would require a rise above the resistance at 15 647, which we consider to be 33% probable. Until then, we maintain our primary expectation that the turquoise target zone between 14 866 and 14 555 points should be targeted for the low.
DAX Index

DAX Elliott Wave Analysis for Tuesday 10/10/2023In the higher timeframe, it looks like we have completed a WXY correction. If the low holds, the wave (2) correction can be finished. If the upward move fails, several bearish scenarios can be considered.

DAX has started the new Channel Down bullish legDAX hit last week the bottom (Lower Highs trend-line) of the Channel Down that started after the July 31 High. Technically that is a short-term buy signal, aimed at the 1D MA50 (blue trend-line) and the top of the Channel Down. Our current target is 15500 (also on a +3.70% symmetry with the previous bullish leg of the Channel).
A 1D candle close above the Channel Up will be a bullish break-out signal targeting 15920 (0.618 Fibonacci retracement level). But until it does, the trend will remain bearish within the Channel Down, targeting the 1W MA100 (green trend-line) at 14750.
-------------------------------------------------------------------------------
** Please LIKE 👍, FOLLOW ✅, SHARE 🙌 and COMMENT ✍ if you enjoy this idea! Also share your ideas and charts in the comments section below! This is best way to keep it relevant, support us, keep the content here free and allow the idea to reach as many people as possible. **
-------------------------------------------------------------------------------
💸💸💸💸💸💸
👇 👇 👇 👇 👇 👇

GER30: Thoughts and AnalysisToday's focus: GER30
Pattern – LH - Lower support test
Support – 15,055 - 15,015
Resistance – 15,287 - 15,504
Hi, and thanks for checking out today's analysis. The GER30 daily is today's focus. Due to the tragic events over the weekend, we have seen stock futures trading lower into the new week. The GER30 is testing Friday's firm finish and could be forming a new lower high. The key here will be if sellers can be price back down to test 15,055 - 15,015 support. A break set up a continuation of the med-term downtrend.
If buyers can reject today's selling and break back above Friday's high, this could suggest a new higher leg and a possible test of 15,504.
Good trading.

DAX Elliott Wave Analysis for Monday 09/10/2023 (+ Higher TF)In the higher timeframe, it looks like we have completed a WXY correction. If the low holds, the wave (2) correction can be finished. If the upward move fails, several bearish scenarios can be considered.

Rheinmetall: Locked and Loaded 💥After briefly dipping below the turquoise target range of €245.60 to €228.40, Rheinmetall's stock price has rebounded into this zone. We now believe it has set the low for the magenta wave (iv at this point. Consequently, a substantial increase to €320 is anticipated.

DAX Elliott Wave Analysis for Friday 06/10/2023There are some signs in favor of a reversal which means that the corrective WXY structure down can be finished. However, at this moment, we are still bearish in the daily and the weekly timeframe.

05102023 - #DAXMarket made a nice bullish reversal candle yesterday when all are bearish, and this was as per plan ().
IMO, price action is bullish vs price is still below the DBZ. But I would go for the move higher from here. Looking for PZ to hold and a move to target 15320. I will not discount the possibility of price reacting against the DBZ and a down move first (to 15002) but overall, looking for a move to 15236 minimally and 15320 likely, before any strong reaction from sellers.

DAX Elliott Wave Analysis for Thursday 05/10/2023There are some signs in favor of a reversal which means that the corrective WXY structure down can be finished. However, at this moment, we are still bearish in the daily and the weekly timeframe.

DAX: Channel Down bottom buy to 15,500.DAX touched the bottom of the Channel Down today and immediately reacted positively. The 1D timeframe is bearish technically (RSI = 33.050, MACD = -53.850, ADX = 44.059) but the RSI double bottomed inside a Zone same way it did on the August 18th LL. We are long, aiming at a +3.73% rise (same as August) as so far the bearish legs at least have been symmetrical. We may see a 1D MA50 test there (TP = 15,500).
Prior idea:
## If you like our free content follow our profile to get more daily ideas. ##
## Comments and likes are greatly appreciated. ##

#DAX to correct----------DAX LONG---------
I went long on DAX German 40 index this morning as I expect a correction from current levels. Not a reversal yet but still a good looking trade this morning.
This is not a financial advice. Do your own research and analysis.

DAX Elliott Wave Analysis for Wednesday 04/10/2023As expected we are seeing further downside as a wave ((v)). There are some signs in favor of a reversal which means that the corrective WXY structure down can be finished. However, at this moment, we are still bearish in the daily and the weekly timeframe.

DAX Elliott Wave Analysis for Tuesday 03/10/2023As expected we are seeing further downside as a wave ((v)). There are some signs in favor of a reversal which means that the corrective WXY structure down can be finished. However, at this moment, we are still bearish in every timeframe.

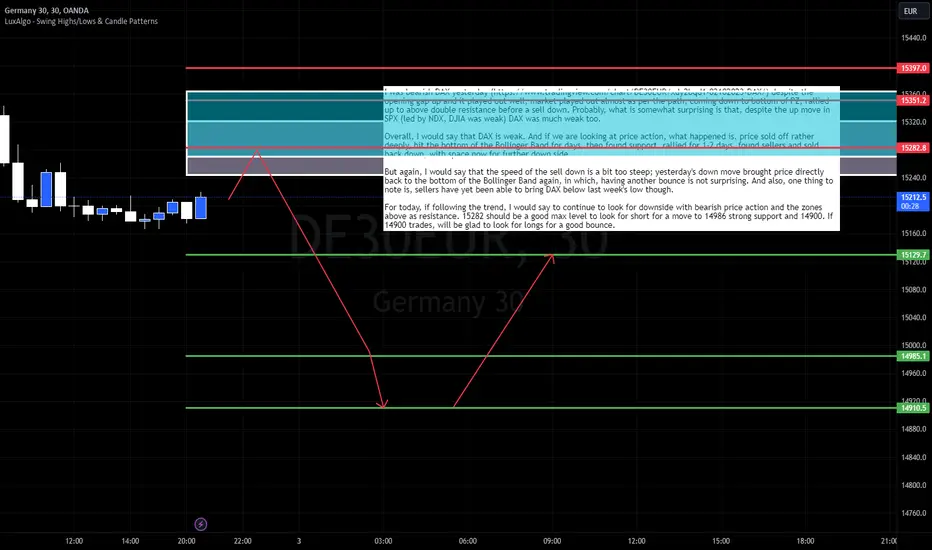
03102023 - #DAXI was bearish DAX yesterday () despite the opening gap up and it played out well; market played out almost as per the path, coming down to bottom of PZ, rallied up to above double resistance before a sell down. Probably, what is somewhat surprising is that, despite the up move in SPX (led by NDX, DJIA was weak) DAX was much weak too.
Overall, I would say that DAX is weak. And if we are looking at price action, what happened is, price sold off rather deeply, hit the bottom of the Bollinger Band for days, then found support, rallied for 1-2 days, found sellers and sold back down, with space now for further down side.
But again, I would say that the speed of the sell down is a bit too steep; yesterday's down move brought price directly back to the bottom of the Bollinger Band again, in which, having another bounce is not surprising. And also, one thing to note is, sellers have yet been able to bring DAX below last week's low though.
For today, if following the trend, I would say to continue to look for downside with bearish price action and the zones above as resistance. 15282 should be a good max level to look for short for a move to 14986 strong support and 14900. If 14900 trades, will be glad to look for longs for a good bounce.
DAX Bearish Bias! Sell!
Hello,Traders!
DAX looks bearish because
The index is now retesting
A broken key level of 15,500
Which is now a resistance
So I think that we will see
A further move down
Sell!
Like, comment and subscribe to help us grow!
Check out other forecasts below too!

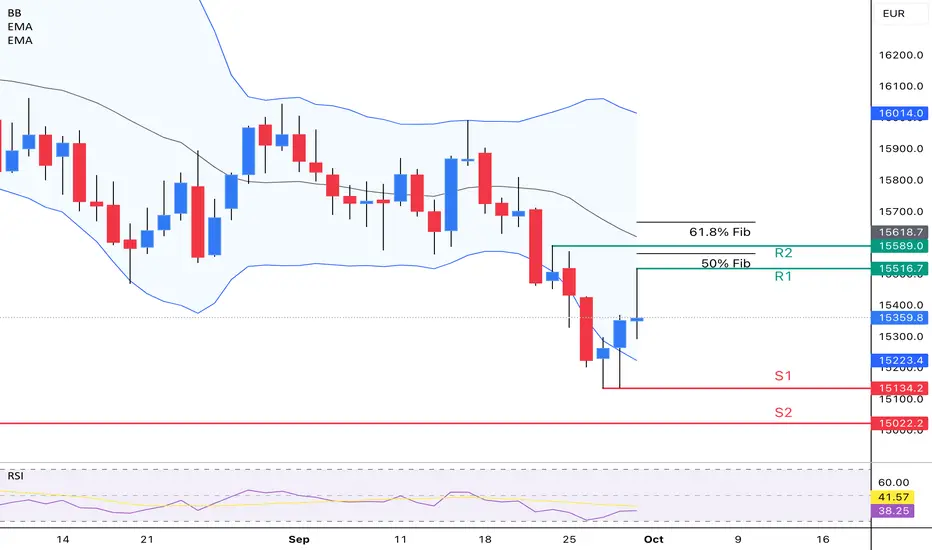
DAX TRADING OPPORTUNITY Following the Downtrend on the DAX, price made a lower high and lower low creating a new Market Structure. Digging into the volume-candle analysis the upward move from Wednesday to Friday last week, created under light volume and small range candles. Showing the potential downtrend continuation.
Price rejection on Friday below the 50% fib reveals the strength of the bears in the DAX.
considering the LHLL and the RSI below 50, both indicated bearishness. On this time frame.
If price continues moving lower there is a key level of Support S1 found around 15143 and if price continues lower the next Key Support found at S2 around 15022. Pay attention to this , it is just above the round number 15000.
In case the price continues moving upwards, there is a strong Resistance found at R2 that is in between the 50% and 61.8% fib level and this can cause the market to move lower
Happy Trading guys
DAX Elliott Wave Analysis for Monday 02/10/2023 (+ Higher TF)For traders (lower timeframe)
The higher degree correction in the DAX can be finished as we took out the wave (W) low. However, the main expectation is that we see some further downside as a wave ((v)).
For investors (higher timeframe):
In the higher timeframe, the higher level wave ((1)) is probably finished. There is also an alternative scenario where we can make one more high to finish wave ((1)). This wave ((1)) should be followed by a wave ((2)) to the downside which is an interesting buying opportunity for investors.

✅DAX WILL GO DOWN|SHORT🔥
✅DAX made a retest of
The broken key level
Of 15,530 which is now
A resistance and made a
Pullback so I will be expecting
A further move down
SHORT🔥
✅Like and subscribe to never miss a new idea!✅

DAX Rejection on the MA50 (4h).DAX remains inside a Channel Down pattern. The price just got rejected on the MA50 (4h).
The pattern so far matches exactly the first bearish sequence of the pattern.
Trading Plan:
1. Sell on the current market price and keep as long as the price trades under it.
Targets:
1. 14950 (-3.75%, symmetry with August).
Tips:
1. The MACD (4h) is on the exact same level as the August 11th rejection on the MA50 (4h).
Please like, follow and comment!!
Notes:
Past trading plan:

DAX Bottom rebound buy opportunity to 15650.DAX (DE40) has made a short-term bottom near the Lower Lows trend-line of the Channel Down after hitting the 1W MA50 (red trend-line). This is a short-term buy signal to at least 15650, which is on the Channel's top and represents a symmetrical +3.66% rise similar to the previous Lower High leg. If it doesn't get rejected, this is where the Fibonacci retracement levels come forward. The 0.382 Fib is almost exactly on our target.
A break above, which would also be a break above the 1D MA50 (blue trend-line), targets Resistance 1 (15995), which is exactly on the 0.618 Fib. Only a candle closing above that Resistance justifies a bullish reversal for the long-term.
If the 1D MA50 doesn't break, we expect the Channel Down to look for a 1W candle closing below the 1W MA50, which can technically deliver a downward extension towards the 1W MA100 (green trend-line) on the 6-month Support Zone. If that scenario prevails, we will need to see a clear indication that this will be the same High Demand Zone as during March 15 - 24, when all attempts to break it reversed emphatically as most candles closed above it leaving long wicks inside the Zone.
-------------------------------------------------------------------------------
** Please LIKE 👍, FOLLOW ✅, SHARE 🙌 and COMMENT ✍ if you enjoy this idea! Also share your ideas and charts in the comments section below! **
-------------------------------------------------------------------------------
💸💸💸💸💸💸
👇 👇 👇 👇 👇 👇

DAX Elliott Wave Analysis for Friday 29/09/2023The higher degree correction in the DAX can be finished as we took out the wave (W) low. However, the main expectation is that we see some further downside.

DAX Elliott Wave Analysis for Thursday 28/09/2023The higher degree correction in the DAX can be finished as we took out the wave (W) low. However, the main expectation is that we see some further downside.

DAX Elliott Wave Analysis for Wednesday 27/09/2023The higher degree correction in the DAX can be finished as we took out the wave (W) low. However, the main expectation is that we see some further downside.
