Europe’s Political Powder Keg: Markets on Edge!🔥 Europe’s Political Powder Keg: Markets on Edge! 🔥
Europe’s elections just dropped a BOMB! 💣 Poland (May 18), Portugal (May 18), and Romania (May 4 & 18) rejected far-right surges, but the center’s crumbling. 🇪🇺 Poland’s pro-EU Trzaskowski barely leads—June 1 runoff could flip it! Portugal’s Chega is shaking the old guard, and Romania’s Nicușor Dan rides an anti-corruption wave.
Why care? Political chaos = market volatility. 📉 EUR/USD is wobbling, DAX could tank, and defense stocks (🇺🇦 ties) are in play.
💡 Trade Idea: Overlay EUR/USD with election dates (May 4, May 18, June 1) to catch volatility spikes.
❓ What’s your move? Will Europe’s turmoil crash markets or spark a rally? Drop your take below! 👇
DAX Index

#202520 - priceactiontds - weekly update - dax futuresGood Day and I hope you are well.
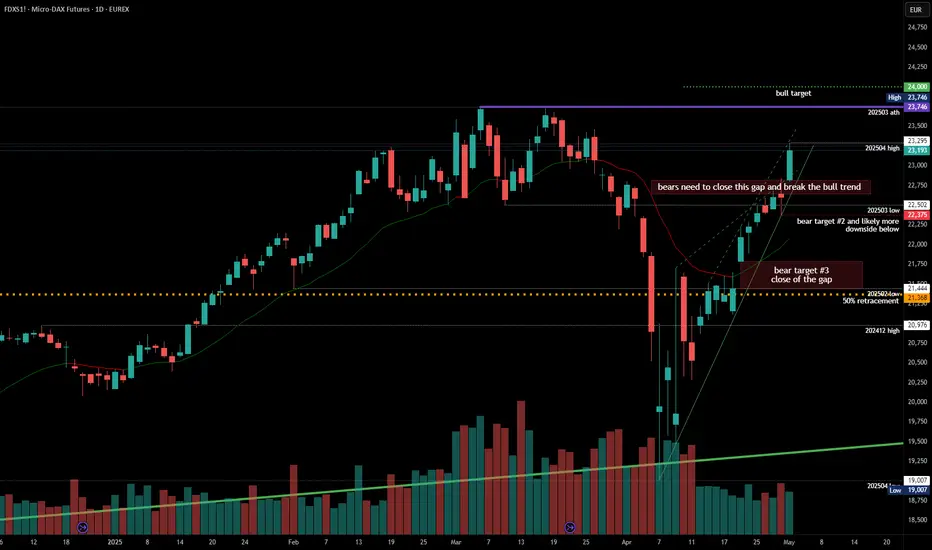
comment: We are only about 300 points higher than the previous week but market printed the obvious big round number and Friday we had the retest, which did not quite get there but close is always close enough. We are seeing somewhat of an increase in selling pressure but it’s not enough.
current market cycle: trading range and very broad bull channel on the weekly time frame
key levels for next week: 23000 - 24000
bull case: Best for bulls would be to go sideways and not let market fall below 23400. That’s pretty much all I can come up with for the bulls. Can we go much above 24000? We can but I can not see it happening. If we go higher, it will be without me. I am only interested in seeing an increase in selling pressure and looking for a good short entry. I give bulls 2-3 more days in trying to print 24000 again and if they fail 1-2 more times, they will give up and we can test back down to 23000. It would still be the most bullish outcome if we continue to range between 23000 and 24000.
Invalidation is below 22900.
bear case: I only want to short this but bears are not doing enough for me to consider it. I hate being early because it correlates big time with being wrong. My line in the sand would be a daily close below 23000 and the daily 20ema. Until bears get that, odds heavily favor the bulls to buy any pullback. So for now, not much to do as a bear. For this year I still expect at least 20000 to get hit again. So if you would force me to give an answer, I would short this with a stop 24600 and wait until we hit 20000 again. If we go into a recession, I would likely hold for lower.
Invalidation is above 24100.
short term: Neutral. I wait for clear topping signals and more selling pressure. Long scalps against support if bulls want 24000. Same as last week.
medium-long term from 2025-05-11: So here is my very rough guess about the next months. This short squeeze is clearly overdone and global macro stuff has most likely already deteriorated a great deal. Down to 20000 over the next weeks/months and form a big trading range. Up through October-Year end. Zero thought about a new bull trend above 24000. We most likely have not seen the lows for either 2025 or 2026. Good question is always, “How would you allocate 100k right now?” 50% short dax, 25% of it levered/options and with the rest I would scalp.

DAX Will Keep Growing! Buy!
Hello,Traders!
DAX broke the key horizontal
Level of 23,319 and the index
Made a pullback and retest
And is now going up again
So we are bullish biased
And we will be expecting
A further bullish move up
Buy!
Comment and subscribe to help us grow!
Check out other forecasts below too!
Disclosure: I am part of Trade Nation's Influencer program and receive a monthly fee for using their TradingView charts in my analysis.

DAX WILL KEEP GROWING|LONG|
✅DAX is trading in an uptrend
And the index made a bullish
Breakout of the key horizontal
Level of 23,400 and the breakout
Is confirmed so we are bullish
Biased and we will be expecting
A further bullish move up
LONG🚀
✅Like and subscribe to never miss a new idea!✅
Disclosure: I am part of Trade Nation's Influencer program and receive a monthly fee for using their TradingView charts in my analysis.

Is DAX ready for a slight correction lower?We are watching the German XETR:DAX as it is currently struggling to go for a new all-time high. Can this be the moment for a deeper correction lower?
Let's dig in...
MARKETSCOM:GERMANY40
Let us know what you think in the comments below.
Thank you.
77.3% of retail investor accounts lose money when trading CFDs with this provider. You should consider whether you understand how CFDs work and whether you can afford to take the high risk of losing your money. Past performance is not necessarily indicative of future results. The value of investments may fall as well as rise and the investor may not get back the amount initially invested. This content is not intended for nor applicable to residents of the UK. Cryptocurrency CFDs and spread bets are restricted in the UK for all retail clients.

2025-05-14 - priceactiontds - daily update - daxGood Evening and I hope you are well.
comment: Higher highs and higher lows compared to Tuesday. We are in a triangle and market is refusing to print below 23500. I do think we will see a big move tomorrow. What I don’t think is that we will close Friday at an extreme. If we get to 24000 again, I am very inclined to look to fade it again. Can we close this week below 23000? I gighly doubt that as well.
current market cycle: broad bull channel or trading range - doesn’t matter since you trade them the same
key levels: 23000 - 24100
bull case: Bulls want 24000 again and I think 23500 is the place where they are happy to scale in. Bears will likely give up tomorrow, if we move above 23650 since they tried 3 times since Monday and market is refusing to go lower. I still think bulls will likely not get much more than 24000. Every time we are in a form of a triangle, I will not write much since market is in balance around it’s midpoint and you should not interpret more into it than it is. We are in a clear bull trend and this sideways correction is better for bulls than bears, since sideways is acceptance and it means bears are not making much money.
Invalidation is below 23300.
bear case: Bears can not expect 23500 to break all of a sudden tomorrow. If anything, most have to cover if we go above 23650 because we could do 23750 or higher. I don’t have much for the bears. If they somehow break below 23440, it would open up the possibility of 23000 but for now it’s very unlikely.
Invalidation is above 24100.
short term: Neutral but rather looking for longs than shorts. Clear support 23500 and everyone expects at least a double top or more.
medium-long term from 2025-05-11: So here is my very rough guess about the next months. This short squeeze is clearly overdone and global macro stuff has most likely already deteriorated a great deal. Down to 20000 over the next weeks and form a big trading range. Up through October-Year end. Zero thought about a new bull trend above 24000 or that we have seen the lows for either 2025 or 2026. Good question is always, “How would you allocate 100k right now?”. 50% short dax, 25% of it levered/options and with the rest I would scalp.
trade of the day: Shorting above 23700 has been profitable all week but I expect it to fail either tomorrow or Friday. Market poked enough at it, that the chance of a breakout above is too big for me to continue to fade against that price.

Clean Energy: The Power That Will Shape Our FutureEnergy is the lifeblood of civilization—it fuels innovation, sustains economies, and powers every aspect of modern life. As demand skyrockets, we face a crucial decision: continue relying on fossil fuels that damage our planet or embrace clean energy solutions that pave the way for a sustainable future.
Despite geopolitical tensions, trade wars, and shifting policies around ESG and the Paris Climate Agreement, the clean energy sector remains unstoppable. While industries like digital finance, artificial intelligence, robotics, space exploration, quantum computing, and cloud infrastructure are experiencing unprecedented growth, they all hinge on one fundamental resource: energy. Without it, progress would stall.
Yet, as we race toward technological advancement, one truth remains: our planet’s well-being is inextricably linked to our energy choices. Sustainability is not just an option—it is a necessity.
The Four Elements of Clean Energy
Nature has already gifted us four forces of life—the sun, wind, water, and earth—each holding the potential to drive a clean energy revolution.
Solar Energy ☀️: Every hour, the sun showers Earth with more energy than humanity consumes in a year. Advances in photovoltaic technology are making solar power more efficient and affordable than ever. Countries leading the solar revolution—like China, Germany, and the U.S.—are setting a precedent for global energy transformation.
Wind Energy 🌬️: Harnessing the wind is one of the most effective ways to generate clean electricity. Offshore wind farms are growing at an exponential rate, proving that sustainable energy is not limited to land. The beauty of wind energy? It is limitless.
Hydropower 🌊: Water is power. Hydroelectric dams, tidal energy, and wave power offer continuous energy supply, proving to be one of the most reliable renewable sources available.
Geothermal Energy 🌍: Deep within the earth, heat energy is waiting to be tapped. Countries like Iceland have perfected the art of using geothermal power for electricity and heating, demonstrating that sustainable energy is not just a dream—it’s already reality.
Overcoming Challenges: The Resilience of Clean Energy
Yes, clean energy faces obstacles—tariff disputes, political instability, and corporate resistance. But progress is relentless. Costs of renewables are dropping, supply chains are adapting, and governments know that fossil fuels will not sustain global economies forever.
The Paris Climate Agreement keeps nations accountable, pushing for policies that support decarbonization and incentivize clean energy innovation. Meanwhile, ESG-driven investors are demanding sustainable business practices, forcing corporations to rethink their energy strategies.
Even legacy industries like oil and gas are shifting toward renewables, investing billions in solar, wind, and hydrogen technology. This is not just a trend—it is the future.
A Future Powered by Clean Energy
Imagine cities illuminated by solar grids, transportation fueled by hydrogen, and industries driven by wind power. Clean energy is not just about reducing emissions—it is about progress, prosperity, and survival.
The global energy demand is rising, but so is innovation. If space exploration, AI, robotics, and quantum computing are to thrive, clean energy must be at the core. And it will be—because the world is waking up to its necessity.
A cleaner, brighter future is not wishful thinking—it is already unfolding. The only question is: will we accelerate the transition, or hesitate in the face of change?
The time to act is now.
NASDAQ:CLNE NASDAQ:CETY NASDAQ:ICLN NASDAQ:CELS NASDAQ:GWE AMEX:PBD TVC:DXY

DAX: Will Go Up! Long!
My dear friends,
Today we will analyse DAX together☺️
The in-trend continuation seems likely as the current long-term trend appears to be strong, and price is holding above a key level of 23,491.05 So a bullish continuation seems plausible, targeting the next high. We should enter on confirmation, and place a stop-loss beyond the recent swing level.
❤️Sending you lots of Love and Hugs❤️

DAX H4 | Bullish uptrend to extend higher?The DAX (GER30) is trading close to an overlap support and could potentially bounce off this level to climb higher.
Buy entry is at 23,447.57 which is an overlap support.
Stop loss is at 22,700.00 which is a level that lies underneath an overlap support and the 23.6% Fibonacci retracement.
Take profit is at 24,732.86 which is a resistance that aligns with the 127.2% Fibonacci extension.
High Risk Investment Warning
Trading Forex/CFDs on margin carries a high level of risk and may not be suitable for all investors. Leverage can work against you.
Stratos Markets Limited (tradu.com):
CFDs are complex instruments and come with a high risk of losing money rapidly due to leverage. 63% of retail investor accounts lose money when trading CFDs with this provider. You should consider whether you understand how CFDs work and whether you can afford to take the high risk of losing your money.
Stratos Europe Ltd (tradu.com):
CFDs are complex instruments and come with a high risk of losing money rapidly due to leverage. 63% of retail investor accounts lose money when trading CFDs with this provider. You should consider whether you understand how CFDs work and whether you can afford to take the high risk of losing your money.
Stratos Global LLC (tradu.com):
Losses can exceed deposits.
Please be advised that the information presented on TradingView is provided to Tradu (‘Company’, ‘we’) by a third-party provider (‘TFA Global Pte Ltd’). Please be reminded that you are solely responsible for the trading decisions on your account. There is a very high degree of risk involved in trading. Any information and/or content is intended entirely for research, educational and informational purposes only and does not constitute investment or consultation advice or investment strategy. The information is not tailored to the investment needs of any specific person and therefore does not involve a consideration of any of the investment objectives, financial situation or needs of any viewer that may receive it. Kindly also note that past performance is not a reliable indicator of future results. Actual results may differ materially from those anticipated in forward-looking or past performance statements. We assume no liability as to the accuracy or completeness of any of the information and/or content provided herein and the Company cannot be held responsible for any omission, mistake nor for any loss or damage including without limitation to any loss of profit which may arise from reliance on any information supplied by TFA Global Pte Ltd.
The speaker(s) is neither an employee, agent nor representative of Tradu and is therefore acting independently. The opinions given are their own, constitute general market commentary, and do not constitute the opinion or advice of Tradu or any form of personal or investment advice. Tradu neither endorses nor guarantees offerings of third-party speakers, nor is Tradu responsible for the content, veracity or opinions of third-party speakers, presenters or participants.

2025-05-12 - priceactiontds - daily update - dax
Good Evening and I hope you are well.
comment: If you are a bull and longed anything last week and market hit your 24000 target today, you either took profits at the top and were happy about it or you watched them burn. Now what should we expect when the market hits 24000 the next time? Will bulls willingly hold through another pullback, knowing that it could be 500+ points deep again? I highly doubt that. Usually markets reach their targets and spend more time there or overshoot some to run more stops. Today we did not see any of that, which makes me think this could very well be the exhaustive end of the move → exhaustion gap.
current market cycle: broad bull channel or trading range - doesn’t matter since you trade them the same
key levels: 22000 - 24100
bull case: Bulls need to find acceptance above 23700 and go sideways here. Another strong move below 23500 would mean the bull trend line is broken for good and market could test lower in search of bigger support. I don’t have any targets above 24000 for the bulls and since the pullback was that deep, I am having a hard time believing we could do anything much higher than 24100. With today’s price action, I expect bulls to retest 24000 and maybe some, just to run stops but I do think most bulls will take profits there and bears will short it aggressively again, since it was so profitable today.
Invalidation is below 23300.
bear case: Bears did good in closing the gap down to 23588, making this an exhaustion gap. They will likely short again above 23800 since it has been profitable all day. Only a very strong move above 24100+ would force more bears to cover and we could accelerate up. Therefor sideways 23000 - 24000 is my expect price action for this week. Could bears push it down further because we have Opex? No idea and you should never try to ask why markets are doing something because you will never know the answer. Below 23400 I expect 23000 to come fast.
Invalidation is above 24100.
short term: Neutral. 23000 - 24000 is the range I see for the next days or even weeks, until we get better selling pressure. Trade the bull channel until it’s clearly broken.
medium-long term from 2025-05-11: So here is my very rough guess about the next months. This short squeeze is clearly overdone and global macro stuff has most likely already deteriorated a great deal. Down to 20000 over the next weeks and form a big trading range. Up through October-Year end. Zero thought about a new bull trend above 24000 or that we have seen the lows for either 2025 or 2026. Good question is always, “How would you allocate 100k right now?”. 50% short dax, 25% of it levered/options and with the rest I would scalp.
trade of the day: Long Globex open was the obvious trade but shorting 24000 was the even better one. I did not think the short was obvious and I took too long to realize it’s strength and then my risk was bigger than I was comfortable with, so I let it go down without me. I caught another long afterwards for 120+ points.

#202519 - priceactiontds - weekly update - dax
Good Day and I hope you are well.
comment: Bull targets are met and we have 4 legs up. 5 even if you count the spikes at the lows. We can do higher but what are the odds? Market is overdue for correction again and given that we easily could do -20% from here, it will be a tough summer. Technically it’s still just bullish but I would not buy up here. Macro-schmackro-wise it’s reasonable to assume that most companies with any US/CN business are worse off than they were before “liberation day”. So my take on this is still a house of cards ready to be blown away by the next small breeze.
current market cycle: trading range
key levels for next week: 22600 - 24000
bull case: 5 Consecutive bull weeks now. If you buy into this at the high, only God may help you. 24000 is the obvious target and it’s a coin flip if bulls can get it. What would make me turn bull? Nothing. Even if bulls print 24400, I would expect it to crash down in less than 2 weeks.
Invalidation is below 22900.
bear case: Two very small pullbacks last week and bulls bought it. Market is refusing to go down and we are still making higher highs. Nothing for the bears here until bulls are clearly exhausted and want out. Market turns more neutral with a daily close below 23000 and I think bearish only below 22600.
Invalidation is above 24100.
short term: Neutral. I wait for clear topping signals and more selling pressure. Long scalps against support if bulls want 24000.
medium-long term from 2025-05-11: So here is my very rough guess about the next months. This short squeeze is clearly overdone and global macro stuff has most likely already deteriorated a great deal. Down to 20000 over the next weeks and form a big trading range. Up through October-Year end. Zero thought about a new bull trend above 24000 or that we have seen the lows for either 2025 or 2026. Good question is always, “How would you allocate 100k right now?”. 50% short dax, 25% of it levered/options and with the rest I would scalp.

2025-05-07 - priceactiontds - daily update - daxGood Evening and I hope you are well.
comment: Triangle as in other markets, will likely do a strong move tomorrow or Friday.
current market cycle: trading range
key levels: 21000 - 24000
bull case: Bulls see this as a shallow/sideways pullback at the highs and want continuation for a new ath. They are trading far above the daily 20ema and the volume is picking up again. Yesterday bulls bought a big pullback but failed to make higher highs today, so they are likely disappointed. I don’t think many bulls want to stay long when we fail to make higher highs but rather wait for another pullback. So either they get the new ath tomorrow, or risk of running stops below 22979 increases.
Invalidation is below 23300.
bear case: Bears tried two times now to push the market lower and failed. If we make higher highs again, they will most likely give up and wait to see how high this can go before they short again. Only below 22979 will bears do some damage to the bull case and we could maybe see an acceleration down. For now bears are to weak to print lower lows but bulls are also weak, which is the reason why we printed a triangle. Probably best to do nothing and wait for the strong next move.
Invalidation is above 23550.
short term: Neutral. Below 23000 I favor the bears and above 23400 we are likly going for 23550 and if that won’t hold, we could do 24000. Markets keep ignoring bad news, so the path of least resistance is likely still up but it’s a guess and nothing you should trade on. Trade whats in front of you and not what you think the market should do. Right now it’s in a tight range waiting for the next impulse.
medium-long term from 2024-03-16: Bear trend is over. My rough guess for now is that we will stay inside this trading range 19000 - 24000 for much longer or until economic data becomes the excrementshow I expect it to become over the next months.
trade of the day: Shorting EU open and holding for 23200, which was around prior support.

DAX at a Crossroads: Will Resistance Trigger a Pullback?The German 40 (DAX) has been on a strong bullish run, now trading into a key resistance zone near previous range highs. This area is likely packed with liquidity (buy stops), making it a potential turning point. Given the overextended price action and current fundamentals, a retracement is likely as profit-taking and stop orders trigger. While sentiment has been bullish, caution is warranted at these levels. I am expecting a pullback before any further upside. Not financial advice.

DAX CAUTION!"From Errrections Come Corrections." Unlike the Eiffel Tower pattern, this setup is less severe. It’s more likely to resolve through time and price consolidation than a complete reversal.

DAX H4 | Falling toward an overlap supportThe DAX (GER30) is falling towards an overlap support and could potentially bounce off this level to climb higher.
Buy entry is at 22,794.30 which is an overlap support.
Stop loss is at 22,200.00 which is a level that lies underneath a swing-low support.
Take profit is at 23,447.57 which is a multi-swing-high resistance.
High Risk Investment Warning
Trading Forex/CFDs on margin carries a high level of risk and may not be suitable for all investors. Leverage can work against you.
Stratos Markets Limited (tradu.com):
CFDs are complex instruments and come with a high risk of losing money rapidly due to leverage. 63% of retail investor accounts lose money when trading CFDs with this provider. You should consider whether you understand how CFDs work and whether you can afford to take the high risk of losing your money.
Stratos Europe Ltd (tradu.com):
CFDs are complex instruments and come with a high risk of losing money rapidly due to leverage. 63% of retail investor accounts lose money when trading CFDs with this provider. You should consider whether you understand how CFDs work and whether you can afford to take the high risk of losing your money.
Stratos Global LLC (tradu.com):
Losses can exceed deposits.
Please be advised that the information presented on TradingView is provided to Tradu (‘Company’, ‘we’) by a third-party provider (‘TFA Global Pte Ltd’). Please be reminded that you are solely responsible for the trading decisions on your account. There is a very high degree of risk involved in trading. Any information and/or content is intended entirely for research, educational and informational purposes only and does not constitute investment or consultation advice or investment strategy. The information is not tailored to the investment needs of any specific person and therefore does not involve a consideration of any of the investment objectives, financial situation or needs of any viewer that may receive it. Kindly also note that past performance is not a reliable indicator of future results. Actual results may differ materially from those anticipated in forward-looking or past performance statements. We assume no liability as to the accuracy or completeness of any of the information and/or content provided herein and the Company cannot be held responsible for any omission, mistake nor for any loss or damage including without limitation to any loss of profit which may arise from reliance on any information supplied by TFA Global Pte Ltd.
The speaker(s) is neither an employee, agent nor representative of Tradu and is therefore acting independently. The opinions given are their own, constitute general market commentary, and do not constitute the opinion or advice of Tradu or any form of personal or investment advice. Tradu neither endorses nor guarantees offerings of third-party speakers, nor is Tradu responsible for the content, veracity or opinions of third-party speakers, presenters or participants.

2025-05-05 - priceactiontds - daily update - daxGood Evening and I hope you are well.
comment: Historic rally we are witnessing. This move is as unlikely, climactic and overdone as can be. Yet we only move higher. Can’t short this yet. Bulls in full control, don’t fight it.
current market cycle: trading range
key levels: 21000 - 24000
bull case: Bulls will likely go for 24000 over the next days. Since no bears are around, try to find any decent pullback to long until it stops working. I think bulls should keep this above the 1h 20ema or we might test down to the bigger trend line around 23000.
Invalidation is below 23300.
bear case: Bears need consecutive closes below the 1h 20ema. Simple as that. Then they can test the big bull trend line around 23000. Unless we get a huge news bomb bear surprise, this will most likely continue higher or at least the next bigger pullback gets bought. Bears are not making money at all, so don’t try to be the hero bear.
Invalidation is above 23550.
short term: Neutral. Will only long on a pullback to 15m or 1h 20ema and if market refuses to go down, as it did today with the 15m 20ema. I will become bearish below 23000 but only after market retested the highs and printed a credible top. A big bear news could change that but for now it’s unlikely.
medium-long term from 2024-03-16: Bear trend is over. My rough guess for now is that we will stay inside this trading range 19000 - 24000 for much longer or until economic data becomes the shitshow I expect it to become over the next months.
trade of the day: Buying near the 15m 20ema.

DAX Correction Ahead! Sell!
Hello,Traders!
DAX is trading in a strong
Uptrend but the index is
Locally overbought so after
The retest we will be expecting
A local pullback and a
Bearish correction
Sell!
Comment and subscribe to help us grow!
Check out other forecasts below too!
Disclosure: I am part of Trade Nation's Influencer program and receive a monthly fee for using their TradingView charts in my analysis.

#202518 - priceactiontds - weekly update - daxGood Evening and I hope you are well.
comment: No one knows if this will be a lower high or a new ath. It does not matter. Buying up here is bad no matter how you look at it. Sure it can be good for a scalp but any bull stop is far away. Until bears start closing gaps, bulls remain in full control. Make no mistake, this is one of those instances where economic reality and market is so far apart that you will look back in hindsight for not going bigger on the shorts once it turns. Can become easily the trade of the year.
current market cycle: trading range
key levels: 19000 - 24000
bull case: Another strong breakout by the bulls on Friday. We are in a clear third leg which could get us to 24000 or become a lower high, you never know in advance. Move is on low volume and climactic that once this turns, it will most likely be violent. There are no reasons for bulls to be up here except a short squeeze. So naturally I doubt we could go much above 24000 if we get there at all.
Invalidation is below 21900.
bear case: Bears still have nothing. No selling pressure what so ever, so path of least resistance is up. The first pullback will likely be bought but that depends on how deep it is and if we get one at all. Bears know this is as very tight and unsustainable bull channel up but that does not matter because market already made 22% from the lows. Which by itself is beyond insane. I do think bears need bad news to ignite the selling. We could easily stay another couple of weeks up here before it turns again.
Invalidation is above 24100.
short term: Neutral. Getting bullish after this parabolic buy climax is moronic but we are not seeing any selling pressure, so I will just sit on hands.
medium-long term from 2024-03-16: Bear trend is over. My rough guess for now is that we will stay inside this trading range 19000 - 24000 for much longer or until economic data becomes the excrementshow I expect it to become over the next months
DAX: Bears Are Winning! Short!
My dear friends,
Today we will analyse DAX together☺️
The price is near a wide key level
and the pair is approaching a significant decision level of 22,904.4 Therefore, a strong bearish reaction here could determine the next move down.We will watch for a confirmation candle, and then target the next key level of 22,755.9..Recommend Stop-loss is beyond the current level.
❤️Sending you lots of Love and Hugs❤️

DAX H4 | Potential bullish bounceThe DAX (GER30) JPY is falling towards an overlap support and could potentially bounce off this level to climb higher.
Buy entry is at 22,574.39 which is an overlap support.
Stop loss is at 21,780.00 which is a level that lies underneath an overlap support and the 23.6% Fibonacci retracement.
Take profit is at 23,447.57 which is a multi-swing-high resistance.
High Risk Investment Warning
Trading Forex/CFDs on margin carries a high level of risk and may not be suitable for all investors. Leverage can work against you.
Stratos Markets Limited (tradu.com):
CFDs are complex instruments and come with a high risk of losing money rapidly due to leverage. 63% of retail investor accounts lose money when trading CFDs with this provider. You should consider whether you understand how CFDs work and whether you can afford to take the high risk of losing your money.
Stratos Europe Ltd (tradu.com):
CFDs are complex instruments and come with a high risk of losing money rapidly due to leverage. 63% of retail investor accounts lose money when trading CFDs with this provider. You should consider whether you understand how CFDs work and whether you can afford to take the high risk of losing your money.
Stratos Global LLC (tradu.com):
Losses can exceed deposits.
Please be advised that the information presented on TradingView is provided to Tradu (‘Company’, ‘we’) by a third-party provider (‘TFA Global Pte Ltd’). Please be reminded that you are solely responsible for the trading decisions on your account. There is a very high degree of risk involved in trading. Any information and/or content is intended entirely for research, educational and informational purposes only and does not constitute investment or consultation advice or investment strategy. The information is not tailored to the investment needs of any specific person and therefore does not involve a consideration of any of the investment objectives, financial situation or needs of any viewer that may receive it. Kindly also note that past performance is not a reliable indicator of future results. Actual results may differ materially from those anticipated in forward-looking or past performance statements. We assume no liability as to the accuracy or completeness of any of the information and/or content provided herein and the Company cannot be held responsible for any omission, mistake nor for any loss or damage including without limitation to any loss of profit which may arise from reliance on any information supplied by TFA Global Pte Ltd.
The speaker(s) is neither an employee, agent nor representative of Tradu and is therefore acting independently. The opinions given are their own, constitute general market commentary, and do not constitute the opinion or advice of Tradu or any form of personal or investment advice. Tradu neither endorses nor guarantees offerings of third-party speakers, nor is Tradu responsible for the content, veracity or opinions of third-party speakers, presenters or participants.

DAX: forming the 1st Golden Cross since December!DAX has just turned bullish again on its 1D technical outlook (RSI = 58.773, MACD = 85.200, ADX = 45.497) and tonight will form the first 4H Golden Cross in 5 months (since December 2nd 2024). This comes to compliment a 1D MACD Bullish Cross that was formed last week. The pattern is identical to the November - December rise and as you see both rebounds took palce on the S1 level. We are long, expecting the R1 level to be tested (TP = 23,480).
## If you like our free content follow our profile to get more daily ideas. ##
## Comments and likes are greatly appreciated. ##

DAX: Target Is Down! Short!
My dear friends,
Today we will analyse DAX together☺️
The market is at an inflection zone and price has now reached an area around 22,461.17 where previous reversals or breakouts have occurred.And a price reaction that we are seeing on multiple timeframes here could signal the next move down so we can enter on confirmation, and target the next key level of 22,275.67..Stop-loss is recommended beyond the inflection zone.
❤️Sending you lots of Love and Hugs❤️

DAX 40 starts to show neutrality around the 22,000 levelThe German index has posted steady gains, rising nearly 7% over the last four trading sessions, mainly driven by the low interest rates maintained by the ECB at 2.25%, as well as the easing of potential trade war tensions, which has allowed the index’s bullish bias to remain strong in recent weeks. However, buying candles have been gradually diminishing over the last sessions, and it is likely that a selling candle may appear in today’s session, reinforcing short-term neutrality as the index trades above the 22,000 level.
Accelerated Trend: Since April 9, the DAX has shown significant upward movements, resulting in a fairly steep bullish slope and giving way to an accelerated uptrend. If the DAX fails to hold the recent weeks’ highs in the short term, this accelerated price movement could lead to corrective pullbacks. However, the dominant bias in the longer term remains bullish.
ADX: The ADX line has begun to decline and is now facing the neutral area marked around the 20 level. Frequent oscillations around this level indicate that volatility has decreased and could lead to sustained price neutrality in the short term.
MACD: The MACD histogram remains above the indicator’s 0 level but has shown a steady deceleration, which may signal a lack of momentum in the average movement of the moving averages. As the MACD histogram continues to narrow, it could pave the way for slight bearish momentum in the DAX’s daily chart over the short term.
Key levels to watch:
22,000 points: A nearby support area coinciding with an important psychological level, which could act as a significant barrier against potential short-term price pullbacks.
21,400 points: A distant support area aligning with the 100-period simple moving average. Bearish movements reaching this level could threaten the bullish formation currently seen on the chart.
23,000 points: A definitive resistance level coinciding with the area marked by the DAX’s all-time highs. Buying movements returning to this level could trigger a consistent bullish bias and a much more relevant uptrend in the short term.
Written by Julian Pineda, CFA – Market Analyst
