DAX H1 | Potential bullish bounce?DAX (GER30) is falling towards a pullback support and could potentially bounce off this level to climb higher.
Buy entry is at 21,467.75 which is a pullback support that aligns close to the 23.6% Fibonacci retracement.
Stop loss is at 21,000.00 which is a level that lies underneath an overlap support.
Take profit is at 22,576.90 which is a swing-high resistance.
High Risk Investment Warning
Trading Forex/CFDs on margin carries a high level of risk and may not be suitable for all investors. Leverage can work against you.
Stratos Markets Limited (tradu.com):
CFDs are complex instruments and come with a high risk of losing money rapidly due to leverage. 63% of retail investor accounts lose money when trading CFDs with this provider. You should consider whether you understand how CFDs work and whether you can afford to take the high risk of losing your money.
Stratos Europe Ltd (tradu.com):
CFDs are complex instruments and come with a high risk of losing money rapidly due to leverage. 63% of retail investor accounts lose money when trading CFDs with this provider. You should consider whether you understand how CFDs work and whether you can afford to take the high risk of losing your money.
Stratos Global LLC (tradu.com):
Losses can exceed deposits.
Please be advised that the information presented on TradingView is provided to Tradu (‘Company’, ‘we’) by a third-party provider (‘TFA Global Pte Ltd’). Please be reminded that you are solely responsible for the trading decisions on your account. There is a very high degree of risk involved in trading. Any information and/or content is intended entirely for research, educational and informational purposes only and does not constitute investment or consultation advice or investment strategy. The information is not tailored to the investment needs of any specific person and therefore does not involve a consideration of any of the investment objectives, financial situation or needs of any viewer that may receive it. Kindly also note that past performance is not a reliable indicator of future results. Actual results may differ materially from those anticipated in forward-looking or past performance statements. We assume no liability as to the accuracy or completeness of any of the information and/or content provided herein and the Company cannot be held responsible for any omission, mistake nor for any loss or damage including without limitation to any loss of profit which may arise from reliance on any information supplied by TFA Global Pte Ltd.
The speaker(s) is neither an employee, agent nor representative of Tradu and is therefore acting independently. The opinions given are their own, constitute general market commentary, and do not constitute the opinion or advice of Tradu or any form of personal or investment advice. Tradu neither endorses nor guarantees offerings of third-party speakers, nor is Tradu responsible for the content, veracity or opinions of third-party speakers, presenters or participants.
DAX Index

Ger40 dax SeekingPips short SELL UP here hight Reward to Risk🌟Good morning ladies and gentlemen.🌟
I like the Reward to Risk profile on this setup over 7r ✅️
Although it's one of my lower win rate strategies it's a simple set and forget trade setup with the statistics to backbup my plan.
🟢SeekingPips🟢 is short with Stop Loss above the highest high this morning.
On the feed that I am using that high 21839.5
I'M LOOKING for a GAP FILL🚥

DAX: Move Down Expected! Short!
My dear friends,
Today we will analyse DAXtogether☺️
The price is near a wide key level
and the pair is approaching a significant decision level of 21,196.29 Therefore, a strong bearish reaction here could determine the next move down.We will watch for a confirmation candle, and then target the next key level of 21,007.25..Recommend Stop-loss is beyond the current level.
❤️Sending you lots of Love and Hugs❤️

DAX: Move Up Expected! Long!
My dear friends,
Today we will analyse DAX together☺️
The recent price action suggests a shift in mid-term momentum. A break below the current local range around 21,159.51 will confirm the new direction downwards with the target being the next key level of 21,322.13.and a reconvened placement of a stop-loss beyond the range.
❤️Sending you lots of Love and Hugs❤️

DAX H4 | Rising into a swing-high resistanceThe DAX (GER30) is rising towards a swing-high resistance and could potentially reverse off this level to drop lower.
Sell entry is at 21,467.75 which is a swing-high resistance.
Stop loss is at 22,200.00 which is a level that sits above a pullback resistance.
Take profit is at 20,283.76 which is an overlap support that aligns with the 50.0% Fibonacci retracement.
High Risk Investment Warning
Trading Forex/CFDs on margin carries a high level of risk and may not be suitable for all investors. Leverage can work against you.
Stratos Markets Limited (tradu.com):
CFDs are complex instruments and come with a high risk of losing money rapidly due to leverage. 63% of retail investor accounts lose money when trading CFDs with this provider. You should consider whether you understand how CFDs work and whether you can afford to take the high risk of losing your money.
Stratos Europe Ltd (tradu.com):
CFDs are complex instruments and come with a high risk of losing money rapidly due to leverage. 63% of retail investor accounts lose money when trading CFDs with this provider. You should consider whether you understand how CFDs work and whether you can afford to take the high risk of losing your money.
Stratos Global LLC (tradu.com):
Losses can exceed deposits.
Please be advised that the information presented on TradingView is provided to Tradu (‘Company’, ‘we’) by a third-party provider (‘TFA Global Pte Ltd’). Please be reminded that you are solely responsible for the trading decisions on your account. There is a very high degree of risk involved in trading. Any information and/or content is intended entirely for research, educational and informational purposes only and does not constitute investment or consultation advice or investment strategy. The information is not tailored to the investment needs of any specific person and therefore does not involve a consideration of any of the investment objectives, financial situation or needs of any viewer that may receive it. Kindly also note that past performance is not a reliable indicator of future results. Actual results may differ materially from those anticipated in forward-looking or past performance statements. We assume no liability as to the accuracy or completeness of any of the information and/or content provided herein and the Company cannot be held responsible for any omission, mistake nor for any loss or damage including without limitation to any loss of profit which may arise from reliance on any information supplied by TFA Global Pte Ltd.
The speaker(s) is neither an employee, agent nor representative of Tradu and is therefore acting independently. The opinions given are their own, constitute general market commentary, and do not constitute the opinion or advice of Tradu or any form of personal or investment advice. Tradu neither endorses nor guarantees offerings of third-party speakers, nor is Tradu responsible for the content, veracity or opinions of third-party speakers, presenters or participants.

DAX H4 | Swing-high resistance overheadThe DAX (GER30) is rising towards a swing-high resistance and could potentially reverse off this level to drop lower.
Sell entry is at 21,467.75 which is a swing-high resistance.
Stop loss is at 22,100.00 which is a level that sits above a pullback resistance.
Take profit is at 20,318.67 which is an overlap support that aligns close to the 61.8% Fibonacci retracement.
High Risk Investment Warning
Trading Forex/CFDs on margin carries a high level of risk and may not be suitable for all investors. Leverage can work against you.
Stratos Markets Limited (tradu.com):
CFDs are complex instruments and come with a high risk of losing money rapidly due to leverage. 63% of retail investor accounts lose money when trading CFDs with this provider. You should consider whether you understand how CFDs work and whether you can afford to take the high risk of losing your money.
Stratos Europe Ltd (tradu.com):
CFDs are complex instruments and come with a high risk of losing money rapidly due to leverage. 63% of retail investor accounts lose money when trading CFDs with this provider. You should consider whether you understand how CFDs work and whether you can afford to take the high risk of losing your money.
Stratos Global LLC (tradu.com):
Losses can exceed deposits.
Please be advised that the information presented on TradingView is provided to Tradu (‘Company’, ‘we’) by a third-party provider (‘TFA Global Pte Ltd’). Please be reminded that you are solely responsible for the trading decisions on your account. There is a very high degree of risk involved in trading. Any information and/or content is intended entirely for research, educational and informational purposes only and does not constitute investment or consultation advice or investment strategy. The information is not tailored to the investment needs of any specific person and therefore does not involve a consideration of any of the investment objectives, financial situation or needs of any viewer that may receive it. Kindly also note that past performance is not a reliable indicator of future results. Actual results may differ materially from those anticipated in forward-looking or past performance statements. We assume no liability as to the accuracy or completeness of any of the information and/or content provided herein and the Company cannot be held responsible for any omission, mistake nor for any loss or damage including without limitation to any loss of profit which may arise from reliance on any information supplied by TFA Global Pte Ltd.
The speaker(s) is neither an employee, agent nor representative of Tradu and is therefore acting independently. The opinions given are their own, constitute general market commentary, and do not constitute the opinion or advice of Tradu or any form of personal or investment advice. Tradu neither endorses nor guarantees offerings of third-party speakers, nor is Tradu responsible for the content, veracity or opinions of third-party speakers, presenters or participants.

DAX: Next Move Is Up! Long!
My dear friends,
Today we will analyse DAX together☺️
The price is near a wide key level
and the pair is approaching a significant decision level of 20.353.80 Therefore, a strong bullish reaction here could determine the next move up.We will watch for a confirmation candle, and then target the next key level of 21.097.51.Recommend Stop-loss is beyond the current level.
❤️Sending you lots of Love and Hugs❤️

DAX: Next Move Is Down! Short!
My dear friends,
Today we will analyse DAX together☺️
The recent price action suggests a shift in mid-term momentum. A break below the current local range around 20,299.80 will confirm the new direction downwards with the target being the next key level of 19,659.04.and a reconvened placement of a stop-loss beyond the range.
❤️Sending you lots of Love and Hugs❤️

DAX Shows Upward Reaction from Key Support ZoneThe DAX is feeling the effects of a "Black Monday" scenario early on. The blue trendline that began in August was broken on Friday, and now the longer-term trend that started in October 2023 is being tested. This trendline, along with the major support zone just below it, could act as a potential turning point before a deeper selloff.
If the 18,800–18,920 zone holds, this pullback might turn into a solid buying opportunity. However, there is a clear reason behind the panic selling, and that concern still remains. If fear escalates into full-blown panic and the 18,800–18,920 support zone is broken (not just a bear trap or a temporary downward spike), the rout is likely to continue through the rest of the week.

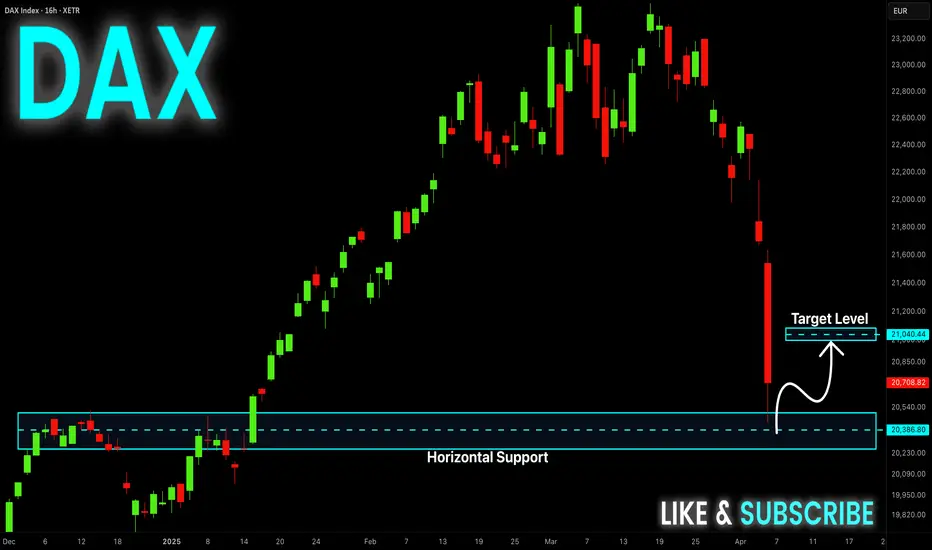
DAX Is Oversold! Buy!
Hello,Traders!
DAX fell down sharply
But will soon hit a
Horizontal support level
Of 20,230 and after the
Retest we will be expecting
A strong bullish rebound
Buy!
Comment and subscribe to help us grow!
Check out other forecasts below too!
Disclosure: I am part of Trade Nation's Influencer program and receive a monthly fee for using their TradingView charts in my analysis.
DAX RISKY LONG|
✅DAX is going down to retest
A horizontal support of 20,400
Which makes me locally bullish biased
And I think that we will see a rebound
And a move up from the level
Towards the target above at 20,800
LONG🚀
✅Like and subscribe to never miss a new idea!✅
Disclosure: I am part of Trade Nation's Influencer program and receive a monthly fee for using their TradingView charts in my analysis.

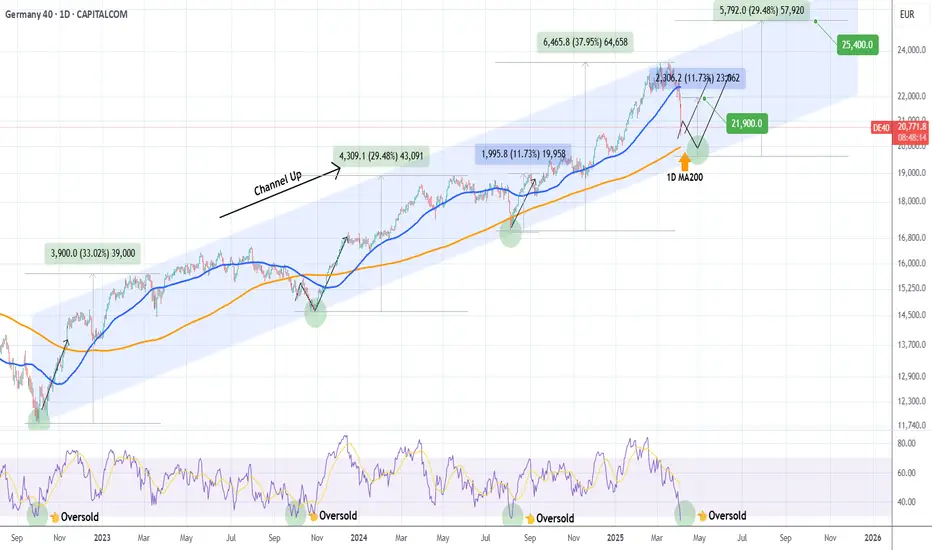
DAX Ultimate buy signal on the 1D MA200 approaching.DAX is having a brutal sell-off, which wasn't technically unexpected as the index made a Higher High on March 06 at the top of its 2.5-year Channel Up. The 1D RSI is already oversold (below 30.00), which is the initial long-term buy signal. Out of the last 3 times the 1D RSI was oversold only on September 26 2023 it extended the downtrend. The other 2 times, it was an immediate buy signal.
The ultimate buy signal, if you want to wait for it, was last time (August 05 2024 Low) when the 1D MA200 (orange trend-line) broke. The minimum rally DAX had following such a bottom was +11.73%, which gives us a short-term Target of 21900 and the maximum (but still the bad case scenario of the 3 Bullish Legs) +29.48%, which gives a long-term Target of 25400.
-------------------------------------------------------------------------------
** Please LIKE 👍, FOLLOW ✅, SHARE 🙌 and COMMENT ✍ if you enjoy this idea! Also share your ideas and charts in the comments section below! This is best way to keep it relevant, support us, keep the content here free and allow the idea to reach as many people as possible. **
-------------------------------------------------------------------------------
💸💸💸💸💸💸
👇 👇 👇 👇 👇 👇
DAX short ideaPTs 20k and 18.7k.
I’m more oriented to the downside once the short term lone has been breached, with a 15% potential drop to test the major trend lines and the 200 day SMA.

DAX H4 | Downtrend to extend further?DAX (GER30) is rising towards a pullback resistance and could potentially reverse off this level to drop lower.
Sell entry is at 22,277.36 which is a pullback resistance that aligns with the 50.0% Fibonacci retracement.
Stop loss is at 22,640.00 which is a level that sits above an overlap resistance.
Take profit is at 21,746.73 which is a swing-low support that aligns close to the 78.6% Fibonacci projection.
High Risk Investment Warning
Trading Forex/CFDs on margin carries a high level of risk and may not be suitable for all investors. Leverage can work against you.
Stratos Markets Limited (www.fxcm.com):
CFDs are complex instruments and come with a high risk of losing money rapidly due to leverage. 63% of retail investor accounts lose money when trading CFDs with this provider. You should consider whether you understand how CFDs work and whether you can afford to take the high risk of losing your money.
Stratos Europe Ltd (www.fxcm.com):
CFDs are complex instruments and come with a high risk of losing money rapidly due to leverage. 63% of retail investor accounts lose money when trading CFDs with this provider. You should consider whether you understand how CFDs work and whether you can afford to take the high risk of losing your money.
Stratos Trading Pty. Limited (www.fxcm.com):
Trading FX/CFDs carries significant risks. FXCM AU (AFSL 309763), please read the Financial Services Guide, Product Disclosure Statement, Target Market Determination and Terms of Business at www.fxcm.com
Stratos Global LLC (www.fxcm.com):
Losses can exceed deposits.
Please be advised that the information presented on TradingView is provided to FXCM (‘Company’, ‘we’) by a third-party provider (‘TFA Global Pte Ltd’). Please be reminded that you are solely responsible for the trading decisions on your account. There is a very high degree of risk involved in trading. Any information and/or content is intended entirely for research, educational and informational purposes only and does not constitute investment or consultation advice or investment strategy. The information is not tailored to the investment needs of any specific person and therefore does not involve a consideration of any of the investment objectives, financial situation or needs of any viewer that may receive it. Kindly also note that past performance is not a reliable indicator of future results. Actual results may differ materially from those anticipated in forward-looking or past performance statements. We assume no liability as to the accuracy or completeness of any of the information and/or content provided herein and the Company cannot be held responsible for any omission, mistake nor for any loss or damage including without limitation to any loss of profit which may arise from reliance on any information supplied by TFA Global Pte Ltd.
The speaker(s) is neither an employee, agent nor representative of FXCM and is therefore acting independently. The opinions given are their own, constitute general market commentary, and do not constitute the opinion or advice of FXCM or any form of personal or investment advice. FXCM neither endorses nor guarantees offerings of third-party speakers, nor is FXCM responsible for the content, veracity or opinions of third-party speakers, presenters or participants.

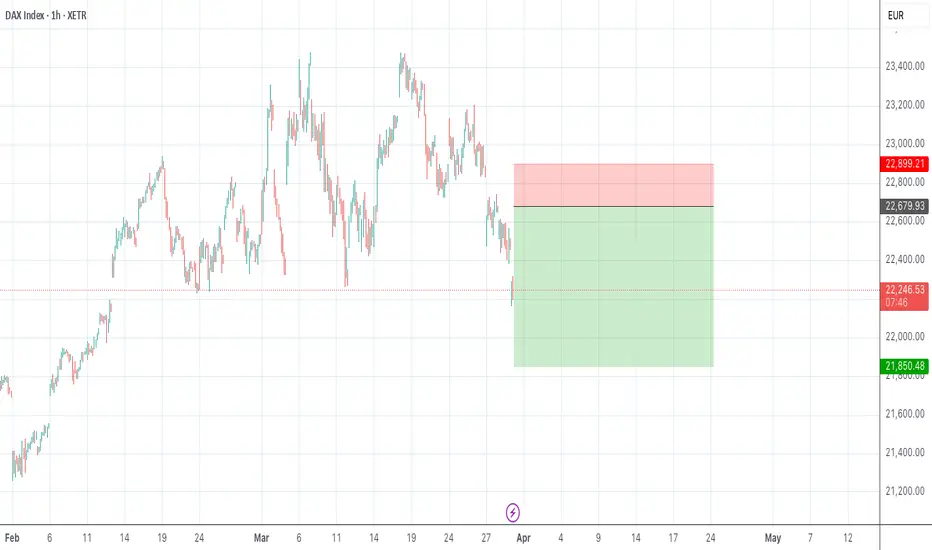
Quarter Ends, Setup Begins: Long from DAX Support ZoneDAX returned to its major support zone around 22,000 after an extended decline through March. I’ve been triggered into a long position as we step into a fresh month and quarter. We’re sitting at strong historical demand with multiple macro events lined up this week—I’ll take what the market gives and manage it accordingly. No ego here, just flow with the setup. Let’s see where this one heads as NFP and PMI data come in.
Technicals
• Timeframe: 1H
• Entry Zone: Strong support retest at 22,000
• Setup: Long triggered on reaction from major support
• Target: Zone around 22,950
• SL: Below the support zone (~21,800)
• Fibcloud: Still trending below, watching for reclaim
• End-of-month rebalancing and Quarter close may add volatility.
Fundamentals
• DAX dropped nearly 2% on Monday, hitting its lowest levels since Feb 10, in line with global market weakness.
• US trade tariff uncertainty under Trump’s “reciprocal” rhetoric weighs on sentiment.
• Germany’s CPI eased to 2.2%, the lowest since Nov 2024, aligning with market expectations.
• Q1 performance remains strong overall, up nearly 11%, supported by Germany’s spending plan.
• Eyes on this week’s NFP and PMI data which could drive further price action.
Note: Please remember to adjust this trade idea according to your individual trading conditions, including position size, broker-specific price variations, and any relevant external factors. Every trader’s situation is unique, so it’s crucial to tailor your approach to your own risk tolerance and market environment.

DAX Bullish ReversalDAX Index (GER30) Trade Setup – 1H Chart Analysis
The DAX Index (GER30) is showing signs of a potential bullish reversal from a key support zone. The price has reacted at 21,975.87, indicating a possible upward move. A retracement to the **62% Fibonacci level (22,534.21) presents an optimal buy entry with a well-defined risk-to-reward ratio.
Trade Details:
- **Entry:** **22,534.21** (62% Fibonacci retracement)
- **Stop Loss (SL):** **21,975.87** (Below the recent swing low)
- **Take Profit Targets:**
- **TP1:** **23,476.14** (0% Fibonacci level)
- **TP2:** **24,056.53** (38.2% Fibonacci level)
- **TP3:** **24,995.45** (100% Fibonacci extension)
Analysis & Justification:
✔ Key Support Confirmation** – The price bounced off **21,975.87**, a significant support level.
✔ Fibonacci Confluence** – The 62% retracement level aligns with historical reaction zones.
✔ Moving Average Resistance** – A breakout above **22,600** could confirm bullish momentum.
✔ Risk-to-Reward Ratio** – The trade offers a **minimum 1.7:1 ratio**, improving with higher TP levels.

Oversold RSI vs. bearish wave count The market shows strong bearish dominance with price (22,207.79) below all key moving averages (EMA200: 22,743.51).
3 Bearish Confirmations:
ADX 35.85 + -DI (36.59) > +DI (11.27) = strong downtrend
RSI 28.53 shows oversold but no reversal momentum
MACD (-139.49) remains below signal line (-116.26)
Price struggles below Camarilla pivot (22,680.36) with immediate resistance at 22,534.35 (R1)
Multiple POTENTIAL downward patterns identified (Flat/Downward Candidates & Diagonal Structures)
Recent wave structures suggest Wave 3 extension in progress below 22,207
Contradiction: Oversold RSI vs. bearish wave count suggests possible relief rally before continuation
Action: SELL LIMIT
Entry Zone: 22,680-22,800 (61.8% Fib of recent swing high)
TP1: 22,156 (S1) | TP2: 21,853 (S2 Classic)
Stop-Loss: 22,900 (above EMA200)
Risk/Reward: 1:3.5 to TP2
Position Size: Risk 1% capital (220 pips risk)
Investor Summary
High-risk buying opportunity only if:
Daily close > EMA200 (22,743)
MACD bullish crossover
RSI sustains > 45
Accumulation zone: 21,800-22,200 with tight stops
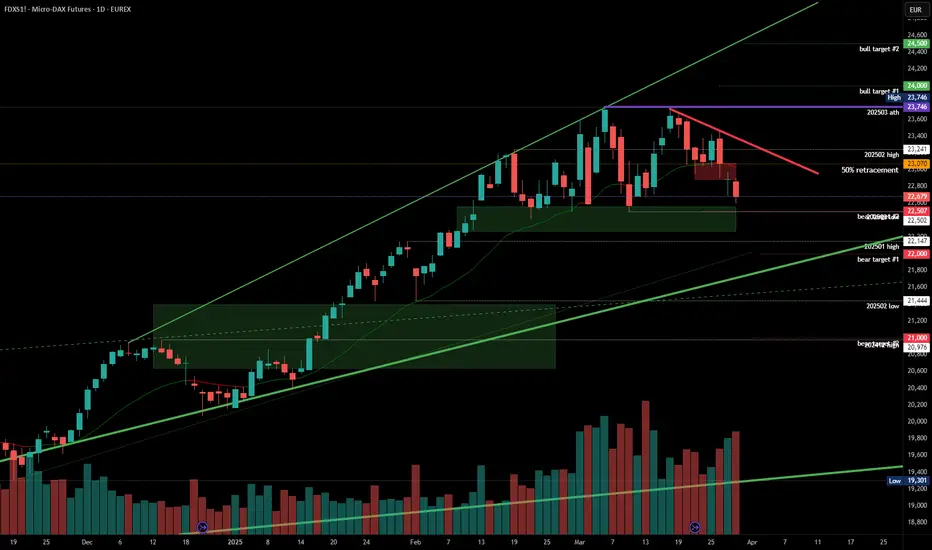
#202513 - priceactiontds - weekly update - dax futures
Good Evening and I hope you are well.
comment: First 3 trading days of the week bulls tried to break above and failed at every higher high, printing an expanding triangle, which broke to the downside on Thursday. Outlook is tough. I want to lean bearish but there is still bigger buying coming through at new lows and betting on the bear breakout is just not a good trade.
current market cycle: trading range - bull trend line is broken and market has failed to make new highs 2 times on the daily chart.
key levels: 22000 - 23746
bull case: Bulls see it as a trading range at the highs and want to continue sideways until the next impulse could bring them higher again. They prevented the market from making lower lows, which is the only objective now. Once market makes new lows below 22400, the bulls know that the next support is likely the trend line around 22000, which is also the open gap close. I don’t have much else for the bulls. Narrative wise it should have made higher highs already and technically this market has turned neutral again.
Invalidation is below 22400.
bear case: Bears have plenty of arguments now to make lower lows and test down to 22000. If they fail again at a lower low, bears have to give up and let bulls take control again. We have a big open bear gap between 22900 and 23078. Bears have to keep this open and stay below the 4h 20ema if they want lower lows. They can even argue an ugly head & shoulders top and the measured move down would bring us to exactly 21000. If bulls would have been stronger, we would have made higher highs by now. We have seen enough strong rejections above 23000, volume has picked up significantly and US markets are falling like dead fish. Now or never for bears or we go higher.
Invalidation is above 23000.
short term: Neutral but bear at heart. I just won’t bet on the breakout but rather want to see it happen and only join after a retest broke down again. Previous support is too big to ignore and bears have not done enough for me to be more confident about them. Below 22500 the odds go up significantly for the bears and bulls need to recover 22900+ for more upside or at least going sideways instead of down.
medium-long term from 2024-03-16: Germany takes on huge amount of new debt. Dax is rallying hard and broke above multi-year bull trends. This buying is as real as it gets, as unlikely as it is. Market is as expensive as it was during the .com bubble but here we are and marking is pointing up. Clear bull channel and until it’s broken, I can not pound my chest and scream for lower prices. Price is truth. Is the selling around 23000 strong enough that we could form a top? Yes. We have wild 1000 point swings in both directions. Look at the weekly chart. Last time we had this volatility was 2024-07 and volume then was still much lower. We are seeing a shift from US equities to European ones and until market closes consecutive daily bars below 22000, we can’t expecting anything but sideways to up movement.
current swing trade: Will join the bears below 22500 on good momentum for 22000 or lower.
chart update: Bull trend line is gone and added bear gap
Ger30Forecast:
Ger30 is looking bearish. Looking at the 1d, and 4d. I can say the is a possible bearish trend built up.
Technically the is 1d double top, 4h break of bullish trend. Current 4h bearish candlestick, and moving average confluence.

#dax Forex Signal German index #dax says I am rising in the medium term in technical indicators. 30% increase is normal. It is necessary to take a position for a decrease when the blue line at the top, which is our technical resistance, turns.
If you want to be in action at the right place and at the right time, you can follow me.
I can draw it for you. Please write me privately.
NOTE: IT DOES NOT CONTAIN INVESTMENT ADVICE. EVERYONE IS FREE TO BUY AND SELL THE SHARES THEY WANT FROM THEIR PERSONAL ACCOUNT WITH THEIR OWN FREE WILL. NO ONE CAN GUIDE ANYONE OR PROVIDE SHARES THAT WILL PROVIDE 100% GUARANTEED PROFIT.
I can draw it for you. Please write me privately.

Trade Idea: DAX 40 (15m Chart)Trade Idea: DAX 40 (15m Chart)
Price is currently retracing towards a higher timeframe Fair Value Gap (FVG) zone. This area aligns with previous supply and offers a high-probability short setup. Once price enters this FVG, watch for bearish confirmation such as a rejection candle or a shift in market structure on lower timeframes.

#DAX - 27 MarSimilar to SPX, DAX looks even more bearish based on price action.
IMO, as long as PZ holds, expect further downside.

#DAX - 26 MarI called a good bottom yesterday and an almost 400 points up move.
Price is pulling back now. Looking at 23010-30 to hold for a move higher.
