DAX Weekly Forecast 30 Jan - 3 Feb 2023 DAX Weekly Forecast 30 Jan - 3 Feb 2023
Based on the data from VDAX we can see that currently the IV for this week is at 18.97%, equal to last week.
This can be translated in +/- 2.63% weekly movement from the open of the candle, which makes the next top/bot channel
TOP: 15466
BOT: 14673
The probability to break this channel(aka the close of the weekly is going to end up either above/below this channel) is at
79% with the last 20 years of data
89% with data since 2022
From the technical rating analysis point of view we can deduct the next information:
Currently there is a :
73% to touch the previous weekly high
26% to touch the previous weekly low
At the same time if we are going to take a look at the moving average rating for different timeframes we can see :
4H Timeframe: -13% Bearish Trend
D Timeframe: +66% Bullish Trend
W Timeframe: +80% Bullish Trend
Lastly on average, based on the current percentile, we can expect that our asset is going to move:
1.87% from the open to the close candle for the bullish scenario
2.37% from the open to the close candle for the bearish scenario
Dax30

DAX's bullish momentum continues to stall.GER40 - Intraday - We look to Sell at 15163 (stop at 15253)
We are trading at overbought extremes.
Trend line resistance is located at 15170.
Bespoke resistance is located at 15150.
Although the bulls are in control, the stalling positive momentum indicates a turnaround is possible.
Our profit targets will be 14943 and 14903
Resistance: 15150 / 15221 / 15272
Support: 15066 / 15000 / 14950
Risk Disclaimer
The trade ideas beyond this page are for informational purposes only and do not constitute investment advice or a solicitation to trade. This information is provided by Signal Centre, a third-party unaffiliated with OANDA, and is intended for general circulation only. OANDA does not guarantee the accuracy of this information and assumes no responsibilities for the information provided by the third party. The information does not take into account the specific investment objectives, financial situation, or particular needs of any particular person. You should take into account your specific investment objectives, financial situation, and particular needs before making a commitment to trade, including seeking advice from an independent financial adviser regarding the suitability of the investment, under a separate engagement, as you deem fit.
You accept that you assume all risks in independently viewing the contents and selecting a chosen strategy.
Where the research is distributed in Singapore to a person who is not an Accredited Investor, Expert Investor or an Institutional Investor, Oanda Asia Pacific Pte Ltd (“OAP“) accepts legal responsibility for the contents of the report to such persons only to the extent required by law. Singapore customers should contact OAP at 6579 8289 for matters arising from, or in connection with, the information/research distributed.

DAX30 - BULL MARKET not over / Unfolding a wave 4It's just a beautiful unfolding in terms of Elliott waves as we can clearly see a very distinct wave 1 and wave 3.
I'm expecting a SHARP SELLOFF next week and a run into this VOLUME IMBALANCE and PRICE IMBALANCE (Fair Value Gap)

DAX vx SP500: Is DAX highly over valued?By comparing the charts of US indexes vs European indexes we usuallly find pretty much the same patterns.
However there is something that really caught my attention, compare the monthly chart of sp500 vs Dax:
DAX is only 6,54% from all time highs of 2022
SP500 is 15,40% from its all time highs of 2022.
NASDAQ is 28,45% from it's all time highs of 2022
This difference is obviously linked to the different policies of central banks, however I wonder if such a huge difference is justified.
German economy has been highly struck by energy prices and German inflation is still 8,5% vs 6,5% in the US.


DAX to stall at highs.GER40 - Intraday - We look to Sell at 15258 (stop at 15348)
We are trading at overbought extremes.
Although the bulls are in control, the stalling positive momentum indicates a turnaround is possible.
We look for a temporary move higher.
A lower correction is expected.
Our profit targets will be 15038 and 14988
Resistance: 15130 / 15200 / 15272
Support: 15030 / 14950 / 14900
Risk Disclaimer
The trade ideas beyond this page are for informational purposes only and do not constitute investment advice or a solicitation to trade. This information is provided by Signal Centre, a third-party unaffiliated with OANDA, and is intended for general circulation only. OANDA does not guarantee the accuracy of this information and assumes no responsibilities for the information provided by the third party. The information does not take into account the specific investment objectives, financial situation, or particular needs of any particular person. You should take into account your specific investment objectives, financial situation, and particular needs before making a commitment to trade, including seeking advice from an independent financial adviser regarding the suitability of the investment, under a separate engagement, as you deem fit.
You accept that you assume all risks in independently viewing the contents and selecting a chosen strategy.
Where the research is distributed in Singapore to a person who is not an Accredited Investor, Expert Investor or an Institutional Investor, Oanda Asia Pacific Pte Ltd (“OAP“) accepts legal responsibility for the contents of the report to such persons only to the extent required by law. Singapore customers should contact OAP at 6579 8289 for matters arising from, or in connection with, the information/research distributed.

DAX to extend losses again?GER40 - Intraday - We look to Sell a break of 14897 (stop at 14986)
Short term momentum is bearish.
A break of resistance at 14900 should lead to a more aggressive move higher towards 14800.
We look for losses to be extended today.
We are trading at overbought extremes.
Our profit targets will be 14681 and 14651
Resistance: 15050 / 15130 / 15200
Support: 14900 / 14800 / 14700
Risk Disclaimer
The trade ideas beyond this page are for informational purposes only and do not constitute investment advice or a solicitation to trade. This information is provided by Signal Centre, a third-party unaffiliated with OANDA, and is intended for general circulation only. OANDA does not guarantee the accuracy of this information and assumes no responsibilities for the information provided by the third party. The information does not take into account the specific investment objectives, financial situation, or particular needs of any particular person. You should take into account your specific investment objectives, financial situation, and particular needs before making a commitment to trade, including seeking advice from an independent financial adviser regarding the suitability of the investment, under a separate engagement, as you deem fit.
You accept that you assume all risks in independently viewing the contents and selecting a chosen strategy.
Where the research is distributed in Singapore to a person who is not an Accredited Investor, Expert Investor or an Institutional Investor, Oanda Asia Pacific Pte Ltd (“OAP“) accepts legal responsibility for the contents of the report to such persons only to the extent required by law. Singapore customers should contact OAP at 6579 8289 for matters arising from, or in connection with, the information/research distributed.

Porsche ( $P911 ) Short ideaOne of the iPOs that I've tracking, and following a standard pattern. Together with a short term (or likely more) top in EU indices, we should see this go much lower after the initial move liquidating early shorters and now FOMO buyers. Red line is stop loss, Green lines are TP1 and 2, respectively. GL

Has DAX found it's swing high?GER40 - Intraday - We look to Sell a break of 15029 (stop at 15119)
We are trading at overbought extremes.
A higher correction is expected.
Although the bulls are in control, the stalling positive momentum indicates a turnaround is possible.
Bearish divergence can be seen on the daily chart (the chart makes a higher high while the oscillator makes a lower high), often a signal of exhausted bullish momentum, or at least a correction lower.
A break of the recent low at 15037 should result in a further move lower.
Our profit targets will be 14809 and 14759
Resistance: 15150 / 15200 / 15300
Support: 15100 / 15040 / 14950
Risk Disclaimer
The trade ideas beyond this page are for informational purposes only and do not constitute investment advice or a solicitation to trade. This information is provided by Signal Centre, a third-party unaffiliated with OANDA, and is intended for general circulation only. OANDA does not guarantee the accuracy of this information and assumes no responsibilities for the information provided by the third party. The information does not take into account the specific investment objectives, financial situation, or particular needs of any particular person. You should take into account your specific investment objectives, financial situation, and particular needs before making a commitment to trade, including seeking advice from an independent financial adviser regarding the suitability of the investment, under a separate engagement, as you deem fit.
You accept that you assume all risks in independently viewing the contents and selecting a chosen strategy.
Where the research is distributed in Singapore to a person who is not an Accredited Investor, Expert Investor or an Institutional Investor, Oanda Asia Pacific Pte Ltd (“OAP“) accepts legal responsibility for the contents of the report to such persons only to the extent required by law. Singapore customers should contact OAP at 6579 8289 for matters arising from, or in connection with, the information/research distributed.

DE30 reached 46-week high.GER40 - Intraday - We look to Buy at 15041 (stop at 14961)
Traded to the highest level in 46 weeks.
We are trading at overbought extremes.
A lower correction is expected.
20 4 hour EMA is at 15035.
We look to buy dips.
Our profit targets will be 15241 and 15281
Resistance: 15200 / 15300 / 15400
Support: 15050 / 14950 / 14900
Risk Disclaimer
The trade ideas beyond this page are for informational purposes only and do not constitute investment advice or a solicitation to trade. This information is provided by Signal Centre, a third-party unaffiliated with OANDA, and is intended for general circulation only. OANDA does not guarantee the accuracy of this information and assumes no responsibilities for the information provided by the third party. The information does not take into account the specific investment objectives, financial situation, or particular needs of any particular person. You should take into account your specific investment objectives, financial situation, and particular needs before making a commitment to trade, including seeking advice from an independent financial adviser regarding the suitability of the investment, under a separate engagement, as you deem fit.
You accept that you assume all risks in independently viewing the contents and selecting a chosen strategy.
Where the research is distributed in Singapore to a person who is not an Accredited Investor, Expert Investor or an Institutional Investor, Oanda Asia Pacific Pte Ltd (“OAP“) accepts legal responsibility for the contents of the report to such persons only to the extent required by law. Singapore customers should contact OAP at 6579 8289 for matters arising from, or in connection with, the information/research distributed.

DAX on its way to our first target DAX formed a Massive Falling wedge in 2022.
Remember a Falling Wedge is >1 month... A Pennant is < 1 Month
The 7 >21 >200MA and the RSI is well above 50 showing upside to come.
The target remains at 16,375
HOLD - BULLISH\
The January Effect where investors and institutions are still buying stocks and assets to start the year. They have offset their taxes and are now piling into the markets that they believe will run up.
Hence the global rally.
Also, Inflation seems to have hit its peak for now (with America CPI dropping to 6.5% this week). These are all good factors for a strong economy.

DAX to stall at overbought extremes.GER40 - Intraday - We look to Sell at 15119 (stop at 151201)
We are trading at overbought extremes.
Bearish divergence can be seen on the daily chart (the chart makes a higher high while the oscillator makes a lower high), often a signal of exhausted bullish momentum, or at least a correction lower.
Although the bulls are in control, the stalling positive momentum indicates a turnaround is possible.
Rallies should be capped by yesterday's high.
Our profit targets will be 14909 and 14879
Resistance: 15128 / 15200 / 15300
Support: 15050 / 14950 / 14830
Risk Disclaimer
The trade ideas beyond this page are for informational purposes only and do not constitute investment advice or a solicitation to trade. This information is provided by Signal Centre, a third-party unaffiliated with OANDA, and is intended for general circulation only. OANDA does not guarantee the accuracy of this information and assumes no responsibilities for the information provided by the third party. The information does not take into account the specific investment objectives, financial situation, or particular needs of any particular person. You should take into account your specific investment objectives, financial situation, and particular needs before making a commitment to trade, including seeking advice from an independent financial adviser regarding the suitability of the investment, under a separate engagement, as you deem fit.
You accept that you assume all risks in independently viewing the contents and selecting a chosen strategy.
Where the research is distributed in Singapore to a person who is not an Accredited Investor, Expert Investor or an Institutional Investor, Oanda Asia Pacific Pte Ltd (“OAP“) accepts legal responsibility for the contents of the report to such persons only to the extent required by law. Singapore customers should contact OAP at 6579 8289 for matters arising from, or in connection with, the information/research distributed.

DAX & S&P500 RELATIONSHIP: MACRO / SUPPLY & DEMAND / BOTTOM???DESCRIPTION: In the chart above I have included and brief macro analysis of the DAX a GERMAN equivalent exchange of the S&P500. Aside from the difference in point ratio the DAX and S&P500 have a special relationship in which they mirror one another usually with the DAX following the S&P500. Nevertheless the DAX in this case can be showing us a different perspective in what is in store for the OVERALL MARKET in the near FUTURE.
POINTS:
1. DEVIATION of 1,000 POINTS begins PLACEMENT of SUPPLY & DEMAND POCKETS at YEARS ALL TIME LOW of 12,000 POINTS.
2. Current UPTREND is at RISK of SHARP Incline that is shown by FLOOR OF CURRENT UPTREND CHANNEL.
3. 100 MA (ORANGE MA) is serving as crucial support and agrees with current uptrend along with 45 MA & 200 MA FALLING INTO PLACE .
4. 15,000 POINT RANGE IS OF CRUCIAL IMPORTANCE TO HOLD WITH CONSOLIDATION IN CURRENT DEMAND POCKET.
*IMPORTANT: RSI within an 8 HOUR TIMEFRAME has only been seen at these levels 2 TIMES in the PAST YEAR where we usually have come to see a continuation of bullish momentum for 22.5 days if we go by AVERAGES.
SCENARIO #1: BULLISH scenario would require a continuation of STEEP INCLINE SUPPORT or at the very least a CONSOLIDATION ABOVE 15,000 POINTS.
SCENARIO #2: BEARISH scenario would begin at the moment we lose 15,000 as a SUPPORT & would further continue once STEEP INCLINE TREND IS BROKEN.
FULL CHART LINK : www.tradingview.com
XETR:DAX
SP:SPX

DAX heading into a 44-week high.GER40 - Intraday - We look to Buy at 14702 (stop at 14619)
Our short term bias remains positive.
Prices look to be heading towards a new 44 week high.
A lower correction is expected.
20 4 hour EMA is at 14701.
We look to buy dips.
Our profit targets will be 14898 and 14938
Resistance: 14886 / 15000 / 15100
Support: 14800 / 14700 / 14625
Risk Disclaimer
The trade ideas beyond this page are for informational purposes only and do not constitute investment advice or a solicitation to trade. This information is provided by Signal Centre, a third-party unaffiliated with OANDA, and is intended for general circulation only. OANDA does not guarantee the accuracy of this information and assumes no responsibilities for the information provided by the third party. The information does not take into account the specific investment objectives, financial situation, or particular needs of any particular person. You should take into account your specific investment objectives, financial situation, and particular needs before making a commitment to trade, including seeking advice from an independent financial adviser regarding the suitability of the investment, under a separate engagement, as you deem fit.
You accept that you assume all risks in independently viewing the contents and selecting a chosen strategy.
Where the research is distributed in Singapore to a person who is not an Accredited Investor, Expert Investor or an Institutional Investor, Oanda Asia Pacific Pte Ltd (“OAP“) accepts legal responsibility for the contents of the report to such persons only to the extent required by law. Singapore customers should contact OAP at 6579 8289 for matters arising from, or in connection with, the information/research distributed.

DAX ShortPlenty of divergences on multiple timeframes on DAX. Price throwover a rising wedge into a strong resistance zone, makes this a reasonable trade considering RR. 15k should also be a psychological resistance so SL just above.

DAX reached 40-week high.GER40 - Intraday - We look to Buy at 14505 (stop at 14419)
Our short term bias remains positive.
We look to buy dips.
20 4hour EMA is at 14490.
Traded to the highest level in 40 weeks.
Our profit targets will be 14705 and 14745
Resistance: 14718 / 14750 / 14800
Support: 14600 / 14500 / 14400
Risk Disclaimer
The trade ideas beyond this page are for informational purposes only and do not constitute investment advice or a solicitation to trade. This information is provided by Signal Centre, a third-party unaffiliated with OANDA, and is intended for general circulation only. OANDA does not guarantee the accuracy of this information and assumes no responsibilities for the information provided by the third party. The information does not take into account the specific investment objectives, financial situation, or particular needs of any particular person. You should take into account your specific investment objectives, financial situation, and particular needs before making a commitment to trade, including seeking advice from an independent financial adviser regarding the suitability of the investment, under a separate engagement, as you deem fit.
You accept that you assume all risks in independently viewing the contents and selecting a chosen strategy.
Where the research is distributed in Singapore to a person who is not an Accredited Investor, Expert Investor or an Institutional Investor, Oanda Asia Pacific Pte Ltd (“OAP“) accepts legal responsibility for the contents of the report to such persons only to the extent required by law. Singapore customers should contact OAP at 6579 8289 for matters arising from, or in connection with, the information/research distributed.

DAX Weekly Volatility Analysis 9-13 Jan 2023 DAX Weekly Volatility Analysis 9-13 Jan 2023
We can see that currently the implied volatility for this week is 2.85%
With this in mind, currently from ATR point of view we are located in the 1st percentile.
Based on this, we can expect that the current weekly candles ( from open to close ) are going to between:
*For calculations, I am using the data since 2022*
Bullish: 1.87% movement
Bearish: 2.37% movement
At the same time, with this data, we can make a top/bot channel which is going to contain inside the movement of this asset,
meaning that there is a 17.7% that our close of the weekly candle of this asset is going to be either above/below the next channel:
TOP: 15095
BOT: 14218
Taking into consideration the previous weekly high/low, currently for this candle there is :
73% probability we are going to touch previous weekly high(already done)
26.5% probability we are going to touch previous weekly low
Lastly, from the technical analysis point of view, currently from
Daily timeframe indicates 80% BULLISH trend from the moving averages index
Weekly timeframe indicates 93.33% BULLISH trend from the moving averages index
Monthly timeframe indicates 93.33% BULLISH trend from the moving averages index

Selling DAX into previous highs.GER40 - Intraday - We look to Sell at 14582 (stop at 14677)
We are trading at overbought extremes.
Bespoke resistance is located at 14600.
The hourly chart technicals suggests further upside before the downtrend returns.
Early optimism is likely to lead to gains although extended attempts higher are expected to fail.
Bearish divergence is expected to cap gains.
Our profit targets will be 14357 and 14317
Resistance: 14510 / 14560 / 14600
Support: 14440 / 14400 / 14340
Risk Disclaimer
The trade ideas beyond this page are for informational purposes only and do not constitute investment advice or a solicitation to trade. This information is provided by Signal Centre, a third-party unaffiliated with OANDA, and is intended for general circulation only. OANDA does not guarantee the accuracy of this information and assumes no responsibilities for the information provided by the third party. The information does not take into account the specific investment objectives, financial situation, or particular needs of any particular person. You should take into account your specific investment objectives, financial situation, and particular needs before making a commitment to trade, including seeking advice from an independent financial adviser regarding the suitability of the investment, under a separate engagement, as you deem fit.
You accept that you assume all risks in independently viewing the contents and selecting a chosen strategy.
Where the research is distributed in Singapore to a person who is not an Accredited Investor, Expert Investor or an Institutional Investor, Oanda Asia Pacific Pte Ltd (“OAP“) accepts legal responsibility for the contents of the report to such persons only to the extent required by law. Singapore customers should contact OAP at 6579 8289 for matters arising from, or in connection with, the information/research distributed.

DAX January 2023 Volatility Analysis DAX January 2023 Volatility Analysis
Currently the volatility for DAX is at 6.28%, up from 6.13% last month.
From the volatility current percentile we are located on 57th place, and based on this we can expect the monthly candle to make the next aprox movement:
Bullish : 5.686%
Bearish : 5.885%
With this in mind we have currently 84.1% that the market is going to stay within the next channel
TOP Limit: 14850
BOT Limit: 13135
If we are going to take a look into the previous monthly high and low points, currently there is a :
34.43% to hit the previous monthly high
57.86% to hit the previous monthly low
Lastly from the technical analysis point of view, currently
Weekly Timeframe : 40% of rating moving averages is indicating BULLISH
Monthly Timeframe : 66.67% of rating moving averages is indicating BULLISH

Sell GER30GER30 (DAX) Technical Analysis: Price currently trades within a bearish flag. I’m expecting a little push to the upside to create bearish bat/double top then a heavy drop from there. Strong bearish movement was observed last week, we’re anticipating a continuation this week.

DAX dips continue to attract buyers.GER40 - Intraday - We look to Buy at 13909 (stop at 13829)
Levels below 13850 continue to attract buyers.
Intraday dips continue to attract buyers and there is no clear indication that this sequence for trading is coming to an end.
50 1 day EMA is at 13900.
We look to buy dips.
Our profit targets will be 14109 and 14149
Resistance: 14000 / 14100 / 14160
Support: 13950 / 13900 / 13850
Risk Disclaimer
The trade ideas beyond this page are for informational purposes only and do not constitute investment advice or a solicitation to trade. This information is provided by Signal Centre, a third-party unaffiliated with OANDA, and is intended for general circulation only. OANDA does not guarantee the accuracy of this information and assumes no responsibilities for the information provided by the third party. The information does not take into account the specific investment objectives, financial situation, or particular needs of any particular person. You should take into account your specific investment objectives, financial situation, and particular needs before making a commitment to trade, including seeking advice from an independent financial adviser regarding the suitability of the investment, under a separate engagement, as you deem fit.
You accept that you assume all risks in independently viewing the contents and selecting a chosen strategy.
Where the research is distributed in Singapore to a person who is not an Accredited Investor, Expert Investor or an Institutional Investor, Oanda Asia Pacific Pte Ltd (“OAP“) accepts legal responsibility for the contents of the report to such persons only to the extent required by law. Singapore customers should contact OAP at 6579 8289 for matters arising from, or in connection with, the information/research distributed.

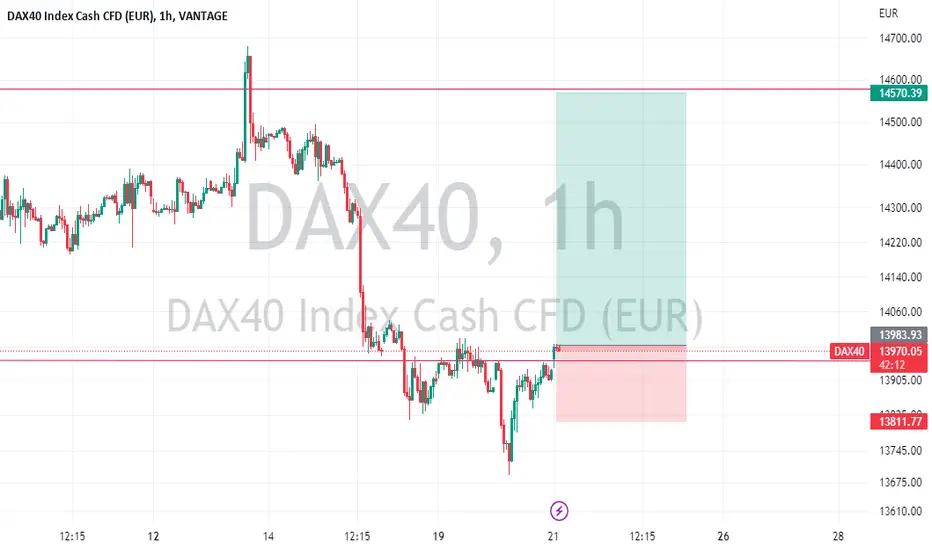
DAX40 TRADE IDEADAX40 has been on a bearish trend for the last three trading days . DAX40 is forming a Bullish trend.