Dax30short

UPDATE: DAX shows its cards, Patience for a BUY setupHi guys, thank you for the support! I will have this analysis out each weekend as well as daily updates throughout the week, if you guys like what I'm doing hit the "follow" button and you will get a notification each time I post a video or chart!
Have a great day everyone!

DAX : Huge downside possible (Elliott Wave)From this current chart which is one of the two counts I have currently (both extremely bearish), it looks like we can see huge down move in DAX.
Wave 2/B which moved up in 3 waves with Wave B (Circled) being a Running Triangle seems to have completed, but even it is still continuing the scenario for DAX (German Index) remains sideways to bearish and hence shorts looks attractive in this market situation.
Stop Loss : Swing High : 13205
Target 1 : 12268
Target 2 : 11859

Dax: >10% downside risk I don't think the Dax can escape the carnage in Southern Europe and a key trend line broken, the Dax is potentially making a lower high (78.6%) and starting on a CD leg to 11,320. Global markets treating us to a World Cup of EM distress.

WEEKEND REVIEW: German DAX looks to be in an ABC, PATIENCE!Hi guys, thank you for the support! I will have this analysis out each weekend as well as daily updates throughout the week, if you guys like what I'm doing hit the "follow" button and you will get a notification each time I post a video or chart!
Have a great day everyone!


back to the short guysas it sems by the daily chart we are heading to a bearish days. first target is ma100 12660 under will see 12300.12000

DAX - Corretive Structure = lower PriceDAX - After an Impulsive Sell Expansion, the broken corrective Structure indicates lower Prices...


DAX possible scenariosShort term bullish scenario that may still be long term bearish... Note that in my opinion an H&S neckline is support until broken... Anyway we might rally to 12950 and then go back down to 11850... and there we will figure out if we break the neckline or we find support once again... But first we have big resistance around 12400

TP 13,141 hit, tested the first support, new pattern emergingAs mentioned on the previous analysis, DAX was on a 1D Channel Up (RSI = 58.600, MACD = 166.500) that hit our 13,141 target and under overbought pressure it broke to the downside and nearly tested the first support at 12,919.58. As seen on today's 1D candle, the Channel Up pattern is technically broken (STOCHRSI = 0, ADX = 53.909, CCI = 48.7206, Highs/Lows = 0) at least marginally. If tomorrow it gaps above 13,050 on opening, then the pattern is still valid. Otherwise after a small rise to 13,028 it should decline and until June 06 even reach the lowest support = 12,747.15. After that point, a strong multi week bullish rebound is expected towards 13,350. So if you don't wish to short this and take a safer approach on the medium term, buy on every support you see with a tight (10 pip) SL.


Are we approaching the end of the QE party ?German DAX seems to be building a H&S top pattern. With the ECB poised to follow the Fed in ending their QE.. Is the party going to end ?
Waiting for a break of the neckline seem to be the more prudent approach. Lets just wait and see.


DaxDax correction is not over for me, if we close under 11800 today. Than we go to around 11500.
It's only my mind. Please trade your own plan and good luck to all.

DAX SHS Pattern And Shor OpportunitySHS Pattern on the Daily chart
Below the Neckline 11.400 will be the first target.
DAX sensing S.O.S


GRXEUR SELL OPPORTUNITY GRXEUR
Hello traders
We have strong supply zone on the chart but now market oversold
we may have correction something like flag patern or more complex
we may go to near demand zone and if price dont break this zone we may sell
sell from demand its a risky trade so you can wait until price break supply zone and then sell
targets on the chart


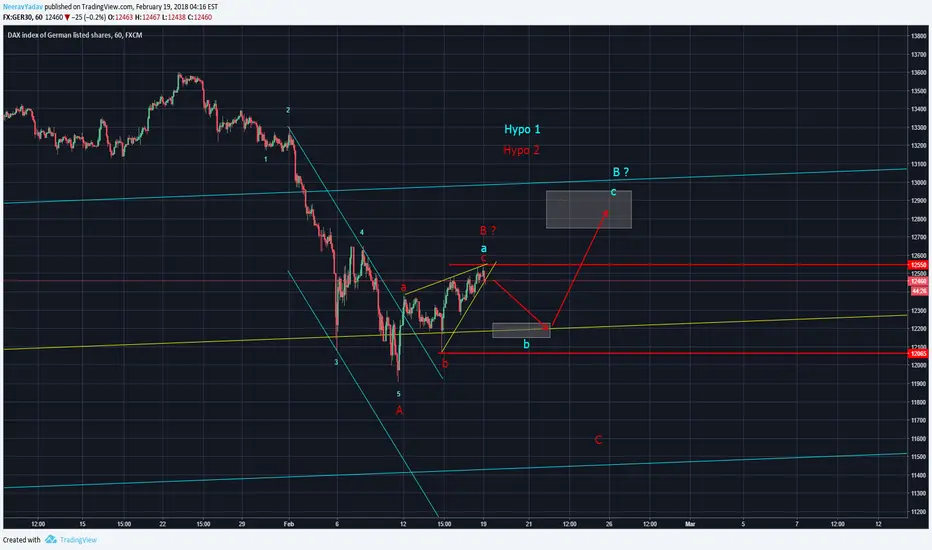
Shorting opportunity in DAX 30 (Elliott Wave Analysis)The Hypo 1 (Cyan) suggests that we have completed the Wave a as a leading diagonal which suggests shorting for downside target of the white box support region.
However if we consider the more bearish Hypo 2 (Red) then we can say that the Wave c of Wave B was an Ending Diagonal and we can see for much lower targets in this case.
Since both the Hypos are pointing to the downside, it provides a very low risk shorting opportunity to us with SL just above the W.a (Cyan) high.

EWG and DAX etfs... short volume analysis FINRA short volume analysis German Big Caps ETFs (DAX and EWG) traded in US markets... Indicators above short volume DAX etf, short volume as percentage of total volume DAX etf, short volume ewg etf, short volume as percentage of total volume ewg etf ...

Dax Time for some correction? I know its difficult too conclude when a correction is ahead. special i a bull market...
I will take the chance :)
The chart analysis is Elliott wave.
there is; Minor and minute
I erased Minuette, because it looked messy on the chart, and difficult to read.
We also see a bearish Divergence i marked it with arrows and text, in the chart and the RSI.
The Divergence indicate an underlying weakness. bulls may be exhausted at this area. A possible trend direction change.
