FDAX1! - Forecast - 18/08/2020 (following 17/08 forecast)SHORT FDAX1!
ENTRY LEVEL 1 @ 12923
SL @ 12990
TP @ 12550 RR5.56
Risk 0.5%
ENTRY LEVEL 2 @ 12948
SL @ 12990
TP @ 12550 RR9.47
Risk 0.5%
ENTRY LEVEL 3 @ 12964
SL @ 12990
TP @ 12550 RR15.92
Risk 0.5%
(SELL ORDER ACTIVE 17/08/2020 :
ENTRY LEVEL 1
ENTRY LEVEL 2)
Daxanalysis

DaxHello traders, here is the analysis from our team :
we like the 12880 be taken out first.
then buy up.
buy up : 12880
tp#1 12883
tp#2 12885
tp#3 12893
stop: 12867
Let us know in the comment section below if you have any questions.😉

FDAX1! - Forecast - 17/08/2020SHORT FDAX1!
ENTRY LEVEL 1 @ 12923
SL @ 12990
TP @ 12550 RR5.56
Risk 0.5%
ENTRY LEVEL 2 @ 12948
SL @ 12990
TP @ 12550 RR9.47
Risk 0.5%
ENTRY LEVEL 3 @ 12964
SL @ 12990
TP @ 12550 RR15.92
Risk 0.5%

UPCOMING DAX BULLISH BREAKOUT TO THE TOPThis might be a good buy. Watch out for it and see if you can validate with your theories.
Yellen,
One Move One Kill

FDAX1! - Forecast - 14/08/2020SHORT FDAX1!
ENTRY LEVEL 1 @ 13150
SL @ 13230
TP @ 12925 RR2.81
Risk 1%
ENTRY LEVEL 2 @ 13185
SL @ 13230
TP @ 12925 RR3.25
Risk 1%
PIVOT @ 12925
BUY FDAX1!
ENTRY LEVEL 1 @ 12925
SL @ 12845
TP @ 13150 RR2.81
Risk 1%

SHORT FDAX1! - Forecast - 13/08/2020SHORT FDAX1!
ENTRY LEVEL 1 @ 13150
SL @ 13230
TP @ 12930 RR2.75
Risk 1%
ENTRY LEVEL 2 @ 13185
SL @ 13230
TP @ 12930 RR3.18
Risk 1%
PIVOT @ 12925
BUY FDAX1!
ENTRY LEVEL 1 @ 12930
SL @ 12850
TP @ 13150 RR2.75
Risk 1%

FDAX1! - Forecast - 11/08/2020BUY FDAX1!
ENTRY LEVEL 1 @ 12680
SL @ 12500
TP1 @ 12990 RR1.72
TP2 @ 13065 RR2.14
TP3 @ 13225 RR3.03
TP4 @ 13305 RR3.47
Risk 1%
ENTRY LEVEL 2 @ 12600
SL @ 12500
TP1 @ 12990 RR3.90
TP2 @ 13065 RR4.65
TP3 @ 13225 RR6.25
TP4 @ 13305 RR7.05
Risk 1%

FDAX1! - Forecast - 12/08/2020SHORT FDAX1!
ENTRY LEVEL 1 @ 12920
SL @ 13000
TP1 @ 12735 RR2.31
TP2 @ 12545 RR4.68
Risk 1%
PIVOT @ 12730
If breakout and retest : ENTRY LEVEL 2 @ 12730
SL @ 12810
TP @ 12545 RR3.90
If not reverse : BUY Level 1 @ 12730
SL @ 12650
TP @ 12920 RR2.37
Risk 1%

DaxHello traders, here is the analysis from our team :
our buy: 12981
our target: 13100
our stop: 12862
Note* We will start to look at 1300 on to take profit with money management.
Let us know in the comment section below if you have any questions.😉
our buy: 12981
our target: 13100
our stop: 12862

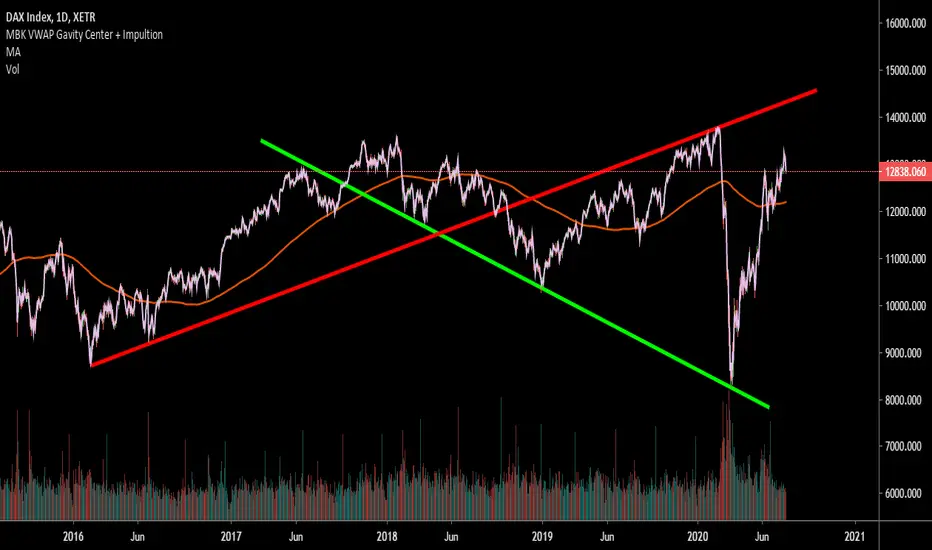
DAX MONTHLY VIEW FOR LONG TERM UPCOMING BUYWhile they have us distracted with the world is falling ideas. Let's keep it basic with Elliot Wave structure identification.
Find end of wave 2 and buy beginning of wave 3!!!
Yellen

DAX(DE30) it gives us good opportunity I expect the bullish trend to start for Dax, but as I drew by using fibonacci circles, we are in the downtrend right now, and the bottom of this channel will support the area I show with the green box, our target will be 13297 when the resistance zone that I marked with the red box is broken.
Please support by liking and do your own ideas as a comment

DAX30 watch the 10,000 Level DAX looks bearish to complete the correction, overall trend is UP, watch the 10,000 level

Dax daily: 27 Jul 2020As expected, Friday's session started with a descend towards the S/R zone at 12 882. Bearish traders pushed even lower and the support didn't hold their strengths. The VPOC has also shifted below this zone and this can signify the lack of commitment for further longs and the end of uptrend of the past days.
Important zones
Resistance: 13 119, 12 882
Support: 12 592
Statistics for today
Detailed statistics in the Statistical Application
Macroeconomic releases
NIL
Today's session hypothesis
Monday sessions are statistically slowest for the German stock index. For today, we don't see otherwise and expect the trading activity to be limited around 12 882 level. Bounce away from 12 882 to the downside can cause a sell-off, but considering the consolidation price action around these levels, we don't expect any wild moves here.

The DAX's in critique point and we must wait for the bake We are in a very important point that can reverse the market,
Please share with me your thoughts,
kind regards,

GOLDEN DAX Take Profits 364 pipsGood day, snipers. Our previous analysis played out well and now we banked 364 pips so far. Take profit was clearly hit! Enjoy the free money.
Follow me on tradingview for more ideas and sniper entries. If you liked this idea please click that thumb's up.
Ideas posted are not financial advise, but merely just to give insights and education for traders.
Past performances do not determine future gains.
As sniper traders, we tread carefully, then we take shots immediately.
GET THE BAG SNIPERS!

Dax daily: 15 Jul 2020Yesterday's price action was a great example of the rational behaviour of the market participants. As we mentioned in our analysis yesterday, the zone around 12 592 was important for establishing further price development, with the break outside signifying the continuation in that particular direction. Dax oscillated the entire European session before gaining momentum in the afternoon and we could target our trades to previous day VPOC. That is exactly what happened and Dax closed the day at the fair value with the biggest amount of orders.
Important zones
Resistance: 12 882
Support: 12 592
Statistics for today
Detailed statistics in the Statistical Application
Macroeconomic releases
NIL
Today's session hypothesis
Dax opened the day with an ascending gap and the first morning impulse attempts to close the gap. Considering the fact we have the resistance of 12 882 in near vicinity, we're now eying a lovely scenario of closing the gap as it correlates with the VPOC of Monday and then targeting the retest of resistance at 12 882 and possibly break higher. There are no fundamental releases scheduled for Dax today, but the optimism on the US stock markets dominates the market sentiment across the board, even despite the negative echoes of the US-China dealings. Consider it's the earning season too. Should the price get above 12 882, there is a lot of space ahead of us to continue our long bias in the short to the mid-term horizon.

Dax daily: 14 Jul 2020Yesterday's session opened with an ascending gap. However, from the beginning of the session, sellers proved their dominance as they pushed the price lower all the way through the support of 12 592. Dax even closed the day below this zone but today's open impulse retraced back above.
Important zones
Resistance: 12 882
Support: 12 592, 12 494
Statistics for today
Detailed statistics in the Statistical Application
Macroeconomic releases
11:00 CEST - German ZEW Economic Sentiment
Today's session hypothesis
For today, we've started with a retracement above 12 592 and we have two options on the table. The first one is that Dax will continue higher to correct yesterday's drop or the price will continue in the impulsive bearish momentum that we've seen last evening. In this case, Dax is likely to drop below the support level of 12 494 and a lot of room would open to target another zone down at 12 278. Mind the ZEW Economic Sentiment release today.

Triangle on DaxTHe question is, which move next. For me more propably is break down, but still need to wait of comfir.

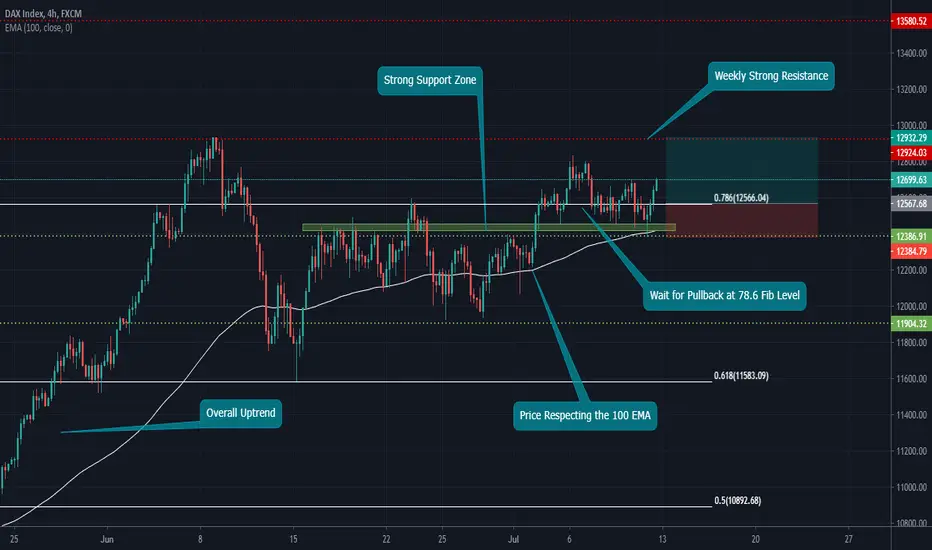
DAX Wait for the Dock at FibGood day, snipers. Here we have the DAX Index where I plan on entering when price hits that 78.6 Fib Level, because entering now would expose you to too much risks and a not so god risk : reward ratio. We can see that price broke through that resistance turned support and is now approaching the weekly strong resistance level. Price also obviously respects the 100 EMA and keeps rejecting and closing above it. Also, we are in an overall uptrend, so I am only looking for long setups in this index.
Follow me on tradingview for more ideas and sniper entries. If you liked this idea please click that thumb's up.
Ideas posted are not financial advise, but merely just to give insights and education for traders.
Past performances do not determine future gains.
As sniper traders, we tread carefully, then we take shots immediately.
Join the discussion down below.
Dax daily: 10 Jul 2020For yesterday, we expected bulls to attempt for higher levels. The morning session was positive in this sense, but then we saw a rapid sell-off, even below 12 494. This is where the support level functioned nicely but the momentum wasn't that strong co correct the down push.
Important zones
Resistance: 12 494, 12 592
Support: 12 151
Statistics for today
Detailed statistics in the Statistical Application
Macroeconomic releases
NIL
Today's session hypothesis
The price opened with a significant descending gap, priced at 12 418. We are now far below 12 494 which changes our lookout from the previous days. As a matter of fact, the drop signifies that bulls are not present in the market or they are not willing to push the price higher under current market circumstances. We now have to re-evaluate the directional bias, based on the signals we spot in the price action. Since Dax opened below the support level, the price can easily continue to lower levels. The zone around 12 278 is the real support area we could target.

Dax - Daily outlook 08.07.2020 - #Dax #Dax30 #GRXEUR1.618 is reached and starting signal of wave 3 of wave 5 came in.
Entry 12.570
SL below today's low of 12,485.
RRR better than 3 to 1.
Greetings from Hannover
Stefan Bode

