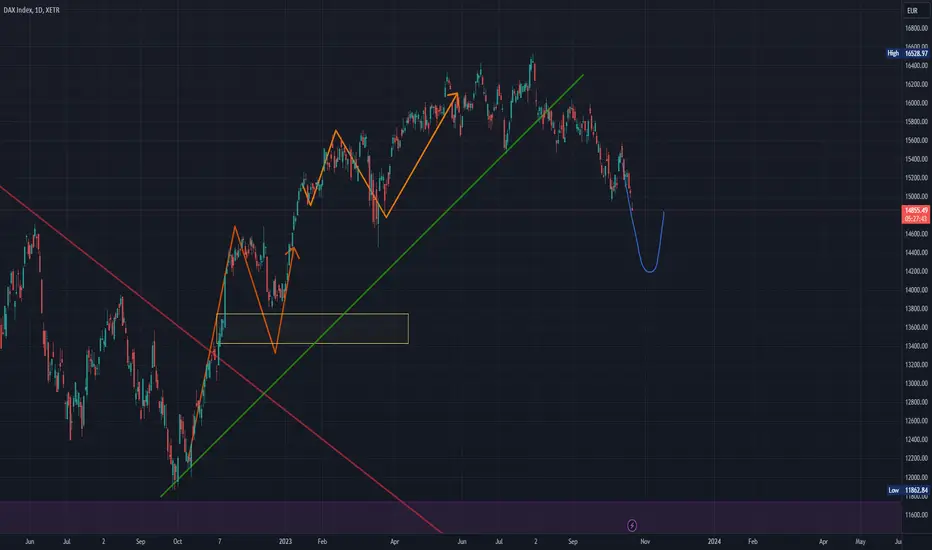
DAX Short Term Sell IdeaH4 - Bearish trend pattern
Currently it looks like a pullback is happening
Until the strong resistance zone holds my short term view remains bearish here.
Daxanalysis

DAX (GER 40).... BULLISH!Price has traded through the Swing High with a strong close above.
Now, price has pulled back into a +FVG.
The Daily +FVG is overlapped by the Weekly +FVG, a strong confluence.
The expectation is for price to continue higher to the next recent swing high.
May profits be upon you.

DAX to find buyers at market price?GER40 - 24h expiry
Price action looks to be forming a bottom.
Although the bears are in control, the stalling negative momentum indicates a turnaround is possible.
The primary trend remains bullish.
50 1day EMA is at 17765.
A Doji style candle has been posted from the base.
The corrective cycle lower looks to have stalled.
We look to Buy at 17830 (stop at 17730)
Our profit targets will be 18080 and 18160
Resistance: 17910 / 18000 / 18100
Support: 17800 / 17713 / 17600
Risk Disclaimer
The trade ideas beyond this page are for informational purposes only and do not constitute investment advice or a solicitation to trade. This information is provided by Signal Centre, a third-party unaffiliated with OANDA, and is intended for general circulation only. OANDA does not guarantee the accuracy of this information and assumes no responsibilities for the information provided by the third party. The information does not take into account the specific investment objectives, financial situation, or particular needs of any particular person. You should take into account your specific investment objectives, financial situation, and particular needs before making a commitment to trade, including seeking advice from an independent financial adviser regarding the suitability of the investment, under a separate engagement, as you deem fit.
You accept that you assume all risks in independently viewing the contents and selecting a chosen strategy.
Where the research is distributed in Singapore to a person who is not an Accredited Investor, Expert Investor or an Institutional Investor, Oanda Asia Pacific Pte Ltd (“OAP“) accepts legal responsibility for the contents of the report to such persons only to the extent required by law. Singapore customers should contact OAP at 6579 8289 for matters arising from, or in connection with, the information/research distributed.

DAX short-term traders need to line up with longer time frameThe DAX daily chart has bullish elements to it, but the hourly traders have not synced up to them yet.
The weekly real yield is in uptrend, which should act as support for the USDOLLAR and as a headwind for the risk markets.
This video is intended for the users of Stratos Markets Limited, Stratos Trading Pty. Limited and Stratos Global LLC, (collectively “FXCM Group”).
Stratos Markets Limited (www.fxcm.com):
CFDs are complex instruments and come with a high risk of losing money rapidly due to leverage. 66% of retail investor accounts lose money when trading CFDs with this provider. You should consider whether you understand how CFDs work and whether you can afford to take the high risk of losing your money.
Stratos Europe Ltd (trading as “FXCM” or “FXCM EU”), previously FXCM EU Ltd (www.fxcm.com):
CFDs are complex instruments and come with a high risk of losing money rapidly due to leverage. 70% of retail investor accounts lose money when trading CFDs with this provider. You should consider whether you understand how CFDs work and whether you can afford to take the high risk of losing your money.
Stratos Trading Pty. Limited (www.fxcm.com):
Trading FX/CFDs carries significant risks. FXCM AU (AFSL 309763). Please read the Financial Services Guide, Product Disclosure Statement, Target Market Determination and Terms of Business at www.fxcm.com
Stratos Global LLC (www.fxcm.com):
Losses can exceed deposits.
Any opinions, news, research, analyses, prices, other information, or links to third-party sites contained on this video are provided on an "as-is" basis, as general market commentary and do not constitute investment advice. The market commentary has not been prepared in accordance with legal requirements designed to promote the independence of investment research, and it is therefore not subject to any prohibition on dealing ahead of dissemination. Although this commentary is not produced by an independent source, FXCM takes all sufficient steps to eliminate or prevent any conflicts of interests arising out of the production and dissemination of this communication. The employees of FXCM commit to acting in the clients' best interests and represent their views without misleading, deceiving, or otherwise impairing the clients' ability to make informed investment decisions. For more information about the FXCM's internal organizational and administrative arrangements for the prevention of conflicts, please refer to the Firms' Managing Conflicts Policy. Please ensure that you read and understand our Full Disclaimer and Liability provision concerning the foregoing Information, which can be accessed via FXCM`s website:
Stratos Markets Limited clients please see: www.fxcm.com
Stratos Europe Ltd clients please see: www.fxcm.com
Stratos Trading Pty. Limited clients please see: www.fxcm.com
Stratos Global LLC clients please see: www.fxcm.com
Past Performance is not an indicator of future results.

DAX to find buyers at market?GER40 - 24h expiry
Price action resulted in a new all-time high at 17817.
There is no clear indication that the upward move is coming to an end.
Price action continues to trade around the all-time highs.
Intraday dips continue to attract buyers and there is no clear indication that this sequence for trading is coming to an end.
We look to buy dips.
20 4hour EMA is at 17684.
We look to Buy at 17700 (stop at 17615)
Our profit targets will be 17920 and 17975
Resistance: 17817 / 17900 / 18000
Support: 17688 / 17600 / 17500
Risk Disclaimer
The trade ideas beyond this page are for informational purposes only and do not constitute investment advice or a solicitation to trade. This information is provided by Signal Centre, a third-party unaffiliated with OANDA, and is intended for general circulation only. OANDA does not guarantee the accuracy of this information and assumes no responsibilities for the information provided by the third party. The information does not take into account the specific investment objectives, financial situation, or particular needs of any particular person. You should take into account your specific investment objectives, financial situation, and particular needs before making a commitment to trade, including seeking advice from an independent financial adviser regarding the suitability of the investment, under a separate engagement, as you deem fit.
You accept that you assume all risks in independently viewing the contents and selecting a chosen strategy.
Where the research is distributed in Singapore to a person who is not an Accredited Investor, Expert Investor or an Institutional Investor, Oanda Asia Pacific Pte Ltd (“OAP“) accepts legal responsibility for the contents of the report to such persons only to the extent required by law. Singapore customers should contact OAP at 6579 8289 for matters arising from, or in connection with, the information/research distributed.

GDAX DAX 40 (German 40) Technical Analysis & Trade IdeaTheres a full video analysis posted before this.
The DAX 40's recent bullish surge reveals signs of exhaustion on the monthly and weekly charts. Lower timeframes suggest a manipulative price structure primed for a potential trend reversal.
Here's the breakdown:
- Overextension: Extended trends often succumb to corrections or shifts in direction. The DAX 40 appears ripe for such a move.
- Liquidity Engineering: The 4-hour and daily price action hints at manipulation. The downside breakout followed by a stop-loss raid indicates possible accumulation to fuel a bearish move.
- Reversal Pattern: This market behavior aligns with recurring reversal setups I've observed consistently throughout my trading experience.
Trade Idea
- Direction: Short (with the potential for significant downside)
- Timeframe: Expect bearish momentum through February and March.
- Monitor: Watch for validation on lower timeframes (e.g., a bearish break of the current range).
- Risk Management: Set appropriate stop-loss levels based on your risk tolerance.
Disclaimer
This analysis is for informational purposes and does not constitute financial advice. Before making any trades, perform your own in-depth research and exercise prudent risk management.

GDAX DAX 40 (German 40) Technical Analysis & Trade IdeaGDAX DAX 40 (German 40) Technical Analysis & Trade Idea
The DAX 40's recent bullish surge reveals signs of exhaustion on the monthly and weekly charts. Lower timeframes suggest a manipulative price structure primed for a potential trend reversal.
Here's the breakdown:
- Overextension: Extended trends often succumb to corrections or shifts in direction. The DAX 40 appears ripe for such a move.
- Liquidity Engineering: The 4-hour and daily price action hints at manipulation. The downside breakout followed by a stop-loss raid indicates possible accumulation to fuel a bearish move.
- Reversal Pattern: This market behavior aligns with recurring reversal setups I've observed consistently throughout my trading experience.
Trade Idea
- Direction: Short (with the potential for significant downside)
- Timeframe: Expect bearish momentum through February and March.
- Monitor: Watch for validation on lower timeframes (e.g., a bearish break of the current range).
- Risk Management: Set appropriate stop-loss levels based on your risk tolerance.
Disclaimer
This analysis is for informational purposes and does not constitute financial advice. Before making any trades, perform your own in-depth research and exercise prudent risk management.

Dax Jan 31 - Feb 1 UpdateSharing DAX updated from TTR
DAX had a perfect reversal candle, but still needs to confirm below 16855
We got a monthly inside candle close today.
Weekly has more room to the upside, but a double we have a potential double top formation here
We have a clear negative divergence on the daily level!

The DAX could be at (or near) a swing lowIndex futures held their ground overnight, and the US dollar's rally is showing signs of near-term exhaustion. And that indicates a subtle change in sentiment ahead of today's open.
The DAX found support at its 50day EMA on Wednesday, which is just above the 2021 high. Given a small-ranged bullish hammer formed alongside higher volume suggests a 'change in hands' between sellers to buyers, so we're on guard for a bounce.
Bulls could seek to enter within yesterday's range with a stop beneath the 2021 high and initially target gap resistance around 16,490 - a break above which brings 16,600 into focus for bulls.
However, as we suspect the US dollar is set to extend its gains after a pause in its rally and that equities are yet to make a decent retracement, we're anticipating another leg lower towards the support zone just above 16,000.

GER 40 TECHNICAL ANALYSIS 11/12/2023-15/12/2023The Index is currently trading in an uptrend parallel channel, and momentum also indicate that the bulls are still in control of the market, so the interesting thing is are we going to see a pullback to level around 16500.00 level for us to get into the trade or the index will still go up.
A deep pullback to around 16000.00 will still provide good entry levels for one to get into the trade, Will wait and see what is going to happen.

DAX to turn into an uptrend?DE30EUR - 24h expiry
The bullish engulfing candle on the 4 hour chart the positive for sentiment.
Our short term bias remains positive.
The overnight dip has been bought into and there is scope for further bullish pressure going into this morning.
A break of yesterdays high would confirm bullish momentum.
Short term RSI is moving higher.
We look to Buy a break of 15301 (stop at 15201)
Our profit targets will be 15551 and 15601
Resistance: 15291 / 15400 / 15500
Support: 15180 / 15100 / 15068
Risk Disclaimer
The trade ideas beyond this page are for informational purposes only and do not constitute investment advice or a solicitation to trade. This information is provided by Signal Centre, a third-party unaffiliated with OANDA, and is intended for general circulation only. OANDA does not guarantee the accuracy of this information and assumes no responsibilities for the information provided by the third party. The information does not take into account the specific investment objectives, financial situation, or particular needs of any particular person. You should take into account your specific investment objectives, financial situation, and particular needs before making a commitment to trade, including seeking advice from an independent financial adviser regarding the suitability of the investment, under a separate engagement, as you deem fit.
You accept that you assume all risks in independently viewing the contents and selecting a chosen strategy.
Where the research is distributed in Singapore to a person who is not an Accredited Investor, Expert Investor or an Institutional Investor, Oanda Asia Pacific Pte Ltd (“OAP“) accepts legal responsibility for the contents of the report to such persons only to the extent required by law. Singapore customers should contact OAP at 6579 8289 for matters arising from, or in connection with, the information/research distributed.

Dax Short Term Buy IdeaH4 - Bullish convergence.
Currently it looks like a pullback is happening.
No opposite signs.
H1 - Bullish trend pattern.
Currently it looks like a pullback is happening.
Until the strong support zone holds I expect the price to move higher further after pullbacks.

Don't give up on the DAX just yetYes, the DAX is clearly within an established downtrend on the daily chart. And its drawdown from its record high is relatively shallow at just -11.5% by historical standards - meaning we suspect further losses could be coming.
Yet its failure to break beneath the December high and March low has not gone unnoticed. And given it formed a bullish hammer around these key level with a mild bullish RSI divergence, we see the potential for some mean reversion over the near term.
Keep in mind that we have flash PMIs for the US and Europe today along with a speech from ECB President Lagarde, US GDP, PCE inflation and a Jerome Powell speech also in focus this week. And that leaves plenty of room for volatility for global markets.

GER40 / DAX Analysis 23Oct2023GER40 analysis is still in accordance with the analysis a few weeks ago, where prices tend to follow the bearish curve. Still at the same price target, prices tend to move towards the Fibo area of 1,618

DAX UpdateAfter the correct analysis of the chart in the previous post that mentioned the rise of the index.
We are now witnessing a correction in the chart and my prediction is that we will witness further declines.
Follow for notifying more Analysis. Boost, Comment for signal, and more.
GER40 Analysis 13Oct2023In my opinion, GER40 presents a slightly different perspective. If you observe the movement of the wave, you will notice a curve that is currently supporting it. Usually, when such a curve forms, the price tends to follow the same movement. Therefore, I believe that in the medium term, the price is likely to remain bearish.
Furthermore, if you look at the current situation, it is possible that we are in the bearish channel, which would mean that the price will continue to follow this downward trend.

GER30: Thoughts and AnalysisToday's focus: GER30
Pattern – LH - Lower support test
Support – 15,055 - 15,015
Resistance – 15,287 - 15,504
Hi, and thanks for checking out today's analysis. The GER30 daily is today's focus. Due to the tragic events over the weekend, we have seen stock futures trading lower into the new week. The GER30 is testing Friday's firm finish and could be forming a new lower high. The key here will be if sellers can be price back down to test 15,055 - 15,015 support. A break set up a continuation of the med-term downtrend.
If buyers can reject today's selling and break back above Friday's high, this could suggest a new higher leg and a possible test of 15,504.
Good trading.

#DAX to correct----------DAX LONG---------
I went long on DAX German 40 index this morning as I expect a correction from current levels. Not a reversal yet but still a good looking trade this morning.
This is not a financial advice. Do your own research and analysis.

DAX - (massive!) Short; This is a no-brainer!Germany decided to systematically destroy their (and the EU's) economy, in a consistent and spectacular fashion. This is a no-brainer!! (I have been shorting this, with everything I've got, for the past week.) The only thing that kept this thing afloat, so far, is the underlying currency (EUR/USD) push-pull. I believe that is now over and full capitulation is at hand.
Where will this mayhem stop? ... Well, it depends on the maximum pain tolerance of the combined German industrial base.
Will they let their government fully destroy their entire economy or will they put a stop to it, at some point? ... Right now, I don't care!
The damage is already done, the only question remaining; Just how bad?
Sell, sell, sell ... and then, Short some more!

GER40 Analysis 27Aug2023last week the price managed to form a new HH and at the close it looks corrected. the chances are that the price will still have a limited downside before continuing bullish.

DAX Elliott Wave Analysis for Friday 18/08/2023Still two scenarios. The bullish scenario (in green) shows an ending wave 2 down that will be followed by wave 3 up. The bearish scenario (in red) assumes more downside to finish wave C and a higher degree wave (4).

DAX40 Germany40 : Importtant Zone to DefendTrend Bullish
CB’s bank lending survey reveals signs of concern in the credit market
DAX technical levels of interest – prices remain elevated but waning volatility and momentum hint at a propensity for sideways trading to come
A break above 16383 pushes DAX40 to achieve potentially possible 23850
A break below 11950 is the beginning of the Bearish trend(red curve)
Possible retracements at
14750
13870
12835

DAX IF Channel Breaks Then Short!DAX went up He is now approaching a
Horizontal resistance
Of 102.750 while trading
In a rising channel so
IF we see a breakout of
The channel to downside
Then the price will go down
