DAY

TSLA LOOKING TO SHORTTSLA had an amazing last week, but we are seeing dips back to consolidation/support this week. Will be watching the chart to see where it breaks out of the structures triangle


EurGBP Buy for Day traders .Hi All ,
This a setup for non swing traders . If you looking to book profits and move on .
Many Thanks

STOP LOSS TO BREAK EVEN + SOME PROFITNo point letting this trade turn into a looser now. Two lower highs created, so some structure to help create a logical place to move the stop too. Stop will be now at 1.46825. Worry free trade now, let the market go where it wants on this pair now.
Updates to follow.

UA HAS CROSSED BUY Like i anticipated from my previous chart, that UA would be shifting soon. Which it has. Buy while you can.
Check my other chart on UA to see.
Thanks


WTI DAYTRADE OPPURTINITYHello Traders,
Crude Oil does look pretty bearish until $54, and I'd swing LONG for about .50$

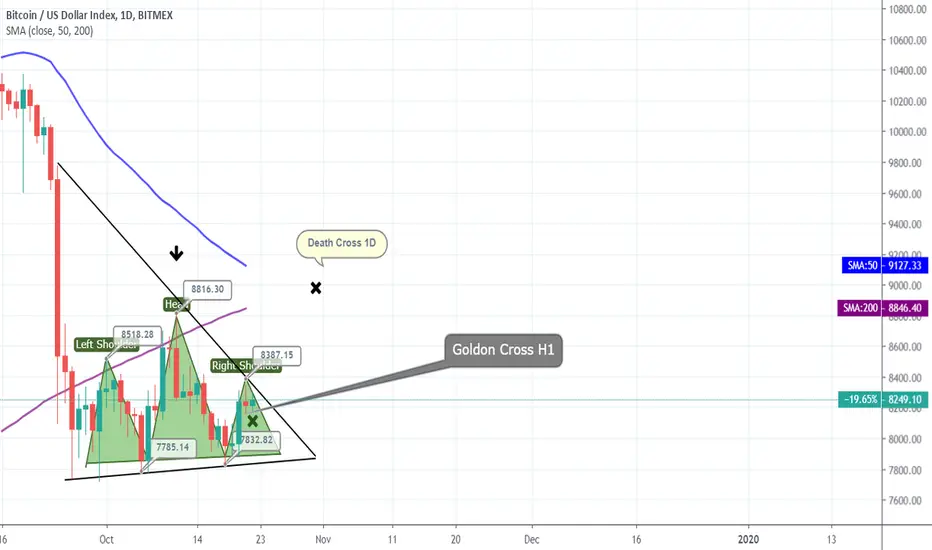
BTC | DeathCross 1D The previous Death Cross in 1 day, the price dropped by about 2500$, will history repeat itself?
no HH(double top)Broke out of mini range, the overall trend is down, looking for a pullback and test then ill sell, daytrade

FX Trading | USDJPY SELLSl: 108.34 | -0.34%
TP 1: 106.88 | +1.01%
TP 2: 105.86 | +0.95%
50% close on target 1 at 106.88
50% close on target 2 at 105.86 with changing the stop loss to break even at the buying price

Crypto Currency | Bitcoin Follow upThe Bitcoin has crossed the level predicted at 10,354 (now 10,388), leaving us with a 9% profit for those who closed their trades at the level 10,354 for roughly around 4-5 days.
The BTC has also crossed the resistance level of the triangle, which indicates a strong breakout, and the market shows a strong Buy momentum, which might indicate a potential of reaching a new high at level 10,800.
Closing 100% of the trade at this level will still be profitable, but maybe for some, a good move is to close 50 of the trade and hold the other 50% with a free risk trade (stop loss at the level where the trade have been bought), where the second take profit target would be at level of 10,800

GOLD, XAUUSD-Day...End of (1st ?) Uptrend ???Uptrended via...
3rd wave (Primary, Black circle) = 261.8% projection of w1.
and ...5th wave = 161.8% projection of w1-w3. + AO-convergence of w3-w5 (green arrow, yellow-slate blue column) and bearish divergence within (red arrow).
Wait and see for open LONG around w(4)....@1400+- USD.


KNOWN CRYPTO CAVE 50 DAY 200 DAY TEST TEST KNOWN CRYPTO CAVE 50 DAY 200 DAY TEST TEST
Just checking to see if this works, haven't don this much before :)


#XRPUSDT Up or Down From Here?- Bullish break of the 200 DAY MA on great volume.
- Currently consolidating nicely above cluster of daily candle closes back in Dec. '18 and April '19
- Possible Bull Flag Formation short to -mid term and ascending triangle pattern.
- Still possibility to Retest 200 Day MA confirm as support if BTC Dumps


GBPUSD BUYGBPUSD has had a large drop and has just bounced off a day support it has reacted to twice recently. On 4hr time frame theres a big bullish candle, on 1 hour time frame theres a support forming for a possible head and shoulders. head and shoulders mar or may not complete but still a buy from this level in my opinion.
Note: I've made a youtube channel that does not yet have any content but at some point in the future i'll be uploading videos about my trading journey and some educational content if you'd like to subscribe now and be the first to see it when i upload. Youtube: Flynnex

TSLA Weekly AnalysisBear breakout of TSLA, but increased and climactic selling last week and gap down this week. Likely a sell vacuum test of the $180 low. The $240 gap above will likely get filled over the next few weeks to months. The bears need a strong breakout below 180 and 140. Otherwise bears will start to take profits and bulls will re-establish long positions. What happens when strong bears and strong bulls buy? The market can only go up. Unless the bears can demonstrate significant strength here, the bulls are more likely to take back control within the coming weeks. Therefore the next few weeks are important for both sides, and will likely determine the direction of the coming months or even years.
