Daytrade


GMT / USDTIN the H2 time frame we are in this pattern. I do trading based on patterns . wait for the confirmation to make in short or long
this is not financial advice
USE STOP LOSS

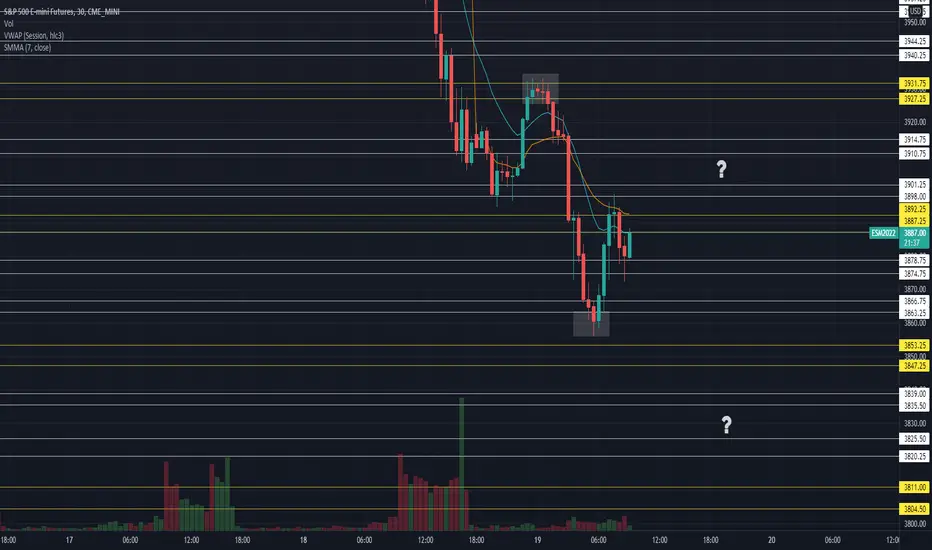
#ES Futures 5.19.22 Overview and Levels to WatchYesterday we had a big sell off, I had it market that we would visit our Key Support at 3976.50-3971.50 and if selling is strong then can see lower levels as well, did not expect to that much but we got what we got. Today we are set to open on a gap down and below T+2 low of Tuesday. Currently inventory is short and we found some buyers before our swing low and Key Support of 3853.25-3847.25, at the open I want to see if we get any correction and maybe try to fill the gap at around 3905 area, if we cant fill the gap and stay above our Key Resistance of 3892.25-3887.25 then on the downside my targets are 3878.75-3874.75, 3866.75-3863.25, Support at 3853.25-3847.25 if that breaks and then we have room to visit lower levels of 3839-3835.50, 3825.50-3820.25 and next support at 3811-3804.50, if the selling is strong as yday I expect us to test the bottom of this daily range we are in since we are currently at half point, those levels would be 3791.50-3787.75, 3780.50-3776.75 and KEY support at 3764.75-3758.25. On the upside holding above Key Support of 3892.25-3887.25 we can see a push to test 3901-3898, 3914.75-3910.75 and next Key Resistance at 3931.75-3927.25. Careful with longs today because we do expect margin call selling, will only be looking for longs if key levels hold and show support, other than that looking to short from Key levels down.
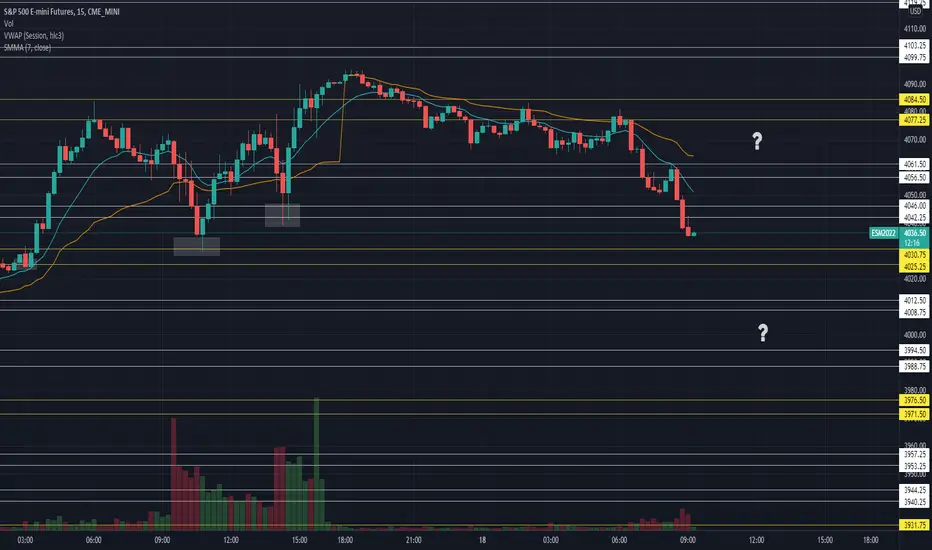
#ES Futures 5.18.22 Overview and Levels to WatchYesterday we found buyers at the levels we expected and were able to close above T+2 for today. Globex session we tried to push to extend into the next range over 4084.50-4077.25 but failed, currently inventory is short and selling off to find buyers. We have broke into and accepted into T+2 so far, if we dont come back out and hold then we can see lower levels get tested down to Half Back, T+2 low and maybe lower depending on sell volume. On the downside we have Key Support at 4030.75-4025.25 if that goes we have 4012.50-4008.75, 3994.50-3988.75 and next Key support at 3976.50-3971.50 if the selling is strong we can expect to look below that, would not buying until I see Key Supports holding. On The upside if we hold our Key Support or look below and fail we have 4046-4042.25, 4061.50-4056.50 Key Resistance at 4084.50-4077.25 which would need to be broken to see anymore upside, considering all the inventory that is now trapped above 4061.50-4056.50 it would take good amount of buying to chew through.
$KNC DAYTRADE (DT) QUICK TRADE i think KNC will take a break to support - 10% with 10x leverage
NOT FINANCIAL ADVICE

Joe Gun2Head Trade - Selling EURUSD into resistanceTrade Idea: Selling EURUSD into resistance
Reasoning: Rallied into resistance and a 38.2% Fibonacci level
Entry Level: 1.0461
Take Profit Level: 1.0354
Stop Loss: 1.0477
Risk/Reward: 6.67:1
Disclaimer – Signal Centre. Please be reminded – you alone are responsible for your trading – both gains and losses. There is a very high degree of risk involved in trading. The technical analysis , like all indicators, strategies, columns, articles and other features accessible on/though this site is for informational purposes only and should not be construed as investment advice by you. Your use of the technical analysis , as would also your use of all mentioned indicators, strategies, columns, articles and all other features, is entirely at your own risk and it is your sole responsibility to evaluate the accuracy, completeness and usefulness (including suitability) of the information. You should assess the risk of any trade with your financial adviser and make your own independent decision(s) regarding any tradable products which may be the subject matter of the technical analysis or any of the said indicators, strategies, columns, articles and all other features.

EUR/JPY (Cypher Pattern) 1HRPAIR: EURJPY
TRADE: CYPHER PATTERN
POSITION: BUY
TIME-FRAME: 1HR
--------------------
What a month it has been for patterns. During the Star
Live Trading room, we've seen pattern formations all over
the markets and have been a result of new equity highs.
For other pattern lovers like myself, this month has been
a powerhouse for these moves.
When I can, I post trade ideas here to inspire other people
about pattern trading, as it's one of my passions.
Let's have a great week of trading ahead. Always, always
always, trade your plan please.
--------------------
Truly grateful to be here and share my thoughts with
everyone. Always appreciate your thoughts and what
you have to say and share, let's experience Trading in
a positive way, together. Time is precious, be kind to
everyone and be safe in the markets, always.
"See yourself as love and only have that, to give away."
--------------------
Phil C.

#ES_F 5.13.22 OverviewYesterday we tested midpoint of the current range we are in on the daily, so far was a look below and fail. End of the day rally buyers were able to bring the price towards the T+2 low for today. All the sellers were taken out lower and in Globex be broke into the T+2 range and over out 3931.75-3927.25 Key Resistance, this morning we hit our next Key Resistance level of 3976.50-4971.50 and T+2 half back. So far it was look above and come back in so at the open will be watching for us to test lower levels down to 3957.25-3953.25, and 394.25-3940.25 where we should start seeing buying response, if we break under that we can test our Key support T+2 low area down to 3931.75-3927.25 but ideally we should see buyers step in before that if we will go higher today. If Key support holds and we can see a trip back over 3976.50-3971.50 and test the upper levels of that value zone, which are 3994.50-3988.75, 4012.50-4008.75 where we should see sellers because there is supply above, if we get through that then can test next Key Resistance of 4030.75-4025.25 and also the T+2 high area. Have to be patience we are in a market with supply, have to let things set up and show the way around important levels and not get caught up in the chop.

Long Tesla $TSLABounced off-key level of support in FIB, RSI is starting to point up, on balance volume is still pointing down, the stock had good news today, MACD hasn't switched over, has unusual call volume. Possibly room up to the 9 SMA.
Disclaimer: Stratford Research newsletters reflect the research and opinions of only the authors who are associated persons of Stratford Consulting Ltd. The newsletters are for informational purposes only and are not a recommendation of an investment strategy or recommendation to buy or sell any security or digital asset (cryptocurrency, etc.) in any account. The information provided within the newsletters is not intended to serve as the basis for any investment decision and is for entertainment purposes only. Any third-party information provided therein does not reflect the views of Stratford Consulting Ltd. or any of its subsidiaries or affiliates. All investments involve risk including the loss of principal and past performance does not guarantee future results.

USDCAD: SHORT Day Trade. Likely Headed Towards 1.29160USDCAD broke 1.29800 support on the 1H Timeframe & now looks to head to its next support which lies in the 1.29160 area. All the trade criteria have been met, have a look at the main chart for all the trade instructions and levels.
Shall there be any updates, i shall provide them in this thread. cheers

DAX (GER30) about to follow US!Hey tradomaniacs,
DAX (Ger30) looks pretty bearish to me and could fall very soon in order to follow the US-Indices.
So far price has been more stable, but orderflow aswell as technicals do look bearish to me and we should see a drop very soon.
What do you think?

USDCHF: Short Day Trade. Fall Towards 0.99000 USDCHF broke the lower support on 1H charts and could be headed lower towards the 0.99000 level. check the main chart for trade details.
Any updates would be provided in this thread. Trade safely, the RR is 1:1. Cheers

AUD/CHF about to FALL!Hey Tradomaniacs,
AUD/CHF has just retested the trendline of the current downtrend aswell as a very strong resistance-zone.
Due to more risk-off a yammi setup with tight stop-loss.
What do you think?

DAY TRADING STRATEGY USING TOP DOWN ANALYSISIn this video i walk you through my day trading strategy from higher time frame to lower time frame.
In the video, you will discover;
How to day trade
How to analyze the market from a higher time frame to a lower time frame
How to pick the best trades that win.
How to mark your support and resistance.
How to follow the trend and many more.

Key points Short ETH 06 May 2022We can estimate with a 75.5% confidence that the volatility for today is going to be below 3.07% for this the market will stay within
TOP 2830
BOT 2660
All of this being calculated with the opening value candle of today or yesterday close daily candle
From the funding rate point of view, the shorts have to pay the funding fee to the long positions,
giving us the idea that there are currently more shorts than long in the market(bearish)
From the fundamental point of view
NFP
Unemployment
Both of them are expected to be lower values than last month -> bearish.
With all of this in mind, we can try a scalp entry for today with the next setup
stop loss 1: 2750 or the opening price 36500
stop loss 2: 2830 expected top for today
take profit 1: 2700
take profit 2: 2650 expected bot for today

NZD/USD likely to FALL!Hey tradomaniacs,
NZD/USD is likely to fall duie to the risk-off in equities and the strong US-Dollar.
Technically we`ve seen a fake-move to the upside and now a break to the downside.
The recent re-test could give us a nice opportunity to sell the next rally.
Let`s see =)

$FTM SHORT 10X (DT) Hello,
Please remember to factor in if the trade posted is a DayTrade (DT) or SwingTrade (ST). To eliminate any confusion all of the Title's should include one or both DT / ST.
PLEASE REMEMBER TO NEVER FOMO IN!
I'm here to share my thoughts and also receive feedback so please leave a comment if you agree/ disagree/ or just wanted to talk about a different setup.
Thanks,
QoverQ

DAX (Ger30) likely to fall with other indices!Hey tradomaniacs,
technically we are getting a nice chance to short DAX30 as price has hit a strong resistance-zone inside the trendchannel.
Fundamentals:
Market only pushed up as Jerome said 0,75% hikes are not considerable. Marked enjoyed that as it would have been the only surprise that wasn`t really priced in, but a rumor
or expectation by some banks.
Nonetheless - It doesnt change the tight policy.
Yap.. I expect Dollar to keep pushing as nothing has changed.... ECB stays dovish while FED freaks out and fights inflation.
Not good for the globale stock-market..
What do you think?

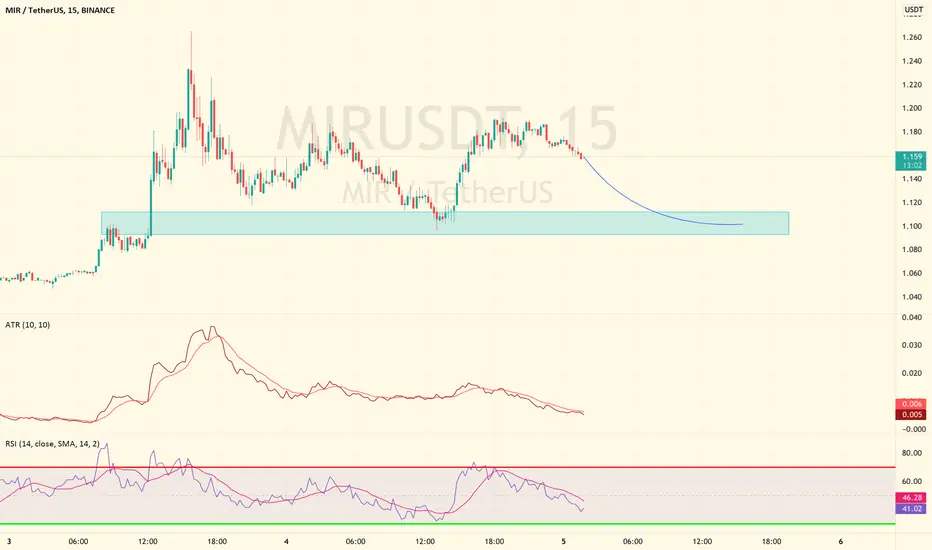
$MIR SHORT (DT)Hello,
Please remember to factor in if the trade posted is a DayTrade (DT) or SwingTrade (ST). To eliminate any confusion all of the Title's should include one or both DT / ST.
PLEASE REMEMBER TO NEVER FOMO IN!
I'm here to share my thoughts and also receive feedback so please leave a comment if you agree/ disagree/ or just wanted to talk about a different setup.
Thanks,
QoverQ
GBP/USD likely to fall!Hey tradomaniacs,
GBP/USD just re-tested a key-resistance after the breakout of the secondary trendline (correction) and is likely to fall due to flipping in the orderbook.
Be cautious as its bank holidays - use wider Stop-Losses or trade tomorrow!
Interest-rate-decision this week could obviously change everything!
What do you think?

NZD/USD about to fall!Hey tradomaniacs,
NZD/USD just tested a strong key-resistance-zone and is likely to fall due to a reload of sell-limits at the top combine with weak aggressive buyers which are not interested to lif the offer yet.
If those don`t get filled it is likely to see a drop here.. at least another correction of zones of more open interest.
What do you think?

EUR/AUD likely to Pump!Hey tradomaniacs,
in confluence with my expectations for a falling stockmarket I expect EUR/AUD to break out of the current correction very soon, especially after the recent stop-hunt to the downside which is often a final move before the price turrns around.
There is a chance to see a re-test of that hunt-zone, but overall I expect price to move up very soon! Classic correction-pattern!
What do you think?
