EURUSD - Day trade by Keltner - Stochastic - ADX 17 March 2021* Take advantage of a 60% success rate of order 1 to enter position 2 with a higher risk/reward ratio,
The bot always gives the entry point to the order first so that the Trader knows how to place the order, every hour will update the entry price of the order once.
- Order 1: risk/reward 1/1. Percent success 60%.
- Order 2: risk/reward: 1 / 1.86 If you use Fibonacci retracement, it is 0.65 or 65%. Percent success 47%.
- Number of consecutive wins in the past: 13.
- Number of consecutive losses in the past: 6. So to avoid psychological influence, choose risk = 1% x 6 = 6% for 1 trading signal.
Currently, the Bot assumes 2% (orders 1: 1%, orders 2: 1%)
- Commission: 4 USD/trade.
- Slippage: 2 ticks.
--------------------
Max risk: 2%
1. Trend identification:
... Keltner channels: Price Through Upper / Lower 1 gives 1 point. 2 points are eligible for entry.
... Stochastic indicator:
...... k> 80: Uptrend. k< 20: Downtrend.
...... d>75 when Buy, d<40 when Sell
... ADX indicator: 31 provides a strong trend following signal.
2. Entry point:
... Price corrects to Upper / Lower when 3 conditions Keltner, Stochastic & ADX indicator meet.
3. Not trade Friday.
Daytrade

BTCUSDT - Breakout Keltner channel & ADX 15 Mar 2021* Historical statistics from 2018:
- 14 consecutive wins.
- 3 consecutive losses.
* Strategy will enter 2 orders, command 2 will appear only when there is command 1:
Command 1: risk / reward ratio 1/1 used to determine if this rule is effective or not? When I Publish, order 1 always has the success rate in 4 years, 1 year and each quarter is 55-69% higher.
Option 2: Appears when there is order 1, Use take-profit and take-loss level of order 1, but enter later according to Fibonacci draw from 2 take-profit and take-loss points of order 1.
. * Order 1 to enter an order:
- Buy: When the ADX index cuts up to 45, check earlier if the closing price has cut up and is above the Upper 2 line, enter the Buy order.
- Sell: when the ADX indicator cuts up to 45, check before that if the closing price has cut down and is above Lower 2 then enter a Sell order.
* How to enter Order 2: When order 1 appears, there are always Stoploss and Takeprofit levels. Draw Fibonacci from take-profit and take-loss prices, Fibonacci retracement level = 75%
----------------
1. Trend identification:
- Channel Keltner:
... Uptrend: when the closing candlestick cuts up and is above the Keltner channel, the Upper Line 2
... Down trend: when the candle closes and falls above the Keltner Line Lower 2
*** Free reference and use:
Keltner Color count
2. Rules of entry:
- Channel Keltner:
... Buy: Candlestick closing price cuts up and above the Keltner Upper 2.
... Sell: The closing price of the candle cuts down and is lower than the Keltner Below 2.
ADX indicator:
... Buy: The ADX value crossed to 45 and the close of the candle was higher than Keltner Upper 2.
... Sell: ADX value cuts to 45 and the close of the candle is lower than Keltner Below 2.
3. Stoploss and Profit = atr (20) * 2.

Dax Sells now valid....📉🙋🏻♂️🙏Do you trade the Dax?
The long didn't quite hit TP, but closed on reverse signal and followed with the sell (check the trade history below)
Entry details are shown on the chart.
We're only looking for TP3.
Trade history can be seen below this trade idea too for full transparency.
------------------------------------------
I try and share as many ideas as I can as and when I have time. My trades are automated so I am not sat in front of a screen daily.
Jumping on random trade ideas 'willy-nilly' on Trading View trying to find that one trade that you can retire from is not a sustainable way to trade. You might get lucky, but it will always end one way.
------------------------------------------
Please hit the 👍 LIKE button if you like my ideas🙏
Also follow my profile, then you will receive a notification whenever I post a trading idea - so you don't miss them. 🙌
No one likes missing out, do they?
Also, see my 'related ideas' below to see more just like this.
Interested in access to my strategy so you can be in these trades the moment they're valid? Drop me a DM .
The stats for this pair are shown below too.
Thank you.
Darren

US30 - Daytrade by Keltner & Stoch 15 Mar 2021Keltner basis: 20 | trend identification: Keltner Upper/Lower 2 | entry: Stochastic breakout k cross d | Stoploss: 2, Profit: 2 | HH-LL: 100:5
Success result: all history FXCM broker in H1 timeframe.
The strategy finds the rule in 4 years, every year, every quarter. The ratio of risk/reward 1/1 to give the success percentage over 55%.
Makes a second order has a better ratio. US30''s risk/reward: 1/1.86.
Look the right label: that rule has 14 times consecutive wins and 6 times consecutive losses in history.
+ A Long trend is when the price close & crossover the Keltner Upper 2 + k value of Stochastic indicator crossover 80.
+ A Short trend is when the price close & crossunder the Keltner Lower 2 + k value of Stochastic indicator crossunder 20.
+ to Entry when k value ( Stoch indicator) make correction and cross the d value ( Stoch indicator)
- Buy: d > 70
- Sell: d < 17


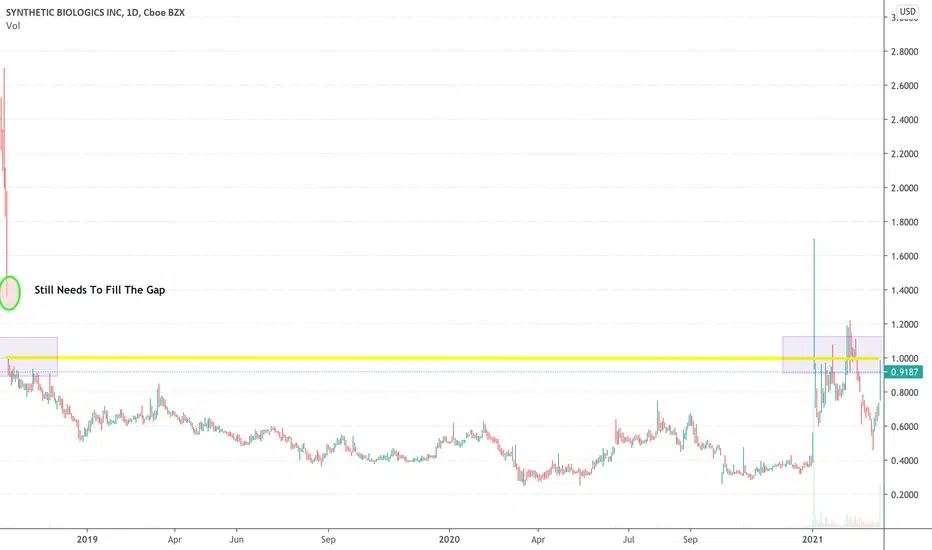
SYN Still Trying To Fill The GapThere's still a pretty big gap to fill from a few years ago but again, with a lot of biotech gaining recently, small caps could be back on the menu.
After Maxim Group upgraded SYN from a hold to a buy, shares of the biotech company dramatically increased. In addition to this, Maxim Group analysts gave a price target for SYN of $2.50. This represents a 10% or so gain from where it was before the rating. At the end of Friday, March 12th, SYN stock had shot up by over 29% to $0.92...CEO Steven Shallcross stated that “we are more encouraged than ever by this outlook for the business as we have made important progress during the fourth quarter advancing and demonstrating the significant value of our clinical development programs. With a number of upcoming catalysts later this year, we believe there is potential to continue to deliver significant value for our shareholders.”
Quote Source: 5 Biotech Penny Stocks On Robinhood To Watch In March 2021

Plain and Simple Bitcoin Daily Analysis - 3/13/21 - BTCUSDTPlain and Simple Bitcoin Daily Analysis - 3/13/21 - BTCUSDT BINANCE:BTCUSDT
As bright as the future might seem right now after the beautifull recovery over the Binance FUD yesterday,
Bitcoin is still struggeling to reach his all time high.
The market is totally hesistant and for now, 2 outstanding bearish divergence on the 4 hours seems to compromise the 60K level
In general, last weekends, price had a tendency to dump.
Indicators are overall mitigated on the direction to take, favoring the downside.
The daily also seems pretty exhausted.
Yesterday, Elon twitted again over Bitcoin, and it had nealy no price effect.
So..
Watch out for another dump, always keeping an eye over the 54500K level, in case it happens for a good entry.
Have fun, trading today !
Thanks for reading !
Stay safe.
And remember, no pain, no gain !
See you all tomorrow, and don't forget to ......
smash that like button !
And don't forget to subscribe to my feed to get my daily analysis in your Trading view chart
Comments are also welcome anytime.
And go check my socials down there if you like this analysis!!!!

A Giant Slant With No Pullback Setting Up For A Big DropGBPUSD has been moving is a large slant for a lengthy period of time according to the daily. And a slant with no pullback of any kind means that a drop is coming. The sideways movement we're seeing could be setting up for a major move to the downside, or a temporary climb further up before it comes crashing back down. Time will tell. Here are the TPs.
BEAR TPs:
• 1.36126
• 1.35326
• 1.34493
• 1.33804
BULL TPs:
• 1.37593
• 1.38250
• 1.39098
• 1.39786

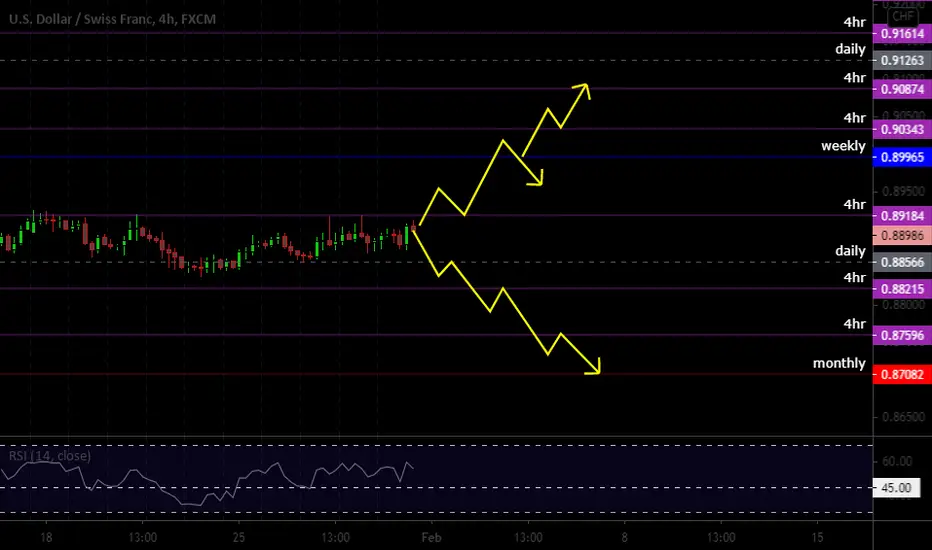
Inverted Head and Shoulders on Daily Could Signal A Big MoveHELLO Inverted Head and Shoulders on the DAILY!! My levels have already trapped price and all I am doing is waiting for the breakout of consolidation between the 4hr 0.89184 zone and daily 0.88566 area. Gonna enjoy this move when it takes off, so be ready!
BULL TPs:
• 0.89965
• 0.90343
• 0.90874
• 0.91263
BEAR TPs:
• 0.88215
• 0.87596
• 0.87082
Key Level Trade SetupThis is a really good key level trade setup. We are sitting on the strongest level on the chart: the monthly.
Since there is a bearish engulfing that formed on the weekly. Pretty sure we're going to go up this week to retest it around the 1.52359 area to retest before continuing down.
BULL TPS:
• 1.50871
• 1.51494
• 1.51918
• 1.52278
BEAR TPS:
• 1.50533
• 1.49638
• 1.48699
• 1.47279

Are These Engulfing Candles Telling Us The Bulls Are Back?It is the week of retesting bullish engulfing candles. There is a bullish engulfing retest that happened last week which could signal the return of the bulls.
Another confirmation is the bullish engulfing that formed on the daily chart Friday, March 5th.
Could see a retest of the engulfing before going up since a higher low is due on the 4hr. If the retest fails, price could send us back down to the 3785.9 daily area before trying again.
The test will be if it can pass the monthly 3867.3 area this week to continue the bull rally or not. Let's find out.
BULL TPS:
• 3867.3
• 3894.2
• 3930.8
BEAR TPS:
• 3823.5
• 3790.0.
• 3755.6
• 3730.6

CBAT Day/Swing-Trade IdeaCBAT's descending wedge trend has reversed into an up trend.
Little resistance is expected until it hits the $6.02 local fibonacci retracement support/resistance level.
A day trade may be possible from $5.50 - 6.02 range.
*Note - Prices tend to peak between 9:30 AM and 11:30 AM EST historically (See Chart).
A swing trade may be possible from $5.50 - $7.24 over the next week.

USDCAD - POSSIBLE DOWNTREND CONTINUATION!In this video I explain why I think we can see further continuation to the downside and test 1.24000 after we have seen a strong close below the 1.26000 level.
Thanks for watching!
Leave a comment if you agree, disagree or have any questions:)

Buy ETH right now. Sell in low to mid 1820s.This is an easy money swap opportunity to increase your positions. ETH is giving us an in and an out. Get ready for some wild swings coming soon. The fundamentals are pointing at the break downs but nothing signaling a long term bear trend yet. Just a few sell signals and bearish divergences. RSI still strong although slightly diverted. If your a HODLer just hang on tight. None of this is trade advice, just indications to watch for.

INVO Potential Day TradeINVO potential day trade. I may enter above the 5.85 for a price target of 7.45 on a bounce up from support. It appears that volume is concentrated at two primary levels, this trade attempts to profit on that spread.
(Just an idea, not advice)

40+ pips trade setup for #eurusd March 8,2021follow up the Sunday video. Potential setup for quick pips. This is intraday setup.

EURUSD - daytrade by Keltner - Stochastic - ADX 8 March 2021* Take advantage of a 60% success rate of order 1 to enter position 2 with a higher risk/reward ratio,
The bot always gives the entry point to the order first so that the Trader knows how to place the order, every hour will update the entry price of the order once.
- Order 1: risk/reward 1/1. Percent success 60%.
- Order 2: risk/reward: 1 / 1.86 If you use Fibonacci retracement, it is 0.65 or 65%. Percent success 47%.
- Number of consecutive wins in the past: 13.
- Number of consecutive losses in the past: 6. So to avoid psychological influence, choose risk = 1% x 6 = 6% for 1 trading signal.
Currently, the Bot assumes 2% (orders 1: 1%, orders 2: 1%)
- Commission: 4 USD/trade.
- Slippage: 2 ticks.
--------------------
Max risk: 2%
1. Trend identification:
... Keltner channels: Price Through Upper / Lower 1 gives 1 point. 2 points are eligible for entry.
... Stochastic indicator:
...... k> 80: Uptrend. k< 20: Downtrend.
...... d>75 when Buy, d<40 when Sell
... ADX indicator: 31 provides a strong trend following signal.
2. Entry point:
... Price corrects to Upper / Lower when 3 conditions Keltner, Stochastic & ADX indicator meet.
3. Not trade Friday.


DXY - Death to Come?We pushed above the most significant previous highs and hit our target of 92. The $ 1.9 trillion support package was approved by the Senate, will this create a strong bearish scenario for the dollar?
It is going to be interesting to see what impact this will have on the DXY next week.

GAMESTOP -- Keep this simple. Late to the party on this one? No worries, it's still game-ON for profits.
Now that there are key ranges in play for ALL to see, this becomes easier to read. Do not complicate it any more than it needs to. Zero moving averages, zero indicators. Read the charts and follow the potential moves from these highlighted areas. Use your own methods for entry, but these are higher probable turning areas I expect to watch...double tops, double bottoms, false breaks, value reversion trading at its best.
Shorts are in the RED and longs are in the GREEN. The current value range WHITE has been created for us to use as targets.
Very similar to my BMBL IPO trade last month.
*Ideas are my own and not as recommendations

Fight to breakout next weekBears vs. Bulls here next week.
We should see alot of volatility next week here as SLGG tries to find direction.
Will bears bring this down to previous levels below $5?
Maybe the Bulls can cause another drive to $8.
Either way very interesting, I will be looking for a play here all week, traders will be watching as well I am sure...
Good luck!
* I will be trying to post less ideas BUT more detailed predictions like this in future to avoid PM's about my ideas. lol
Please leave a like if you find this post useful, thanks!*

Teamviewer Teamviewer AG buys upskill.
Teamviewer continues to expand its business. Positive news that could boost the share price in the short term.
From a chart perspective, Teamviewer is in a range. In the last few days, however, there has been an increase in volume, which reflects great interest in the share.
After a clear pinnbar and the move above the conversion line, there is a nice setup for a short-term trade.
An attempt with a tight stop is worth it.
Good trades!
