Weekly Market Outlook: FOMC, Trade Deals and GeopoliticsIt is a holiday-shortened week, with the majority of markets halting early on Thursday, June 19, 2025, in observance of Juneteenth. See here for holiday trading schedule
Key Themes to Monitor This Week
Geopolitical Risks
Any outside intervention in the ongoing Israel-Iran conflict will likely be seen as a risk-off event by market participants. Despite Friday’s sell-off, markets shrugged off during the Sunday open and overnight sessions.
There are potential risks to trade routes and energy infrastructure, although disruptions seem unlikely at the moment. Amena Bakr at Kpler noted that, so far, there are no signs of disruptions in oil loadings from Iran. Without a supply outage, there is no pressing need for additional barrels to be brought onto the market.
Trade War and Trade Deals
There have been recent developments with the U.S. reaching key trade deal milestones with several countries. The baseline scenario remains optimistic, with expectations for an extension in negotiations and potential reciprocal tariffs for countries failing to reach agreements.
FED Week
This is a key week for U.S. monetary policy, with the FOMC decision, Summary of Economic Projections (SEP), and Chair Powell’s press conference scheduled.
Traders will be closely watching how the Fed’s inflation and growth expectations have evolved, as reflected in the SEP. All eyes will be on the dot plot to note how interest rate expectations have evolved since last quarter. Of note: Will President Trump’s continued calls for rate cuts influence Chair Powell’s tone or guidance?
Expectations for the Week Ahead
NQ futures have continued one-time framing higher, consistently creating higher lows since the week of April 21, 2025. A strong support zone exists below, anchored at the yearly Volume Point of Control (VPOC) and the Anchored VWAP from May 11, 2025, when markets gapped higher.
Key Levels to Watch
• yVAH: 22,690.50
• R2: 22,510
• R1 / Previous Week High: 22,322.50
• May 11 AVWAP: 21,672.25
• yVPOC: 21,660
Scenario 1: Market Grinds Higher but Stays Cautious
Despite several looming risk factors, the market could continue to grind higher. In this scenario, we anticipate a test above the prior week's high, followed by a potential pullback into last week’s range.
Example Trade Idea 1
• Entry: 22,000
• Stop: 21,930
• Target: 22,322
• Risk: 70 pts
• Reward: 322 pts
• Risk-Reward Ratio: 4.6R
Scenario 2: Pullback to Support, Range-Bound Consolidation
If the market pulls back, we expect the yearly VPOC and AVWAP from May 11 to act as key support levels. In this case, price action may remain range-bound within the previous week’s range, forming an inside week.
Example Trade Idea 2
• Entry: 21,672
• Stop: 21,600
• Target: 22,000
• Risk: 72 pts
• Reward: 328 pts
• Risk-Reward Ratio: 4.6R
________________________________________
Glossary
• VPOC: Volume Point of Control
• VA: Value Area
• VAL: Value Area Low
• VAH: Value Area High
• VP: Volume Profile
• AVP: Anchored Volume Profile
• Y: Yearly
• pWk: Previous Week
Daytrading

EUR/USD Short and GBP/USD ShortEUR/USD Short
Minimum entry requirements:
- If tight non-structured 15 min continuation forms, 5 min risk entry within it if the continuation is structured on the 5 min chart or reduced risk entry on the break of it.
- If tight structured 15 min continuation forms, reduced risk entry on the break of it or 15 min risk entry within it.
- If tight non-structured 1H continuation forms, 15 min risk entry within it if the continuation is structured on the 15 min chart or reduced risk entry on the break of it.
- If tight structured 1H continuation forms, 1H risk entry within it or reduced risk entry on the break of it.
GBP/USD Short
Minimum entry requirements:
- If tight non-structured 1H continuation forms, 15 min risk entry within it if the continuation is structured on the 15 min chart.
- If tight structured 1H continuation forms, 1H risk entry within it.

Strongest stock of the day with 3 Buy $CGTL1st and 3rd alert paid for the whole day, including 2nd which was cut quick at $1.70

Just crazy $XTIA in minutesFrom halt to halt, doubling on power volume. It started the year at $60 seems like traders are looking at that as they're buying into vertical.

NQ (Nasdaq) Futures Trading Levels [6/11/25]For Day Traders, here's some trading levels for NQ Futures Trading for today. It's CPI day, so we should get some nice swings today. Trade carefully and trade smart!

USD/CHF ShortUSD/CHF Short
Minimum entry requirements:
- Corrective tap into area of value.
- 4H risk entry or 1H risk entry after 2 x 1H rejection candles.
Minimum entry requirements:
- Tap into area of value.
- 1H impulse down below area of value.
- If tight non-structured 5 min continuation follows, reduced risk entry on the break of it.
- If tight structured 5 min continuation follows, reduced risk entry on the break of it or 5 min risk entry within it.
- If tight non-structured 15 min continuation follows, 5 min risk entry within it if the continuation is structured on the 5 min chart or reduced risk entry on the break of it.
- If tight structured 15 min continuation follows, reduced risk entry on the break of it or 15 min risk entry within it.

1,505% from $0.20 to $3.21 on massive 1+ Billion volume $KLTOWOW 🤯 1,505% from $0.20 to $3.21 on massive 1+ Billion shares traded 🚀 NASDAQ:KLTO
I sent out 2 Buy Alerts for everyone to get paid nicely ✅
This will trigger more runners, premarket already got movers NASDAQ:MEGL , NASDAQ:MRIN , NASDAQ:EVGN

AUD/JPY Short, EUR/JPY Short, GBP/JPY Short and USD/CHF ShortAUD/JPY Short
Minimum entry requirements:
- 1H impulse down below area of value.
- If tight non-structured 5 min continuation follows, reduced risk entry on the break of it.
- If tight structured 5 min continuation follows, reduced risk entry on the break of it or 5 min risk entry within it.
- If tight non-structured 15 min continuation follows, 5 min risk entry within it if the continuation is structured on the 5 min chart or reduced risk entry on the break of it.
- If tight structured 15 min continuation follows, reduced risk entry on the break of it or 15 min risk entry within it.
EUR/JPY Short
Minimum entry requirements:
- If structured 1H continuation forms, 1H risk entry within it.
GBP/JPY Short
Minimum entry requirements:
- If tight non-structured 1H continuation forms, 15 min risk entry within it if the continuation is structured on the 15 min chart.
- If tight structured 1H continuation forms, 1H risk entry within it.
USD/CHF Short
Minimum entry requirements:
- Corrective tap into area of value.
- 4H risk entry or 1H risk entry after 2 x 1H rejection candles.
Minimum entry requirements:
- Tap into area of value.
- 1H impulse down below area of value.
- If tight non-structured 5 min continuation follows, reduced risk entry on the break of it.
- If tight structured 5 min continuation follows, reduced risk entry on the break of it or 5 min risk entry within it.
- If tight non-structured 15 min continuation follows, 5 min risk entry within it if the continuation is structured on the 5 min chart or reduced risk entry on the break of it.
- If tight structured 15 min continuation follows, reduced risk entry on the break of it or 15 min risk entry within it.

BIG 441% Monday from $0.60 to $3.25 $OMH🔥 BIG 441% Monday from $0.60 to $3.25
Easiest money made today was on NASDAQ:OMH buy before halt, then once it came out of halt it was just gapped up into 💸💸💸

Biggest gainer of Fresh Cash Friday $KNWTOTAL gain of the week: +78.8% realized 💪
Monday: +31.7% ✅
Tuesday: +12.5% ✅
Wednesday: +5.3% ✅
Thursday: +9.4% ✅
Friday: +19.9% ✅
All trades posted were posted in real-time.
Not letting emotions take over, keep following the strategy, trading like a robot and letting the stats work in your advantage!
Let’s do it again this week!

USD/JPY Short, AUD/NZD Short, AUD/JPY Neutral and EUR/USD ShortUSD/JPY Short
Minimum entry requirements:
- If tight non-structured 5 min continuation forms, reduced risk entry on the break of it.
- If tight structured 5 min continuation forms, reduced risk entry on the break of it or 5 min risk entry within it.
- If tight non-structured 15 min continuation forms, 5 min risk entry within it if the continuation is structured on the 5 min chart or reduced risk entry on the break of it.
- If tight structured 15 min continuation forms, reduced risk entry on the break of it or 15 min risk entry within it.
AUD/NZD Short
Minimum entry requirements:
- If tight non-structured 15 min continuation forms, 5 min risk entry within it if the continuation is structured on the 5 min chart or reduced risk entry on the break of it.
- If tight structured 15 min continuation forms, reduced risk entry on the break of it or 15 min risk entry within it.
AUD/JPY Neutral
Minimum entry requirements:
- If structured 1H continuation forms, 1H risk entry within it.
Minimum entry requirements:
- 1H impulse down below area of value.
- If tight non-structured 5 min continuation follows, reduced risk entry on the break of it.
- If tight structured 5 min continuation follows, reduced risk entry on the break of it or 5 min risk entry within it.
- If tight non-structured 15 min continuation follows, 5 min risk entry within it if the continuation is structured on the 5 min chart or reduced risk entry on the break of it.
- If tight structured 15 min continuation follows, reduced risk entry on the break of it or 15 min risk entry within it.
EUR/USD Short
Minimum entry requirements:
- Tap into area of value.
- 1H impulse down below area of value.
- If tight non-structured 15 min continuation follows, 5 min risk entry within it if the continuation is structured on the 5 min chart or reduced risk entry on the break of it.
- If tight structured 15 min continuation follows, reduced risk entry on the break of it or 15 min risk entry within it.

NVDA Support and Resistance Lines Valid from June 1 to 30Overview:
These purple lines act as Support and resistance lines when the price moves into these lines from the bottom or the top direction. Based on the direction of the price movement one can take long or short entries.
Trading Timeframes
I usually use 30min candlesticks to swing trade options by holding 2-3 days max. Anyone can also use 3hr or 4hrs to do 2 weeks max swing trades for massive up or down movements.
I post these 1st week of every month and are valid till the end of the month.

Why Higher Timeframe Analysis Increases Your WIN-RATE!Many traders focus too heavily on lower timeframes, chasing setups without any real context. But what if the secret to improving your consistency was as simple as zooming out?
In this video, we break down why analyzing higher timeframes—and trading in their direction—can significantly increase your win rate across Forex, crypto, stocks, and futures. This isn’t just a theory. It’s a principle used by institutional traders, prop firms, and consistently profitable independent traders.
✅ Here’s what you’ll learn in this deep-dive:
The real purpose of higher timeframe analysis and how it acts like a GPS for your trading decisions.
How to identify structure, liquidity, and key levels on the daily, 4H, and weekly charts
Why trading against the higher timeframe flow often leads to premature stop-outs or fakeouts
The power of multi-timeframe alignment: how to sync HTF bias with LTF entries
How trading with higher timeframe momentum helps filter noise, reduce overtrading, and increase conviction
A walkthrough example showing how to use HTF context to validate a lower timeframe setup
Whether you're trading ICT concepts, Fibs, RSI, VWAP, or your own system—this principle applies. Trading in alignment with the higher timeframe doesn’t just increase your odds, it adds structure, patience, and confidence to your process.
📌 Key takeaway: When you understand what the market is doing on the higher timeframe, you stop guessing and start positioning yourself with the move—not against it.
🛠️ Helpful for traders using:
Smart money concepts (SMC)
ICT-based models (like AMD, OTE, and NDOG)
Supply and demand strategies
Price action or indicator-based systems
PRACTICALLY ANY TYPE OF STRATEGY OR METHODOLOGY
So, I hope the video was insightful for you. Let me know if you apply higher timeframe analysis, and how it has helped you.
- R2F Trading

3,367% or $3 to $124 in 1 week!🚀 $3 to $124 in 1 week or +3,367% is the kind of stock we all live for!
NASDAQ:SBET was May's power mover, let's see which one does this in June!

ES Trade Idea and Upcoming NFP ReportCME_MINI:ES1!
• What has the market done?
ES futures are lagging compared to tech heavy index NQ futures. ES futures are still below yearly open. Yearly open has been a strong area of resistance since the rally of April 6th Lows in futures complex.
• What is it trying to do?
ES futures are in consolidation mode, building value higher. VPOC has shifted higher since the gap up from May 11th open. VPOC and 0.786 fib level provide a base for a continuation higher.
• How good of a job is it doing?
Markets seem to be slowing its rally. After such a strong rebound, participants are wary of any pull-backs. Although a strong trend higher, consolidation or a pullback is not illogical at these levels.
• What is more likely to happen from here?
o Scenario 1: Hold steady and NFP provides needed boost for markets to get across yearly open resistance and climb higher.
o Scenario 2: A mixed NFP report may point towards further consolidation. Key level 5873 as support on move lower before reverting higher.
o Scenario 3: A hawkish NFP report that signals higher for longer rates, may be interpreted by market participants as less monetary stimulus and dwindling rate cut bets for this year. We anticipate a sell-off towards 0.618 fib level in this scenario, moving to the lower edge of micro composite volume profile.
In all the above scenarios, there is a clear LIS at yearly open. Other key levels are defined cleanly on the higher time frame. Important thing for traders to note here is to trade what you see and not what you think. Having an alignment between fundamentals and technicals is sound but the markets do what they do, and price moves where it should. Painting narrative to any move may sound fancy but it gets less important at intraday time frames in our opinion. Hence why we view all this considering auction markets and volume profile.
Glossary:
ES - emini-S&P 500 Futures
NQ - emini-NASDAQ 100 Futures
VPOC - Volume Point of Control: The most traded price by volume in a given range. Represents acceptance or consensus
NFP - Non-Farm Payroll: Released by the US Department of Labor around the 1st Friday of every month. It reports on Unemployment, Productivity and other key metrics. Key economic release
LIS - Line In the Sand: A key zone that might tip buyers or sellers to act to cover risk and might change the overall bias of our analysis

$5 to $26 big +400% day for $MULNThe biggest mover of the entire stock market NASDAQ:MULN with huge 400% squeeze. Mentioned probable bounce from $14.50 in chat, then double bottom possibility and stronger bounce from $14.50 again, after double bottom was confirmed it rocketed beyond $20 and $25.
It closed the day right at same $14.50 area once again, we'll see how it trades tomorrow.

HUGE $5 to $49 today +900% vertical $MCTR told you early!HUGE 🤯 $5 to $49 today +900% vertical 🚀 shared a chart with you early before it went on a power squeeze NASDAQ:MCTR

$5 to $19 or +300% vertical! Catching a safe piece of $MCTR$5 to $19 🚀 Catching a safe piece daily from the move like that is all you need to keep the job away 💯 NASDAQ:MCTR

Full trade plan with exact prices laid out ahead of time!After shortsellers forcefully pushed NASDAQ:MODV down from mid $2's I said this will most likely result into powerful squeeze.
I said buy at the dip $2.31 exactly, waited to get filled, double dip to $2.31 happened to get a full position and from there straight up to mid $3's, took profits in 2 parts and sent out messages live as it was happening so everyone that followed along knew what to do.
Solid +30% gain in minutes, taking safest piece of the 200% move the stock made before focus shifted elsewhere.
That's how it's done, in and out at highly predictable levels, then moving on to the next stock because NASDAQ:NIVF NASDAQ:EYEN NASDAQ:REVB are already up and hot this morning, not marrying it and holding & hoping forever.

US30 JUNE 2What did the Buffalo say to his son when he left home? Bison...
Anyway, let's get to work. Price is looking very messy. So instead of trading it I'm going to draw a box around the consolidation and wait for price to break and retest the ends of the boxes.
Like always I'll wait for the 1m for price to break and retest before I enter the trade.
NEVER Trade Consolidation, it gets messy quickly.
Anywho... Have fun trading and be patient.

$1 to $7.18 continued to 600% vertical $BMGLIt just didn't want to stop ripping higher, congrats if you got in if not sooner then at least when I posted a chart in $3's there was still time to catch a doubler up into $7's NASDAQ:BMGL

#ES_F Weekly Prep 06.01 - 06.06.25Last week we have consolidated, built a cost basis under HTF Edge Top and made a push into new HTF Ranges Value on Wednesday after some news, we made it into the Mean of that range but failed to hold before the open trapping Supply in Value. Thursday held under the Edge and by Friday built up enough supply to flush Holiday Cost basis into lower Value where the selling stopped at the Mean and we started covering, being mid day Friday and End of Month we got strong enough covering to take us all the way back into the Edge/into current Intraday Ranges top which is around 930 - 25 Area.
Question for this week is, was that a strong bid on Friday which will give us a hold and continued pushes into above VAL over the Edge or was it just a retest of this Edge top from below, momentum traders pushed us out on news and now we are back inside 930 - 770s HTF Range ?
Looking at our structure, we had Trend Change on Thursday during RTH Open and for now we have closed Friday in downward correction Trend. This tells us that its possible that we have failed to accept inside new above HTF Range and if that is the case then we could target moves back down towards lower areas of VAH / Mean / VAL and if there will be volume moves under it.
For things to change and to see stability + strength out of here we would need to see a good push over 930s which could hold over AND see a move over 941 - 45 area, without that need to be careful with longs into those areas as our Supply and Sellers are around and over us.
Things have been slow and moves take a while to set up so Current Intraday Range could act as support and we can see price trade back and forth inside it with Holiday Cost basis providing Support, BUT if we do get through that under VAH then we can see further moves down towards Mean and VAL which has another cost basis there that we can try to fill out and it could hold the price around it, to see any more weakness from there we would need to find ourself under VAL and be able to get into that 800 Balance area, it is new Month and we do have Market Moving Data this week so it could happen.
If this will be the case good entry areas for continuation lower could be found around
914 - 10 // 900 - 896 // 869 - 65 // 855 - 51 careful around 824 - 20 and IF we attempt for move into lower Balance could find entries for it at 810 - 06
IF Trend does change and we hold over the Edge OR we hold Current Intraday Range and some of the weekly Data/News will push us over 941 - 45 then we could see moves into above VAL / Mean and would look for Entries around 955 - 59 // 986 - 90 if this will be the case need to be careful with looking for too much continuation over the Mean as there will be selling closer to above VAH we get and especially if we see pushes into/over it as there is more supply above, if move higher happens we would probably look to stay under 630 - 20s and If Holiday Cost Basis holds as Support the could also find long entries at 896 - 900 area after we hold under but need to be careful with looking for big moves and try to grab area to area as market moves and back fills very efficiently lately so watch out for back and forth trading while its moving towards targets.

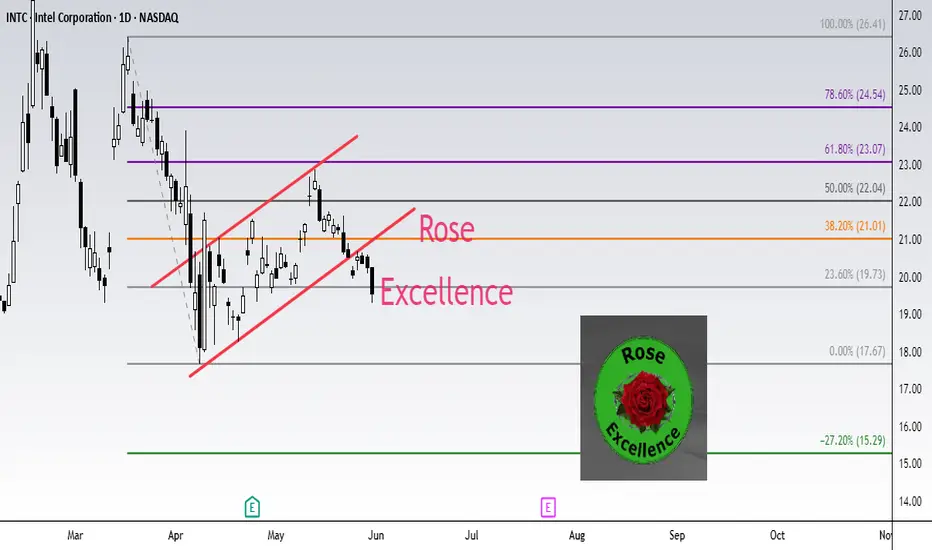
INTEL INTC Short setup target 15.29Fibonacci technical analysis : Intel Corporation NASDAQ:INTC has already found resistance at the Fib level 61.8% (23.07) of my Down Fib. The May 30th Daily candle has closed below retracement Fib level 23.6% (19.73), confirming a sell signal. A Bear Flag pattern has also formed. My Down Fib guides me to look for NASDAQ:INTC to eventually go down to hit first target at Fib level -27.2% (15.29).
NASDAQ:INTC – Target 1 at -27.2% (15.29), Target 2 at -61.8% (12.26) and Target 3 at -78.6 (10.79)
Stop loss slightly above the 50.0% retracement Fib level (22.04).
Enjoy the trading process and take time to smell the roses🌹