Mon 17th Mar 2025 GBP/CAD Daily Forex Chart Sell SetupGood morning fellow traders. On my Daily Forex charts using the High Probability & Divergence trading methods from my books, I have identified a new trade setup this morning. As usual, you can read my notes on the chart for my thoughts on this setup. The trade being a GBP/CAD Sell. Enjoy the day all. Cheers. Jim
DCA

HOW-TO: Optimizing FADS for Traders with Investment MindsetIn this tutorial, we’ll explore how the Fractional Accumulation/Distribution Strategy (FADS) can help traders especially with an investment mindset manage risk and build positions systematically. While FADS doesn’t provide the fundamentals of a company which remain the trader’s responsibility, it offers a robust framework for dividing risk, managing emotions, and scaling into positions strategically.
Importance of Dividing Risk by Period and Fractional Allocation
Periodic Positioning
FADS places entries over time rather than committing the entire position at once. This staggered approach reduces the impact of short-term volatility and minimizes the risk of overexposing the capital.
Fractional Allocation
Fractional allocation ensures that capital is allocated dynamically during building a position. This allows traders to scale into positions as the trade develops while spreading out the risk.
Using a high volatility setting, such as a Weekly with period of 12 , optimizes trend capture by filtering out minor fluctuations.
Increasing Accumulation Factor to 1.5 results in avoiding entries at high price levels, improving overall risk.
Increasing the Accumulation Spread to a higher value, such as 1.5 , expands the distance between buy orders. This leads to fewer trades and a more conservative accumulation strategy. In highly volatile markets, a larger distance between entry positions can significantly improve the average cost of trades and contribute to better capital conservation.
To compensate for the reduced number of trades, increasing the Averaging Power intensifies the position sizing proportionate to price action. This balances the overall risk profile by optimizing the average position cost.
This approach mimics the behavior of successful institutional investors, who rarely enter the market with full exposure in a single move. Instead, they build positions over time to reduce emotional decision-making and enhance long-term consistency.

Why DCA Does Not Work For Short-Term TradersIn this video I go through why DCA (Dollar Cost Averaging) does not work for short-term traders and is more suitable for investors. I go through the pitfalls than come through such techniques, as well as explain how trading should really be approached. Which at it's cost should be based on having a positive edge and using the power of compounding to grow your wealth.
I hope this video was insightful, and gives hope to those trying to make it as a trader. Believe me, it's possible.
- R2F Trading

XAU/USD: Gold – Glittering Gains or Gilded Trap?(1/9)
Good evening, everyone! 🌙 XAU/USD: Gold – Glittering Gains or Gilded Trap?
With gold at $2,984.40, is this safe-haven star shining bright or setting up for a fall? Let’s mine the truth! 🔍
(2/9) – PRICE PERFORMANCE 📊
• Current Price: $ 2,984.40 per ounce as of Mar 14, 2025 💰
• Recent Move: Near $3,000, up from recent trends, per data 📏
• Sector Trend: Precious metals hot with trade tensions, rate cut bets 🌟
It’s a shiny ride—let’s see what’s fueling it! ⚙️
(3/9) – MARKET POSITION 📈
• Global Role: Safe-haven asset, industrial use in electronics ⏰
• Supply Dynamics: Central bank buying, mining output steady 🎯
• Trend: Geopolitical risks pushing demand, per posts on X 🚀
Firm as a rock in uncertain times! 🏦
(4/9) – KEY DEVELOPMENTS 🔑
• Trade Tensions: U.S.-China tariff threats boosting safe-haven appeal 🌍
• Rate Cuts: Fed easing bets supporting prices, per data 📋
• Market Reaction: Near record highs, showing strength 💡
Riding waves of global chaos! 🌊
(5/9) – RISKS IN FOCUS ⚡
• Economic Recovery: Could dampen safe-haven demand 🔍
• Market Sentiment: Sudden risk-on shifts might trigger a sell-off 📉
• Supply Boost: Increased mining could cap gains ❄️
It’s a glittering gamble—watch out! 🛑
(6/9) – SWOT: STRENGTHS 💪
• Safe-Haven Demand: Gold thrives in uncertainty 🥇
• Central Bank Buying: Steady support from global reserves 📊
• Green Energy: Use in renewables adds industrial demand 🔧
Got a golden edge in tough times! 🌟
(7/9) – SWOT: WEAKNESSES & OPPORTUNITIES ⚖️
• Weaknesses: High prices risk a correction if tensions ease 📉
• Opportunities: Escalating trade wars, infrastructure spending 📈
Can it break $3,000 and hold? 🤔
(8/9) – POLL TIME! 📢
Gold at $2,984.40—your take? 🗳️
• Bullish: $3,100+ soon, safe-haven rally continues 🐂
• Neutral: Steady near $3,000, risks balance out ⚖️
• Bearish: $2,800 looms, correction ahead 🐻
Chime in below! 👇
(9/9) – FINAL TAKEAWAY 🎯
Gold’s $2,984.40 price reflects safe-haven strength 📈, but it’s not cheap—volatility’s our ally. DCA-on-dips could catch a dip below $3,000 for a long-term win. Gem or bust?

$DXY: Dollar Strength or Dollar Dip?(1/9)
Good afternoon, everyone! 🌞 DXY: Dollar Strength or Dollar Dip?
With the DXY at 103.732, is the dollar flexing its muscles or ready to stumble? Let’s break it down! 🔍
(2/9) – PRICE PERFORMANCE 📊
• Current Price: 103.732 as of Mar 14, 2025 💰
• Recent Move: Near recent levels, down from 110.18 peak (web data) 📏
• Sector Trend: Forex markets volatile, with trade and policy shifts 🌟
It’s a wild ride—dollar’s dancing on the edge! ⚙️
(3/9) – MARKET POSITION 📈
• Role: Measures USD vs. euro, yen, pound, and more 🏆
• Influence: Drives forex and commodity prices globally ⏰
• Trend: Balancing U.S. policy and global demand, per data 🎯
King of currencies, but not without challengers! 🚀
(4/9) – KEY DEVELOPMENTS 🔑
• Trade Tensions: U.S.-China tariff talks ongoing, per data 🌍
• Rate Cut Bets: Markets eyeing Fed moves, per posts on X 📋
• Market Reaction: Holding steady at 103.732 amid mixed signals 💡
Navigating a storm of global pressures! 🛳️
(5/9) – RISKS IN FOCUS ⚡
• Rate Cuts: Could weaken dollar if Fed acts, per X sentiment 🔍
• Trade Wars: Tariffs disrupting supply chains, per data 📉
• Global Growth: Slowdowns hitting demand for USD ❄️
It’s a tightrope—risks aplenty! 🛑
(6/9) – SWOT: STRENGTHS 💪
• Reserve Status: USD’s global dominance holds firm 🥇
• U.S. Economy: Still a powerhouse, supporting dollar value 📊
• Safe Haven: Attracts flows in uncertain times, per trends 🔧
Got muscle to flex when it counts! 🏦
(7/9) – SWOT: WEAKNESSES & OPPORTUNITIES ⚖️
• Weaknesses: Vulnerable to rate cuts, trade spats 📉
• Opportunities: Strong U.S. data could lift it higher, per outlook 📈
Can it hold the line or break out? 🤔
(8/9) – POLL TIME! 📢
DXY at 103.732—your take? 🗳️
• Bullish: 105+ soon, dollar rallies 🐂
• Neutral: Steady, risks balance out ⚖️
• Bearish: 100 looms, dollar dips 🐻
Chime in below! 👇
(9/9) – FINAL TAKEAWAY 🎯
The DXY’s 103.732 shows it’s steady but tested 📈. Trade wars and Fed moves could swing it either way—dips are our DCA gold 💰. Buy low, ride high—time’s the key! Gem or bust?

$ADSK: AutodesK – Designing Profits or Sketching Losses?(1/9)
Good afternoon, everyone! ☀️ NASDAQ:ADSK : AutodesK – Designing Profits or Sketching Losses?
With ADSK at $245 post-Q4 beat and robust guidance, is this design titan a blueprint for profit or a rough draft? Let’s ink out the details! 🔍
(2/9) – PRICE PERFORMANCE 📊
• Current Price: $ 245 as of Mar 13, 2025 💰
• Recent Move: Up after Q4 FY2024 earnings beat, per data 📏
• Sector Trend: Tech sector buoyant, with AI and cloud driving growth 🌟
It’s a tech favorite—let’s see if it’s worth the hype! ⚙️
(3/9) – MARKET POSITION 📈
• Market Cap: Approx $50B (assuming shares outstanding) 🏆
• Operations: Design software for architecture, engineering, manufacturing ⏰
• Trend: Cloud and AI integration boosting future growth, per reports 🎯
Firm in its niche, with digital transformation as tailwind! 🚀
(4/9) – KEY DEVELOPMENTS 🔑
• Q4 FY2024 Earnings: Billings and revenue beat, per data 🌍
• FY2026 Guidance: Revenue growth 8-9%, FCF $2.075B-$2.175B 📋
• Market Reaction: Stock price up post-earnings, indicating confidence 💡
Adapting to new tech trends, looking ahead! 💪
(5/9) – RISKS IN FOCUS ⚡
• Economic Slowdown: Reduced software spending in tough times 🔍
• Tariff Threats: March 10-12, 2025, impacting new business, per data 📉
• Competition: Adobe, Siemens, others in design software market ❄️
It’s a competitive landscape—risks are real! 🛑
(6/9) – SWOT: STRENGTHS 💪
• Market Leader: Dominant in design software, strong brand 🥇
• Subscription Model: Recurring revenue from cloud-based services 📊
• AI Integration: Leveraging AI for enhanced products, per recent announcements 🔧
Got solid foundations and futuristic vision! 🏦
(7/9) – SWOT: WEAKNESSES & OPPORTUNITIES ⚖️
• Weaknesses: High valuation (P/E around 39), macro headwinds 📉
• Opportunities: Expanding into manufacturing, healthcare, per strategy 📈
Can it justify its price and expand further? 🤔
(8/9) – POLL TIME! 📢
ADSK at $245—your take? 🗳️
• Bullish: $260+ soon, growth story continues 🐂
• Neutral: Steady, risks and opportunities balance out ⚖️
• Bearish: $220 looms, overvalued in current market 🐻
Chime in below! 👇
(9/9) – FINAL TAKEAWAY 🎯
ADSK’s $245 price reflects strong performance and guidance 📈, but with a high P/E ratio, it’s not for the faint-hearted. Dips could be golden opportunities for DCA investors. Gem or bust?

Copper (HG): Red Metal Rally or Rusty Bet?(1/9)
Good afternoon, everyone! ☀️ Copper (HG): Red Metal Rally or Rusty Bet?
With copper at $4.88 per pound, is this industrial darling a steal or a trap? Let’s dig into the dirt! 🔍
(2/9) – PRICE PERFORMANCE 📊
• Current Price: $ 4.88 per pound as of Mar 13, 2025 💰
• Recent Move: Up slightly this week (Mar 10-13), per data 📏
• Sector Trend: Industrial metals volatile, with tariff impacts 🌟
It’s a mixed bag—let’s see what’s driving the price! ⚙️
(3/9) – MARKET POSITION 📈
• Global Demand: Key in construction, electronics, renewable energy ⏰
• Supply Dynamics: Major producers in Chile, Peru, China; tariff risks loom 🎯
• Trend: Green energy demand up, but economic slowdowns could dampen growth 🚀
Firm in its industrial roots, but facing new challenges! 🏭
(4/9) – KEY DEVELOPMENTS 🔑
• Trade War Escalation: U.S.-China tensions on Mar 13, 2025, per data, could hit supply chains 🌍
• China’s Response: Uncertain, but likely to affect prices due to its role in copper 📋
• Market Reaction: Prices volatile but up slightly, indicating cautious optimism 💡
Navigating through geopolitical storms! 🛳️
(5/9) – RISKS IN FOCUS ⚡
• Economic Slowdown: Reduced industrial activity could lower demand 🔍
• Supply Disruptions: Tariffs or geopolitical issues could disrupt supply, per data 📉
• Substitution: Other materials or technologies could reduce copper’s importance ❄️
It’s a risky ride, but potential rewards are there! 🛑
(6/9) – SWOT: STRENGTHS 💪
• Increasing Demand from Green Energy: Solar panels, wind turbines, EVs require copper 🥇
• Industrial Staple: Essential in construction and electronics, ensuring steady demand 📊
• Price History: Historically, copper has been a good long-term investment, especially during expansions 🔧
Got solid fundamentals! 🏦
(7/9) – SWOT: WEAKNESSES & OPPORTUNITIES ⚖️
• Weaknesses: Price volatility due to economic cycles and supply disruptions 📉
• Opportunities: Expansion in emerging markets, new applications in tech and infrastructure 📈
Can copper shine through the challenges? 🤔
(8/9) – 📢Copper at $4.88 per pound—your take? 🗳️
• Bullish: $5+ soon, green energy boom drives prices up 🐂
• Neutral: Steady, risks and opportunities balance out ⚖️
• Bearish: $4 looms, economic slowdown hits demand 🐻
Chime in below! 👇
(9/9) – FINAL TAKEAWAY 🎯
Copper’s $4.88 price reflects a mix of optimism and caution 📈. With green energy demand rising but economic and geopolitical risks lingering, it’s a volatile market. DCA-on-dips could be a strategy to average in over time, banking on long-term growth. Gem or bust?

$HRTG: Heritage Insurance – Catastrophe or Opportunity?(1/9)
Good morning, everyone! ☀️ NYSE:HRTG : Heritage Insurance – Catastrophe or Opportunity?
With HRTG at $11.50, is this insurer a risky bet or a hidden gem in the catastrophe-prone market? Let’s dive into the details! 🔍
(2/9) – PRICE PERFORMANCE 📊
• Current Price: $ 11.50 as of Mar 12, 2025 💰
• Recent Move: Slipped 4% post-Q4 earnings, but stabilized 📏
• Sector Trend: Insurance sector steady, with P&C insurers facing claims volatility 🌟
It’s a volatile ride, but potential value lurks! ⚙️
(3/9) – MARKET POSITION 📈
• Market Cap: Approx $200M (assuming 17.39M shares) 🏆
• Operations: Property and casualty insurance in high-risk areas ⏰
• Trend: Niche focus on catastrophe-prone regions like Florida, potential for growth 🎯
Firm in its niche, but risks are high! 🚀
(4/9) – KEY DEVELOPMENTS 🔑
• Q4 2024 Earnings: Net income $0.66 per share, down from $1.15 YoY 🔄
• Revenue: Slightly missed estimates, per reports 🌍
• Market Reaction: Stock slipped 4%, but stabilized post-earnings 📋
Adapting to challenges, looking ahead! 💡
(5/9) – RISKS IN FOCUS ⚡
• Natural Disasters: High exposure to claims from hurricanes, floods, etc. 🔍
• Regulatory Changes: Potential impacts from state regulations in Florida and other areas 📉
• Competition: Increasing competition in high-risk insurance markets ❄️
Tough, but risks are part of the game! 🛑
(6/9) – SWOT: STRENGTHS 💪
• Niche Market: Focus on high-risk areas with potentially higher premiums 🥇
• Established Presence: Strong foothold in Florida and other states 📊
• Growth Potential: Increasing demand due to climate change and urbanization 🔧
Got potential in a challenging market! 🏦
(7/9) – SWOT: WEAKNESSES & OPPORTUNITIES ⚖️
• Weaknesses: Earnings volatility from natural disasters, regulatory risks 📉
• Opportunities: Expansion into new high-risk areas, technological advancements for better risk management 📈
Can it weather the storms and shine? 🤔
(8/9) –📢HRTG at $11.50, with undervaluation signs—your take? 🗳️
• Bullish: $15+ soon, undervalued gem 🐂
• Neutral: Steady, risks balance growth ⚖️
• Bearish: $10 looms, catastrophe ahead 🐻
Chime in below! 👇
(9/9) – FINAL TAKEAWAY 🎯
HRTG’s $11.50 price tags potential value 📈, but catastrophe risks add caution 🌿. Volatility’s our friend—dips are DCA gold 💰. Grab ‘em low, climb like pros! Gem or bust?

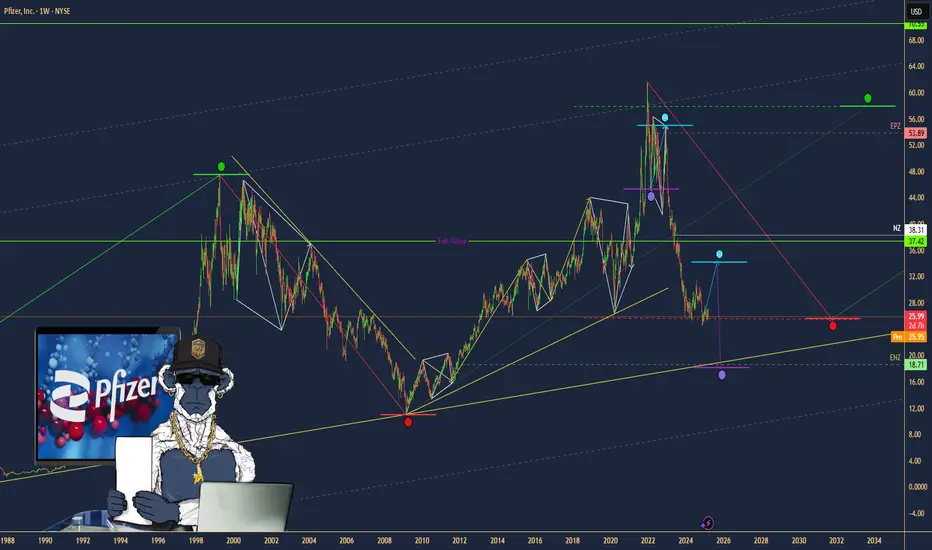
Pfizer ($PFE): Undervalued Pharma Giant with Growth Potential?(1/9)
Good afternoon, everyone! 😊
Pfizer ( NYSE:PFE ): Undervalued Pharma Giant with Growth Potential?
With PFE at $25.90, is this the time to buy into this pharmaceutical powerhouse? Let’s dive in! 😎
(2/9) – PRICE PERFORMANCE
• Current Price: $25.90 as of March 12, 2025 😏
• Recent Moves: Trading within a range of $24 to $28, currently near the middle 😬
• Sector Vibe: Pharma sector remains stable, with new drug approvals driving growth 📈
Short commentary: The stock seems to be consolidating. Is this a good entry point? 🤔
(3/9) – MARKET POSITION
• Market Cap: Approximately $147.2 billion (assuming 5.67 billion shares outstanding) 💰
• Operations: Global pharmaceutical company with a diverse product portfolio 🛡️
• Trend: Strong Q4 2024 earnings and reaffirmed 2025 guidance 🚀
Short commentary: Pfizer’s fundamentals are solid, with consistent revenue and earnings projections. 😉
(4/9) – KEY DEVELOPMENTS
• Reaffirmed 2025 revenue guidance of $61-64 billion and EPS of $2.80-3.00 📈
• Continued focus on new drug developments and expanding into emerging markets 🌐
• Achieved cost savings goals and ongoing optimization programs for improved margins 💡
Short commentary: The company is managing its costs effectively and looking to future growth. Let’s watch closely. 👀
(5/9) – RISKS IN FOCUS
• Legal challenges related to past products ⚙️
• Competition from generic manufacturers and patent expirations 📉
• Economic conditions affecting healthcare spending ⚠️
Short commentary: These risks are known, but Pfizer’s diverse portfolio should help mitigate them. Stay vigilant! 🕵️
(6/9) – SWOT: STRENGTHS
• Diverse product portfolio across multiple therapeutic areas 🏆
• Strong R&D capabilities and pipeline of new drugs 🌈
• Global presence and distribution network 🌟
Short commentary: Pfizer’s strengths position it well for long-term growth. Keep up the good work! 👍
(7/9) – SWOT: WEAKNESSES & OPPORTUNITIES
• Weaknesses: Dependence on key products, legal issues ⚠️
• Opportunities: New drug approvals, expanding into emerging markets 🌐
Short commentary: Opportunities abound, but weaknesses need to be monitored. Let’s hope they nail it! 📈
(8/9) – PFE at $25.90 – what’s your call? 🗳️
• Bullish: Price could rise to $30+ if it breaks above $28 🚀
• Neutral: Price remains between $24 and $28 😐
• Bearish: Price could drop to $22 if it breaks below $24 📉
Drop your pick below! 💬
(9/9) – FINAL TAKEAWAY
Pfizer’s $25.90 stance shows a company with solid fundamentals and a fair valuation at a P/E of approximately 8.93. With a strong pipeline and cost management, it’s an attractive option for value investors. Keep an eye on resistance at $28 for potential upside movement. Snag low, hold long!
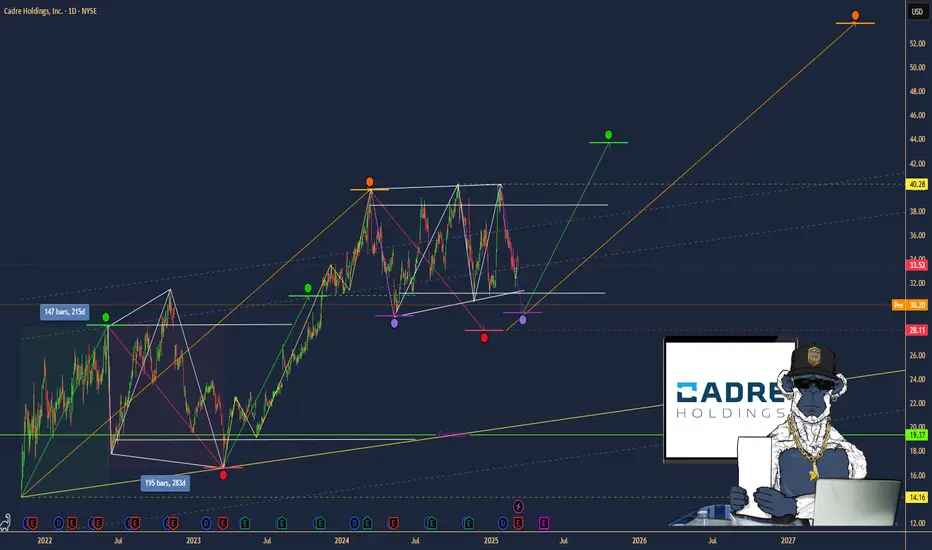
$CDRE: Cadre Holdings – Riding the Safety Wave?(1/9)
Good afternoon, everyone! 😊
NYSE:CDRE : Cadre Holdings – Riding the Safety Wave?
With CDRE at $30.20, is this stock a safe bet or a risky ride? Let's dive into the world of safety gear and see if Cadre's holdings hold up! 😎
(2/9) – PRICE PERFORMANCE
• Current Price: $30.20 as of March 12, 2025 😏
• Recent Moves: Down 11% from $34.02 a week ago 😬
• Sector Vibe: Safety equipment sector is growing, driven by stricter regulations and demand for safer workplaces. 📈
Short commentary: The stock's taken a hit, but the sector's looking good. Maybe it's just a temporary dip? 🤔
(3/9) – MARKET POSITION
• Market Cap: Approximately $1.23 billion 💰
• Operations: Manufacturing and distributing safety and survivability products for law enforcement, first responders, military, and now, the nuclear market. 🛡️
• Trend: Expanding into new markets with the acquisition of nuclear safety brands. 🚀
Short commentary: They're diversifying, which is usually a good sign. More markets mean more opportunities. 😉
(4/9) – KEY DEVELOPMENTS
• Acquisition of Carr's Engineering Limited's Engineering Division for nuclear safety solutions, announced on January 16, 2025. 📈
• Expected to close in the first half of 2025. ⌛
• Market Reaction: The stock has seen a recent dip, possibly reflecting integration concerns or broader market volatility. 😐
Short commentary: This should bring in new revenue streams and expand their international presence. Let's see how it plays out. 🌍
(5/9) – RISKS IN FOCUS
• Integration risks from the acquisition. ⚙️
• Supply chain disruptions. 🚚
• Regulatory changes in the nuclear sector. 📜
Short commentary: These are all things to keep an eye on, but every company has some risks. Stay vigilant! 🕵️
(6/9) – SWOT: STRENGTHS
• Strong reputation in safety equipment. 🏆
• Diverse product portfolio. 🌈
• Recent acquisition expanding into the nuclear market. 🌟
Short commentary: They're well-known and have a broad range of products, which is great. Keep up the good work! 👍
(7/9) – SWOT: WEAKNESSES & OPPORTUNITIES
• Weaknesses: Potential over-reliance on government contracts, integration challenges. ⚠️
• Opportunities: Growth in nuclear safety market, increasing global demand for safety products. 🌐
Short commentary: They need to manage their dependencies and make sure the acquisition goes smoothly, but there's a lot of potential for growth. Let's hope they nail it! 📈
(8/9) – CDRE at $30.20 – what's your call? 🗳️
• Bullish: Price could rise to $35+ soon, due to successful acquisition and sector growth. 🚀
• Neutral: Price remains steady, as the market digests the acquisition news. 😐
• Bearish: Price could drop to $25, due to integration risks and market volatility. 📉
Drop your pick below! 💬
(9/9) – FINAL TAKEAWAY
Cadre Holdings' $30.20 stance shows a robust portfolio and strategic expansion, but recent price dips and integration risks are concerns. Volatility’s our ally—dips are DCA treasure. Snag low, soar high!
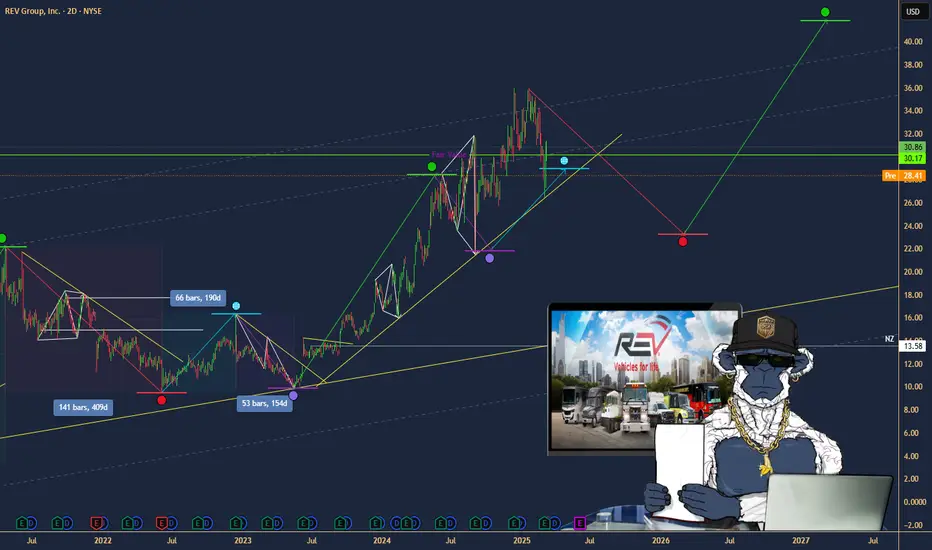
$REVG: REV Group – Riding the Specialty Vehicle Wave?(1/9)
Good morning, everyone! 😄
NYSE:REVG : REV Group – Riding the Specialty Vehicle Wave?
With NYSE:REVG at $31.00, is this stock revving up for growth or hitting a speed bump? Let’s dive into the details! 😎
(2/9) – PRICE PERFORMANCE 📊
• Current Price: $32.00 as of 12-03-2025 😊
• Recent Moves: Up from last month, showing steady growth. 📈
• Sector Vibe: Specialty vehicles sector is stable, with consistent demand from public services and commercial clients. 🚒🚜
Short commentary: REVG’s price is on an upward trajectory, reflecting positive market sentiment. Let’s see what’s driving this! 🚀
(3/9) – MARKET POSITION 📈
• Market Cap: Approximately $1.75B (based on 52.13M shares * $32.00) 💰
• Operations: Designs, manufactures, and distributes specialty vehicles like fire trucks, ambulances, and recreational vehicles. 🚓🏎️
• Trend: Increasing focus on customization and technology integration in vehicles. ⚙️
Short commentary: REVG is a key player in the niche market of specialty vehicles, with a diverse portfolio that caters to various sectors. Their market position seems solid. 🌟
(4/9) – KEY DEVELOPMENTS 🔑
• Exited bus manufacturing business by selling ElDorado National, focusing on core segments. 🚐
• Provided fiscal 2025 guidance, showing confidence in future performance. 📈
• Increased quarterly dividend by 20%, signaling strong cash flow and shareholder value focus. 💸
Market Reaction: Positive, with stock price reflecting these developments. Investors are optimistic about the company’s strategic moves. 😃
Short commentary: These developments suggest that REVG is streamlining its operations and focusing on more profitable areas, which should benefit shareholders. 👏
(5/9) – RISKS IN FOCUS ⚠️
• Economic slowdown could reduce demand for new vehicles, especially in the commercial sector. 🌦️
• Supply chain disruptions might affect production schedules and costs. 🚚
• Increased competition in the recreational vehicles segment. 🏕️
Short commentary: While there are risks, REVG’s diversified portfolio and focus on essential services might mitigate some of these challenges. It’s important to monitor these factors closely. 🕵️
(6/9) – SWOT: STRENGTHS 💪
• Strong brand portfolio with recognized names in the industry. 🏆
• Diverse customer base across public services and commercial clients. 🌐
• Recent strategic decisions to exit less profitable segments. 🚫
Short commentary: REVG’s strengths lie in its well-established brands and broad customer reach, which provide stability and growth opportunities. 💪
(7/9) – SWOT: WEAKNESSES & OPPORTUNITIES ⚖️
• Weaknesses: Dependence on economic conditions and potential regulatory changes. 📜
• Opportunities: Growth in the fire and emergency segment due to increased public safety spending. 🚒
Short commentary: While there are weaknesses tied to external factors, the opportunities in expanding sectors like fire and emergency services could drive future growth. It’s a balancing act! ⚖️
(8/9) – 📢REV Group at $32.00, with recent positive developments—your call?
• Bullish: $40+ soon, due to strategic focus and increased dividend. 🚀
• Neutral: Steady growth, maintaining current trends. 🛴
• Bearish: $25 drop, if economic conditions worsen. ⬇️
Drop your pick below! 😄
(9/9) – FINAL TAKEAWAY 🎯
REV Group’s $31.00 stance shows resilience and strategic planning, but economic risks linger. Volatility’s our ally—dips are DCA treasure. Snag low, soar high! Will it rev up or slow down?
$CRWD: Crowdstrike – Cybersecurity Titan or Overvalued Hype?(1/9)
Good afternoon, investors! ☀️ NASDAQ:CRWD : Crowdstrike – Cybersecurity Titan or Overvalued Hype?
With NASDAQ:CRWD at $322, is this cyber guardian still leading the pack or is it time to cash in? Let's dive into the digital trenches! 🔍
(2/9) – PRICE PERFORMANCE 📊
• Current Price: $ 322 as of Mar 11, 2025 💰
• Recent Moves: Down from $360+ post-Q4, per X posts 📏
• Sector Trend: Cybersecurity demand remains robust, per market insights 🌟
It’s a steady ride with potential for growth! ⚙️
(3/9) – MARKET POSITION 📈
• Market Cap: ~$75B (based on 232.5M shares) 🏆
• Operations: Leader in endpoint security and threat intelligence ⏰
• Trend: Expanding into AI-driven security solutions, per recent developments 🎯
Firm, standing tall in the cyber battlefield! 🚀
(4/9) – KEY DEVELOPMENTS 🔑
• Earnings Win: Q1 FY25 beat estimates, guidance raised, per X posts 🔄
• Cyber Boom: Threats fuel demand, per Mar 6 chatter 🌍
• Market Reaction: Stock jumped, then dipped, per X sentiment 📋
Battling, with innovation driving the narrative! 💡
(5/9) – RISKS IN FOCUS ⚡
• Competition: Intense from Palo Alto Networks, Zscaler, etc. 🔍
• Valuation: High P/E ratio may concern some investors 📉
• Regulatory Shifts: Potential new laws impacting data privacy ❄️
Navigating challenges in a dynamic landscape! 🛑
(6/9) – SWOT: STRENGTHS 💪
• Market Leader: Dominant in endpoint security 🥇
• Innovation: AI and ML-driven solutions keep it ahead 📊
• Financial Health: Strong cash position, no debt 🔧
Built to withstand cyber storms! 🏦
(7/9) – SWOT: WEAKNESSES & OPPORTUNITIES ⚖️
• Weaknesses: High valuation, competitive pressures 📉
• Opportunities: Growing demand for cloud security, new market segments 📈
Can it capitalize on the digital expansion? 🤔
(8/9) –📢Crowdstrike at $322—your investment move? 🗳️
• Bullish: $400+ soon, cyber threats fuel growth 🐂
• Neutral: Holding steady, balancing risks and rewards ⚖️
• Bearish: $280 drop, overvalued in a cooling market 🐻
Cast your vote below! 👇
(9/9) – FINAL TAKEAWAY 🎯
Crowdstrike’s $322 stance shows resilience 📈, but cautious investors eye valuation and competition 🌿. Dips are our DCA playground 💰. Grab ‘em low, ride the wave! Gem or bust?

$DG: Dollar General – Discount Dynamo or Bargain Bust?(1/9)
Good afternoon, folks! ☀️ NYSE:DG : Dollar General – Discount Dynamo or Bargain Bust?
NYSE:DG ’s at $82, riding a rocky retail road! Is this budget king stacking cash or just scraping by? Let’s rummage through the bins! 🔍
(2/9) – PRICE PERFORMANCE 📊
• Current Price: $ 82
• Recent Moves: Down 0.78% from Mar 7 close, per web data 📏
• Sector Vibe: Retail shaky, but discounts hold appeal 🌟
It’s a bumpy ride with a bargain twist! 🚛
(3/9) – MARKET POSITION 📈
• Market Cap: ~$18B (219.93M shares) 🏆
• Operations: 20,000+ stores, rural retail champ ⏰
• Trend: X posts hint at turnaround hopes 🎯
Tough, but planted firm in small towns! 🏡
(4/9) – KEY DEVELOPMENTS 🔑
• Analyst Takes: Bernstein’s $90 PT, per X 🔄
• Store Push: 575 new stores planned for 2025 🌍
• Market Mood: Mixed—soft sales vs. value focus 📋
Chugging along, eyes on the prize! 💪
(5/9) – RISKS IN FOCUS ⚠️
• Consumer Woes: Low-income pressure, per X 🔍
• Competition: Walmart, Dollar Tree crowding in 📉
• Margins: Profit dips spook, per web data ❄️
Risks stalk like aisle lurkers! 🕵️
(6/9) – SWOT: STRENGTHS 💪
• Scale: 20,000+ stores, rural reach 🥇
• Value Play: Budget shoppers’ haven 📊
• Growth: New store spree in 2025 🔧
A lean, mean discount machine! 🛒
(7/9) – SWOT: WEAKNESSES & OPPORTUNITIES ⚖️
• Weaknesses: Margin squeeze, soft sales 📉
• Opportunities: Reinvestment, consumer shift 📈
Can it turn pennies into profit? 🤔
(8/9) – 📢DG at $82, retail’s rough—your guess? 🗳️
• Bullish: $95+ soon, value shines 🐂
• Neutral: Flatline, risks weigh ⚖️
• Bearish: $70 crash, margins fade 🐻
Cast your lot below! 👇
(9/9) – FINAL TAKEAWAY 🎯
DG’s $82 stance shows grit 📈, but retail’s a grindstone 🌾. Volatility’s our sidekick—dips are DCA gems 💰. Snap ‘em up, rise steady! Paydirt or pyrite?

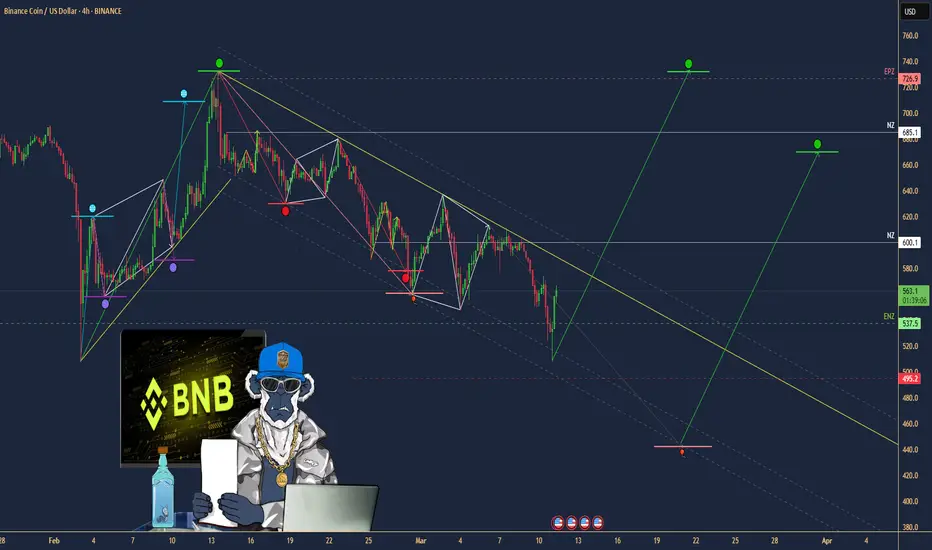
$BNB: Binance Coin – Crypto Rocket or Volatile Firecracker?(1/9)
Good Morning, TradingView! ☀️ CRYPTOCAP:BNB : Binance Coin – Crypto Rocket or Volatile Firecracker?
CRYPTOCAP:BNB ’s at $566—rocketing off recent highs or just fizzing out? With wild swings and big dreams, is it time to strap in or bail out? Let’s decode it! 🔍
(2/9) – PRICE PERFORMANCE 📊
• Current Price: $ 566 as of Mar 11, 2025 💰
• Recent Moves: Down 13.5% in an hour last night, per posts 📏
• Sector Vibe: Crypto volatility spiking, per market buzz 🌟
It’s a rollercoaster—hold tight! ⚡
(3/9) – MARKET POSITION 📈
• Market Cap: Around $82.5B (149.54M shares) 🏆
• Operations: Powers Binance ecosystem, top exchange ⏰
• Trend: Sentiment mixed, posts flag adoption 🎯
A heavyweight in crypto chaos! 🌍
(4/9) – KEY DEVELOPMENTS 🔑
• Earnings Echo: Q1 2025 beat estimates, per Mar 6 buzz 🔄
• Network Buzz: Record activity fuels optimism 🌐
• Market Reaction: Price yo-yoing, posts note caution 📋
Riding high, but bumpy! 💡
(5/9) – RISKS IN FOCUS ⚠️
• Volatility: 13.5% hourly drop spooks traders 🔍
• Competition: Rivals like Ethereum nip at heels 📉
• Macro Risks: Regulatory shadows loom ❄️
Tricky terrain ahead! 🕵️
(6/9) – SWOT: STRENGTHS 💪
• Ecosystem Might: Fuels Binance, top-tier exchange 🥇
• Adoption: Network humming, per chatter 📊
• Burns: Token scarcity drives value 🔧
A crypto beast with muscle! 🔒
(7/9) – SWOT: WEAKNESSES & OPPORTUNITIES ⚖️
• Weaknesses: Wild swings, regulatory heat 📉
• Opportunities: DeFi, GameFi growth beckon 📈
Can it blast off or stall out? 🤔
(8/9) –📢BNB at $566, wild ride—what’s your vibe? 🗳️
• Bullish: $650+ soon, adoption rules 🐂
• Neutral: Choppy but stable ⚖️
• Bearish: $500 crash, volatility bites 🐻
Holler below! 👇
(9/9) – FINAL TAKEAWAY 🎯
BNB’s $566 dance shows grit 📈, but volatility’s a wild card 🌫️. Dips? That’s our DCA sweet spot 💰. Snag low, aim high! Goldmine or gamble?
$BTC: Bitcoin – Digital Gold Rush or Crypto Rollercoaster?(1/9)
Good morning, folks! ☀️ CRYPTOCAP:BTC : Bitcoin – Digital Gold Rush or Crypto Rollercoaster?
With CRYPTOCAP:BTC at $82,352.34, is this the motherlode of digital wealth or a wild ride with no brakes? Let’s dig into the blockchain buzz! 🔍
(2/9) – PRICE PERFORMANCE 📊
• Current Price: $ 82,352.34 as of Mar 10, 2025 💰
• Recent Moves: Up 30%+ YTD, per web trends 📏
• Sector Trend: Crypto volatility reigns, X posts show mixed vibes 🌟
It’s a high-stakes game with big swings! ⚡
(3/9) – MARKET POSITION 📈
• Market Cap: $1.63T (based on 19.83M circulating supply) 🏆
• Status: King of crypto, 50%+ market dominance ⏰
• Trend: Whales scooping coins, per X chatter 🎯
Reigning supreme in the digital realm! 🌍
(4/9) – KEY DEVELOPMENTS 🔑
• Sentiment: X posts cheer GETTEX:82K support, ETF flows mixed 🔄
• Adoption: El Salvador adds BTC, strategic reserve talk grows 🌐
• Market Reaction: Price steady despite tariff fears 📋
Riding waves of hype and hope! 💡
(5/9) – RISKS IN FOCUS ⚠️
• Volatility: 5-10% daily swings not uncommon 🔍
• Regulation: Global crackdowns loom 📉
• Macro: Economic shifts could jolt crypto ❄️
High risk, high reward territory! 🕵️
(6/9) – SWOT: STRENGTHS 💪
• Dominance: 50%+ of crypto market 🥇
• Adoption: Nations, whales piling in 📊
• Scarcity: 19.83M of 21M coins mined 🔧
A heavyweight with staying power! 🔒
(7/9) – SWOT: WEAKNESSES & OPPORTUNITIES ⚖️
• Weaknesses: Wild price swings, regulatory haze 📉
• Opportunities: Institutional cash, global unrest boost 📈
Can it strike gold or stumble? 🤔
(8/9) – 📢 Bitcoin at $82,352.34—your bet? 🗳️
• Bullish: $100K+ by Q2, unstoppable 🐂
• Neutral: Sideways, risks weigh ⚖️
• Bearish: $70K crash, bubble bursts 🐻
Drop your vote below! 👇
(9/9) – FINAL TAKEAWAY 🎯
Bitcoin’s $82,352.34 marks a wild frontier 📈, with dominance shining through volatility 🌫️. Dips? That’s our DCA sweet spot 💰. Scoop low, ride high! Boom or bust?

$CY6U: CapitaLand India Trust – Bangalore Boom or Borrowing Bust(1/9)
Good afternoon, Tradingview! ☀️ SGX:CY6U : CapitaLand India Trust – Bangalore Boom or Borrowing Bust?
At 1.02 SGD, is this Indian office play a hidden gem or a debt-laden mirage? Revenue’s up, insiders are buying—let’s unpack the curry! 🔍
(2/9) – PRICE PERFORMANCE 📊
• Current Price: 1.02 SGD 💰
• Recent Moves: Modest gains in 2025, per trends 📏
• Sector Buzz: India’s office market heating up 🌟
It’s a slow simmer, but spice is brewing! 🔥
(3/9) – MARKET POSITION 📈
• Market Cap: Around 1.36B SGD (1,333.5M shares) 🏆
• Operations: Office projects, Bangalore expansion ⏰
• Trend: Revenue hit S$278M, up from S$234M 🎯
Rooted in India’s growth soil! 🌱
(4/9) – KEY DEVELOPMENTS 🔑
• Expansion: Bangalore office buy locked in 🔄
• Insider Buying: Confidence despite earnings dip ahead 🌏
• Sentiment: Cautious cheers, per market vibes 📋
Scaling up, but debt’s the side dish! 🍛
(5/9) – RISKS IN FOCUS ⚠️
• Earnings Drop: 39% decline forecast over 3 years 🔍
• Borrowing: Heavy reliance raises eyebrows 📉
• Global Noise: China stimulus, trade jitters ❄️
Spicy risks on the horizon! 🌩️
(6/9) – SWOT: STRENGTHS 💪
• Revenue Jump: S$278M from S$234M last year 🥇
• India Play: Bangalore’s office boom 📊
• Insider Faith: Buying signals grit 🔧
A curry with some kick! 🍲
(7/9) – SWOT: WEAKNESSES & OPPORTUNITIES ⚖️
• Weaknesses: Debt load, earnings slide ahead 📉
• Opportunities: India’s resilience, market gaps 📈
Can it spice up profits or just heat debt? 🤔
(8/9) – 📢At 1.02 SGD, revenue up, insiders in—your vibe? 🗳️
• Bullish: 1.20 SGD soon, India shines 🐂
• Neutral: Flat, risks weigh ⚖️
• Bearish: 0.90 SGD, debt bites 🐻
Drop your take below! 👇
(9/9) – FINAL TAKEAWAY 🎯
CapitaLand’s Bangalore bet and S$278M revenue pop tasty 📈, but debt and a 39% earnings dip loom 🌫️. Volatility’s our mate—dips are DCA spice 💰. Scoop low, rise steady! Gold or ghee?

$AVGO: Broadcom – AI Chip Powerhouse or Tariff Tightrope?(1/9)
Good morning, crew! ☀️ NASDAQ:AVGO : Broadcom – AI Chip Powerhouse or Tariff Tightrope?
With NASDAQ:AVGO at $194.94 after a Q1 earnings slam dunk, is this semiconductor star riding the AI wave to glory or teetering on trade war woes? Let’s unpack the circuits! 🔍
(2/9) – PRICE PERFORMANCE 📊
• Current Price: $ 194.94 as of Mar 10, 2025 💰
• Q1 2025: Revenue $14.92B (up 23% YoY), EPS $1.60 📏
• Movement: Up 10% post-earnings Mar 6, +8.6% Mar 7 🌟
It’s buzzing like a chip factory on overdrive! ⚡
(3/9) – MARKET POSITION 📈
• Market Cap: ~$93.5B (151.62M shares) 🏆
• Operations: AI chips, software solutions ⏰
• Trend: 42% of 2024 revenue from software, per web data 🎯
A heavyweight in the AI silicon ring! 🌐
(4/9) – KEY DEVELOPMENTS 🔑
• Earnings: Q1 beat with $14.92B, Q2 forecast tops estimates 🔄
• AI Boom: Custom chips fuel hyperscaler demand 🌍
• Sentiment: Shares rallied, per Mar 6-7 posts 📋
Thriving, wired for the future! 💡
(5/9) – RISKS IN FOCUS ⚠️
• Tariffs: Trade uncertainties loom, per web reports 🔍
• Competition: Nvidia, Marvell in the race 📉
• Valuation: Premium pricing raises eyebrows ❄️
High stakes, but risks are on the radar! 🕵️
(6/9) – SWOT: STRENGTHS 💪
• Q1 Win: $14.92B revenue, EPS $1.60 beat 🥇
• AI Edge: 77% AI revenue growth in Q1 📊
• Forecast: Q2 sales outlook shines 🔧
Powered up for the AI era! 🔋
(7/9) – SWOT: WEAKNESSES & OPPORTUNITIES ⚖️
• Weaknesses: Tariff risks, high valuation 📉
• Opportunities: 18% earnings growth projected 📈
Can it outrun trade clouds and soar? 🤔
(8/9) – 📢Broadcom at $194.94, AI chips sizzling—your vibe? 🗳️
• Bullish: $220+ by June, AI rules 🐂
• Neutral: Stable, tariffs balance ⚖️
• Bearish: $170 slide, risks bite 🐻
Drop your pick below! 👇
(9/9) – FINAL TAKEAWAY 🎯
Broadcom’s $14.92B Q1 haul screams AI strength 📈, but tariff shadows hover 🌫️. Volatility’s our sidekick—dips are DCA dynamite 💰. Snap ‘em up, ride the surge! Goldmine or gamble?

$SUI: SUI Blockchain’s Token – Poised for Growth or Overhyped?(1/9)
Good morning, crypto enthusiasts! ☀️ CRYPTOCAP:SUI : SUI Blockchain’s Token – Poised for Growth or Overhyped?
With SUI at $2.70 , is this Layer 1 blockchain’s token set to dominate the crypto market or just another flash in the pan? Let’s dive into the digital realm and find out! 🔍
(2/9) – PRICE PERFORMANCE 📊
• Current Price: $ 2.70 as of Mar 7, 2025 💰
• Historical Context: Launched May 3, 2023, with significant growth in 2024 📏
• Sector Trend: Blockchain gaming and NFTs driving demand 🌟
It’s a hot commodity in the crypto space! ⚙️
(3/9) – MARKET POSITION 📈
• Market Cap: Approx $1.2B (based on 1B tokens) 🏆
• Operations: Layer 1 blockchain with focus on speed and scalability ⏰
• Trend: Partnerships with gaming studios, NFT platforms boosting adoption 🎯
Solid, with a clear path to utility and growth! 🚀
(4/9) – KEY DEVELOPMENTS 🔑
• Recent Partnerships: Collaborations with gaming firms like Mythical Games 🔄
• NFT Sales: Robust growth in NFT transactions on SUI blockchain 🌍
• Market Reaction: Positive sentiment post-launch and recent updates 📋
Thriving, with a focus on real-world applications! 💡
(5/9) – RISKS IN FOCUS ⚡
• Competition: Strong rivals like Solana, Avalanche in the L1 space 🔍
• Regulatory Challenges: Crypto regulations could impact growth 📉
• Volatility: Crypto market’s inherent swings affect price ❄️
Navigating these choppy waters is key! 🛑
(6/9) – SWOT: STRENGTHS 💪
• Performance: High-speed transactions, ideal for gaming and more 🥇
• Partnerships: Growing ecosystem with gaming and NFT projects 📊
• Scalability: Designed for mass adoption, per developers’ claims 🔧
Got the goods to stand out in the blockchain race! 🏦
(7/9) – SWOT: WEAKNESSES & OPPORTUNITIES ⚖️
• Weaknesses: New project, unproven in long-term stability 📉
• Opportunities: Expanding into metaverse, AI integration 📈
Can it scale and secure its position or get lost in the noise? 🤔
(8/9) –📢SUI at $2.70—your take? 🗳️
• Bullish: $5+ by end of 2025, gaming boom drives growth 🐂
• Neutral: Steady growth, risks balanced ⚖️
• Bearish: $0.50 by year-end, competition overtakes 🐻
Chime in below! 👇
(9/9) – FINAL TAKEAWAY 🎯
SUI’s at $2.70, with a promising future in blockchain gaming and NFTs. Volatility’s a given, but its strengths could lead to significant gains. DCA on dips, ride the wave! Gem or bust?

$ZS: Zscaler – Cloud Security Titan or Overhyped Hype Train?(1/9)
Good afternoon, folks! ☀️ NASDAQ:ZS : Zscaler – Cloud Security Titan or Overhyped Hype Train?
With NASDAQ:ZS soaring after smashing earnings, is this cybersecurity champ locking down profits or just riding a digital wave? Let’s crack the code! 🔍
(2/9) – PRICE PERFORMANCE 📊
• Current Price: Up post-earnings, exact $ TBD 💰
• Recent Results: Q1 2025 earnings beat estimates, per X buzz 📏
• Sector Trend: Cloud security demand surging 🌟
It’s a hot streak in a hotter market! ⚡
(3/9) – MARKET POSITION 📈
• Market Cap: Strong, based on 151.62M shares 🏆
• Operations: Leader in Zero Trust security ⏰
• Trend: posts hail robust growth, per Mar 6 chatter 🎯
Solid, shielding the digital frontier! 🌍
(4/9) – KEY DEVELOPMENTS 🔑
• Earnings Win: Q1 2025 topped forecasts, guidance raised 🔄
• Cloud Security: Demand spikes amid cyber threats 🌐
• Market Reaction: Stock jumped📋
Thriving, as hackers keep the world on edge! 💡
(5/9) – RISKS IN FOCUS ⚠️
• Valuation: High P/E could spook investors 🔍
• Competition: Crowded field with CrowdStrike, Palo Alto 📉
• Macro Shifts: Economic dips might slow spending ❄️
Watch out, risks lurk in the shadows! 🕵️
(6/9) – SWOT: STRENGTHS 💪
• Earnings Beat: Q1 2025 growth shines 🥇
• Market Lead: Zero Trust pioneer 📊
• Demand: Cloud security’s red-hot 🔧
Locked and loaded for the cyber age! 🔒
(7/9) – SWOT: WEAKNESSES & OPPORTUNITIES ⚖️
• Weaknesses: High valuation, competition pressures 📉
• Opportunities: Rising cyber threats fuel expansion 📈
Can it secure the bag or get hacked by rivals? 🤔
(8/9) – 📢Zscaler’s riding high post-earnings—your call? 🗳️
• Bullish: $250+ by summer, cyber’s king 🐂
• Neutral: Holding steady, risks loom ⚖️
• Bearish: $180 drop, hype fades 🐻
Vote below! 👇
(9/9) – FINAL TAKEAWAY 🎯
Zscaler’s Q1 2025 earnings pop signals strength 📈, but high stakes mean volatility’s a shadow friend 🌫️. Dips? That’s our DCA jackpot 💰. Buy low, soar high! Treasure or trap?

$NIFTY: Nifty 50 – India’s Market Meltdown or Hidden Gem?(1/9)
Good Morning, folks! ☀️ NSE:NIFTY : Nifty 50 – India’s Market Meltdown or Hidden Gem?
Gift Nifty’s at 22,555, down 65 points, and the index is off 13% since October 2024! Is this a crash landing or a golden ticket in disguise? Let’s unpack the chaos! 🔍
(2/9) – PRICE PERFORMANCE 📊
• Gift Nifty: 22,555, down 65 points (Mar 6, 2025) 💰
• Recent Trend: 13% drop from Oct 2024 highs 📏
• Sector Mood: Autos, real estate dragging, per web reports 🌩️
It’s a bumpy ride, but bargains might be brewing! 🔧
(3/9) – MARKET POSITION 📈
• Index Weight: 50 top Indian firms, 65% of NSE market cap 🏅
• Scope: Spans 13 sectors, from banks to tech ⏳
• Trend: Bearish streak persists, down 13% since Oct 🎯
Still a heavyweight, but feeling the squeeze! 🌐
(4/9) – KEY DEVELOPMENTS 🔑
• Earnings Slowdown: Growth at 5%, down from 20%+ 🔄
• Macro Woes: U.S. tariffs, trade tensions spook investors 🌍
• Market Vibe: Gift Nifty signals a sour start 📋
Tough times, but sectors might shine through! 💡
(5/9) – RISKS IN FOCUS ⚡
• Geopolitics: U.S. tariff threats hit exports 🔍
• Sector Slump: Autos, real estate under pressure 📉
• Volatility: Bearish trend grips tight 🌪️
Rough waters ahead, but storms pass! 🛡️
(6/9) – SWOT: STRENGTHS 💪
• Diversity: 13 sectors, broad economic play 🏆
• Scale: Tracks India’s biggest players 📈
• Value: Potentially undervalued, per web buzz 🔩
A battered champ with fight left! 💼
(7/9) – SWOT: WEAKNESSES & OPPORTUNITIES ⚖️
• Weaknesses: 5% earnings growth, macro drag 📉
• Opportunities: Sector plays in banks, tech shine 📈
Can it dodge the punches and rally? 🤔
(8/9) – 📢Nifty at 22,555 (Gift), down 13%—your call? 🗳️
• Bullish: $24K soon, undervalued steal 🦬
• Neutral: Flatline, risks offset ⚖️
• Bearish: $20K next, bears rule 🐻
Vote below! 👇
(9/9) – FINAL TAKEAWAY 🎯
Nifty’s 13% slide and $116 Gift price signal trouble 📉, but undervalued sectors tease upside 🌱. Volatility’s our mate—dips are DCA fuel 🔥. Buy low, aim high! Hit or miss?

$MRNA: Moderna – mRNA Magic or Biotech Bubble?(1/9)
Good afternoon, folks! ☀️ NASDAQ:MRNA : Moderna – mRNA Magic or Biotech Bubble?
CEO drops $5M on shares, sparking a 9% surge—is this a biotech rocket or a hot air balloon ready to pop? Let’s crack the code! 🔍
(2/9) – PRICE PERFORMANCE 📊
• Current Trend: Up 9% after CEO’s $5M buy on Mar 5, 2025 💰
• Context: Biotech’s a rollercoaster—posts on X show optimism 📈
• Sector Vibe: Volatile, but insider faith lifts spirits 🌈
It’s a wild climb—buckle up! ⚡
(3/9) – MARKET POSITION 📈
• Market Cap: Around $12B (based on 384M shares, est.) 🏅
• Operations: mRNA pioneer, vaccines to cancer therapies ⏳
• Trend: CEO’s move signals undervaluation hope 🎯
Solid player in the biotech jungle! 🌋
(4/9) – KEY DEVELOPMENTS 🔑
• Insider Buying: CEO’s $5M grab on Mar 5, 2025 🔄
• Buzz: Posts on X tie surge to leadership confidence 🌐
• Reaction: Market cheers, up 9% in a blink 📣
Risin’ like dough in a warm oven! 🔥
(5/9) – RISKS IN FOCUS ⚠️
• Volatility: Biotech swings wild amid macro uncertainty 🔎
• Policy: Healthcare shifts could sting 📉
• Pipeline: New products unproven, per X chatter 🌬️
High stakes, high drama! 🎭
(6/9) – SWOT: STRENGTHS 💪
• Innovation: mRNA tech reshapes medicine 🏆
• Confidence: CEO’s $5M bet screams belief 📊
• Legacy: COVID vaccine king, still swinging ⚒️
A biotech beast with bite! 🐺
(7/9) – SWOT: WEAKNESSES & OPPORTUNITIES ⚖️
• Weaknesses: Volatility, macro jitters hit hard 📉
• Opportunities: New mRNA goodies, partnerships loom 📈
Can it brew more magic or fizzle out? 🧪
(8/9) – 📢 Stock up 9% after CEO’s $5M buy—your call? 🗳️
#
• Bullish: $50+ soon, biotech boom 🚀
• Neutral: Holding steady, risks weigh ⚖️
• Bearish: $25 looms, bubble bursts 🐻#
Drop your vote below! 👇
(9/9) – FINAL TAKEAWAY 🎯
Moderna’s 9% pop on insider buying hints at hidden gems 📈, but biotech’s a stormy sea 🌊. Dips are our playground—DCA heaven 💸. Snag ‘em cheap, ride the wave! Winner or wild card?

$TGT: Target Corporation – Retail Titan or Fading Star?(1/9)
Good evening, shoppers! 🌙 NYSE:TGT : Target Corporation – Retail Titan or Fading Star?
Target’s at $116 on March 4, 2025—is this a golden ticket or a clearance rack trap? Let’s unpack the cart and find out! 🔧
(2/9) – PRICE PERFORMANCE 📊
• Current Price: $ 116 as of Mar 4, 2025 🤑
• Past Peek: Down 20% from $145.65 earlier this month 📉
• Sector Vibe: Retail’s feeling the squeeze, folks 🎮
It’s a bumpy ride, but deals might be hiding! 🛠️
(3/9) – MARKET POSITION 📈
• Market Cap: Roughly $53.15B (458.21M shares) 🏬
• Footprint: Around 1,950 stores, online sales popping 📡
• Trend: Brand loyalty high, but rivals are circling 🛡️
Still a heavyweight in the retail ring! 🏋️♀️
(4/9) – KEY DEVELOPMENTS 🔑
• Retail Scene: Spending’s tight, consumers picky 📅
• Digital Gains: E-commerce up, per past trends 🖥️
• Market Buzz: $116 hints at cautious buyers 🎤
Pivoting fast, but aisles are jammed! 🧭
(5/9) – RISKS IN FOCUS ⚠️
• Rivals: Walmart, Amazon playing hardball 🚨
• Economy: Inflation biting, tariffs looming 💸
• Swings: Retail stocks dance to a wild beat 🎶
Rough waters, but storms pass! 🌪️
(6/9) – SWOT: STRENGTHS 💥
• Name Value: Trendy goods, solid rep 💎
• Reach: 1,950+ stores, wide net 🗺️
• Online Edge: Digital sales climbing 📱
Loaded with ammo for the retail fight! 🔥
(7/9) – SWOT: WEAKNESSES & OPPORTUNITIES 🧐
• Weaknesses: $116 shows hesitation, margins tight 📋
• Opportunities: Push Target Circle, grow e-sales 🚀
Can it snag the prize or just scrape by? 🤷♂️
(8/9) – 📢Target’s $116, retail’s shaky—your call? 🗳️
• Bullish: $130+ soon, undervalued 🚀
• Neutral: Holding steady 🚬
• Bearish: $100 coming, trouble ahead 🕳️
Drop your vote below! 👇
(9/9) – FINAL TAKEAWAY 🎯
Target’s $116 price paints a shaky picture 📈, but its brand’s a rock 🌎. Swings are our playground—dips turn into DCA wins 💰. Buy low, aim high! Hit or miss?

$ADA: Cardano’s Quiet Climb – Ready to Roar or Still Crawling?(1/9)
Good afternoon, crypto enthusiasts! 🌙 Cardano ( CRYPTOCAP:ADA ): Blockchain’s Steady Eddie – Can It Break Out?
ADA’s chugging along at $0.84, with new dApp launches and partnerships. Is it time to stake or wait for a dip? Let’s dive in! 🔍
(2/9) – PRICE PERFORMANCE 📊
• Recent Trend: Holding at $0.84, up from last month’s peak of $0.82 📉
• 2025 Context: New dApp activity and African expansion driving interest 📏
• Sector Trend: Crypto market recovering from February’s 20.57% crash, but volatility persists 🌟
It’s a steady performer, but can it break out? ⚙️
(3/9) – MARKET POSITION 📈
• Ranking: Top 10 cryptocurrency by market cap, per CoinMarketCap 🏆
• Use Case: Smart contract platform with a focus on scalability and security ⏰
• Trend: Increasing adoption in emerging markets, particularly Africa 🎯
Firm, with a solid foundation and growth potential! 🚀
(4/9) – KEY DEVELOPMENTS 🔑
• Market Reaction: Shares steady, with analysts optimistic about long-term growth 📋
Cookin’ up something big, but the market’s cautious! 💡
(5/9) – RISKS IN FOCUS ⚡
• Competition: Ethereum and Solana offer stiff competition with more established ecosystems 🕳️
• Regulatory: Crypto regulations could impact adoption and growth ⚖️
• Volatility: Crypto market’s unpredictable swings can hit hard ❄️
Tread carefully, but the path looks promising! 🛑
(6/9) – SWOT: STRENGTHS 💪
• Scalability: Hydra and other upgrades promise high throughput and low fees 📊
• Community: Strong, academic-driven community with a focus on long-term development 🥇
• Partnerships: Growing presence in emerging markets, especially Africa 🌍
Got the building blocks for success! 🏦
(7/9) – SWOT: WEAKNESSES & OPPORTUNITIES ⚖️
• Weaknesses: Slower adoption compared to competitors, limited dApp activity 📉
• Opportunities: Expanding into new markets, new dApp developments, and regulatory clarity in some regions 📈
Can it catch up and surpass? 🤔
(8/9) –📢ADA’s at $0.45, with mixed market signals—your take? 🗳️
• Bullish: $1 soon, fundamentals are strong 🐂
• Neutral: Steady, wait for clearer skies ⚖️
• Bearish: Under $0.30, competition’s too fierce 🐻
Vote below! 👇
(9/9) – FINAL TAKEAWAY 🎯
ADA’s holding its ground at $0.83, with promising developments but market headwinds. Volatility’s our friend—dips are DCA gold 💰. Grab ‘em low, ride high! Gem or bust?
