$XRP: Ripple’s Rocket – Ready to Soar or Facing Turbulence?(1/9)
Good evening, everyone! 🌙 CRYPTOCAP:XRP : Ripple’s Rocket – Ready to Soar or Facing Turbulence?
CRYPTOCAP:XRP ’s up 8.4% despite a crypto crash, with SEC rumors fueling hope—but will adoption or regulation steer this rocket? Let’s dive in! 🔍
(2/9) – PRICE PERFORMANCE 📊
• Recent Trend: Gained 8.4% despite a crypto market down 20.57% in Feb, per U.Today 📈
• 2025 Context: Speculation of SEC appeal dismissal boosts sentiment 📏
• Sector Trend: Crypto market down, but CRYPTOCAP:XRP bucks the trend 🌟
It’s a fighter, shaking off the bears! ⚙️
(3/9) – MARKET POSITION 📈
• Ranking: Remains a top 10 cryptocurrency, per CoinMarketCap 🏆
• Use Case: Leading in cross-border payments with RippleNet ⏰
• Trend: Regulatory clarity hopes rise, potentially unlocking more adoption 🎯
Firm, a key player in the altcoin arena! 🚀
(4/9) – KEY DEVELOPMENTS 🔑
• SEC Case: Closed-door meeting Feb 27 fuels dismissal talk, per Ripple CEO’s X post 🔄
• Adoption: RippleNet partnerships expand, with new banks joining for faster payments 🌍
• Market Reaction: Up 8.4% amid market turmoil, showing resilience 📋
Adapting, with legal and adoption catalysts! 💡
(5/9) – RISKS IN FOCUS ⚡
• Regulation: SEC case uncertainty persists, appeal process ongoing 🕳️
• Market Volatility: Crypto market’s unpredictable swings can hit hard ❄️
• Competition: Other blockchain platforms vying for cross-border payment dominance ⚖️
Tough, but risks are part of the game! 🛑
(6/9) – SWOT: STRENGTHS 💪
• Resilience: Up 8.4% when others fall, showing strong investor confidence 🥇
• Utility: RippleNet’s fast cross-border payments attract banks and institutions 📊
• Community: Robust support from holders and Ripple’s strategic partnerships 🔧
Got fuel in the tank! 🏦
(7/9) – SWOT: WEAKNESSES & OPPORTUNITIES ⚖️
• Weaknesses: SEC case not fully resolved, adoption slower than hoped 📉
• Opportunities: Potential ETF approval, expanding CBDC projects, and new partnerships 📈
Can it break free and soar? 🤔
(8/9) – 📢 CRYPTOCAP:XRP ’s up 8.4% despite market crash, SEC buzz grows, your take? 🗳️
• Bullish: $3+ soon, legal win sparks rally 🐂
• Neutral: Steady, risks balance ⚖️
• Bearish: Below $2, regulation stalls 🐻
Chime in below! 👇
(9/9) – FINAL TAKEAWAY 🎯
CRYPTOCAP:XRP ’s resilience amid a market crash shows its mettle 📈, but SEC uncertainty and competition pose challenges 🌿. Volatility’s our friend—dips are DCA gold 💰. Grab ‘em low, climb like pros! Gem or bust? S
DCA

TSMC: AI Chip Titan – Still the King or Facing New Challengers?Good morning, everyone! ☀️ TSMC: AI Chip Titan – Still the King or Facing New Challengers?
(1/9)
TSMC’s riding the AI wave with record Q4 2024 profits, but with U.S.-China curbs and fab delays, is this semiconductor king untouchable or at a crossroads? Let’s unpack it! 🔍
(2/9) – PRICE PERFORMANCE 📊
• Q4 2024: Net income up 57% to $11.4B, revenue climbed 39% 💰
• Full Year 2024: Revenue hit $87.1B, up 34% from 2023 📏
• Sector Trend: AI chip demand soaring, per Reuters 🌟
It’s a powerhouse, driven by tech’s hunger! ⚙️
(3/9) – MARKET POSITION 📈
• Market Share: Over 60% of global foundry market 🏆
• Clients: Apple, Nvidia, AMD—big names rely on ‘em ⏰
• Trend: Expanding fabs in U.S., Japan, Germany 🎯
Firm, holding the throne but not without battles! 🚀
(4/9) – KEY DEVELOPMENTS 🔑
• Q4 Earnings: Record $11.4B profit, per Jan 16 Reuters 🔄
• Expansion: Arizona fab faces delays, full ops by 2027? 🌍
• Market Reaction: Shares up 81% in 2024, still strong 📋
Adapting, with global eyes on its moves! 💡
(5/9) – RISKS IN FOCUS ⚡
• Geopolitics: U.S.-China export curbs hit demand 🔍
• Costs: U.S. fab chips 50% pricier than Taiwan 📉
• Talent: Lack of skilled U.S. workers slows growth ❄️
Tough, but risks loom large! 🛑
(6/9) – SWOT: STRENGTHS 💪
• Profit Surge: 57% net income jump in Q4 2024 🥇
• Tech Lead: 5nm mass production, 3nm in R&D 📊
• Client Base: Powers Apple, Nvidia, more 🔧
Got silicon in the tank! 🏦
(7/9) – SWOT: WEAKNESSES & OPPORTUNITIES ⚖️
• Weaknesses: High U.S. fab costs, talent gaps 📉
• Opportunities: AI chip demand, new fabs in Japan, EU 📈
Can it keep the lead amid global shifts? 🤔
(8/9) – 📢TSMC’s Q4 profit up 57%, AI booming, your take? 🗳️
• Bullish: Still the king, long-term winner 🐂
• Neutral: Steady, but risks weigh ⚖️
• Bearish: Curbs and costs slow growth 🐻
Chime in below! 👇
(9/9) – FINAL TAKEAWAY 🎯
TSMC’s record profits signal AI dominance 📈, but U.S.-China curbs and fab delays add caution 🌿. Volatility’s our friend—dips are DCA gold 💰. Grab ‘em low, climb like pros! Gem or bust?

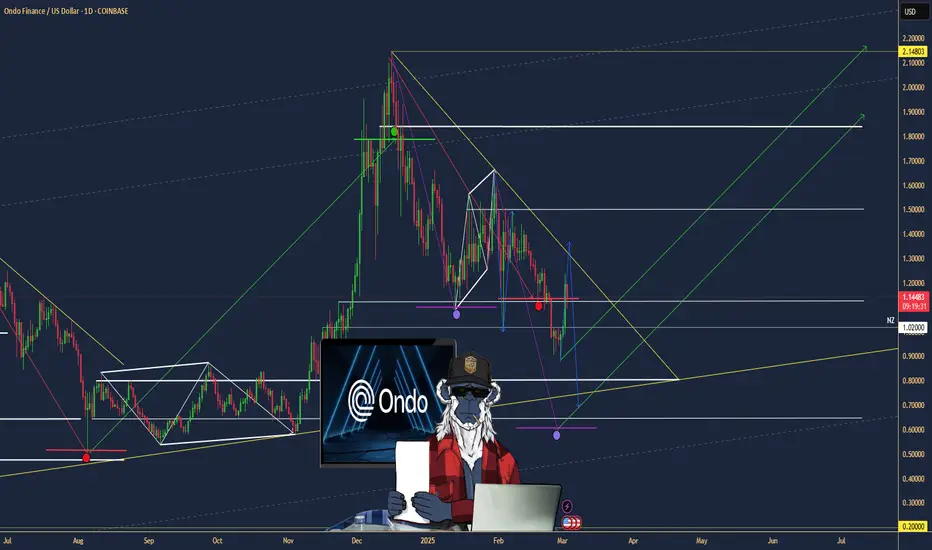
$ONDO: Ondo Finance – Tokenizing the Future or Facing Roadblocks
(1/9)
Good morning, champs! ☀️ LSE:ONDO : Ondo Finance – Tokenizing the Future or Facing RWA Roadblocks?
Ondo Finance just joined Mastercard’s Multi-Token Network, aiming to tokenize U.S. Treasuries! But with market volatility, is this RWA gem a buy or a wait? Let’s dive in! 🔍
(2/9) – PRICE PERFORMANCE 📊
• Recent Trend: Transaction volume spiked to 400M in Jan 2025, now ~300M 💰
• Market Insight: Up 1.6% recently (Daily Hodl, Feb 2025) 📏
• Sector: RWA tokenization surging with TradFi interest 🌟
It’s buzzing in the DeFi space! ⚙️
(3/9) – MARKET POSITION 📈
• Market Cap: Not specified; holds 40% of tokenized securities market 🏆
• Holdings: U.S. Treasuries, bonds via USDY, OUSG tokens ⏰
• Trend: Whales hold 88% of tokens, per IntoTheBlock 🎯
Firm, leading RWA tokenization! 🚀
(4/9) – KEY DEVELOPMENTS 🔑
• Partnership: Joined Mastercard MTN as first RWA provider (Feb 26, 2025) 🔄
• Expansion: Teamed with World Liberty Financial for RWAs 🌍
• Market Reaction: Steady growth in transaction volume 📋
Adapting, bridging TradFi and DeFi! 💡
(5/9) – RISKS IN FOCUS ⚡
• Volatility: Crypto market swings could hit token value 🔍
• Regulation: Compliance hurdles in tokenized assets 📉
• Concentration: High whale ownership (88%) risks dumps ❄️
Tough, but risks loom! 🛑
(6/9) – SWOT: STRENGTHS 💪
• RWA Leader: 40% tokenized securities market share 🥇
• Big Backers: BlackRock, Coinbase Ventures support 📊
• Tech Edge: Tokenizing U.S. Treasuries for DeFi 🔧
Got fuel in the tank! 🏦
(7/9) – SWOT: WEAKNESSES & OPPORTUNITIES ⚖️
• Weaknesses: High whale concentration, market volatility 📉
• Opportunities: TradFi integration, DeFi yield growth 📈
Can it tokenize to the moon? 🤔
(8/9) – 📢Transaction volume at 300M, Mastercard partnership live, your take? 🗳️
• Bullish: $2 soon, TradFi loves it 🐂
• Neutral: Steady, risks balance ⚖️
• Bearish: $0.90 looms, whales dump 🐻
Chime in below! 👇
(9/9) – FINAL TAKEAWAY 🎯
SMCI’s transaction volume and TradFi ties scream potential 📈, but whale concentration adds caution 🌿. Volatility’s our buddy—dips are DCA gold 💰. Grab ‘em low, climb like pros! Gem or bust?
$SMCI: Super Micro Computer – AI Server Surge or a Pit Stop?
NASDAQ:SMCI : Super Micro Computer – AI Server Surge or a Pit Stop?
AI infrastructure’s hotter than a July barbecue, with revenue up 110% to $14,989.2 million in 2024! But with internal control concerns, is this tech beast charging up or taking a breather? Let’s dive in!
(1/9)
Good morning, everyone! ☀️ NASDAQ:SMCI : Super Micro Computer – AI Server Surge or a Pit Stop?
AI infrastructure’s hotter than a July barbecue, with revenue up 110% to $14,989.2 million in 2024! But with internal control concerns, is this tech beast charging up or taking a breather? Let’s dive in! 🔍
(2/9) – PRICE PERFORMANCE 📊
• Fiscal 2024: Net sales soared 110.4% to $14,989.2 million 💰
• Server Systems: Up 115.9%, GPU servers leading the charge 📏
• Sector Trend: AI demand’s skyrocketing 🌟
It’s a wild ride, fueled by AI’s hunger! ⚙️
(3/9) – MARKET POSITION 📈
• Market Cap: $2.4B, based on shares outstanding 🏆
• Holdings: Servers, storage, and AI solutions ⏰
• Trend: International sales steady at 32%, showing global appetite 🎯
Firm, carving a niche in AI infrastructure! 🚀
(4/9) – KEY DEVELOPMENTS 🔑
• 10-K Filing: Dropped Feb 25, 20
25, dodged NASDAQ delisting 🔄
• Revenue Driver: GPU servers for AI workloads 🌍
• Market Reaction: Shares jumped 19.8% after-hours 📋
Adapting, with investors cheering the comeback! 💡
(5/9) – RISKS IN FOCUS ⚡
• Internal Controls: Audit flagged issues, per Feb 25 filing 🔍
• Competition: Big players in AI server space 📉
• Volatility: High-growth sectors swing hard ❄️
Tough, but risks loom! 🛑
(6/9) – SWOT: STRENGTHS 💪
• Revenue Boom: 110% growth, $14,989.2 million in sales 🥇
• AI Focus: GPU servers crushing it 📊
• Global Reach: 32% international sales 🔧
Got rocket fuel in the tank! 🏦
(7/9) – SWOT: WEAKNESSES & OPPORTUNITIES ⚖️
• Weaknesses: Internal control concerns, per audit 📉
• Opportunities: AI infrastructure demand keeps soaring 📈
Can it fix the cracks and ride the wave? 🤔
(8/9) – 📢 SMCI’s revenue up 110%, with AI demand exploding, your take? 🗳️
• Bullish: Shares to $50+ soon, AI’s unstoppable 🐂
• Neutral: Steady, risks balance growth ⚖️
• Bearish: $35 looms, controls spook 🐻
Chime in below! 👇
(9/9) – FINAL TAKEAWAY 🎯
SMCI’s revenue surge to $14,989.2 million screams AI potential 📈, but control issues add a pinch of caution 🌿. Volatility’s our friend—dips are DCA gold 💰. Grab ‘em low, climb like pros! Gem or bust?

$LIT: EV's Lithium-Powered ETF – Charging Up or Running on EmptyAMEX:LIT : EV's Lithium-Powered ETF – Charging Up or Running on Empty?
EV demand is up 35% in 2023, and lithium prices are up 8% in 2025 so far. But AMEX:LIT is at $40.82, down from last year. Is it time to buy, hold, or sell? Let's dive in.
(1/9)
Good morning, everyone! ☀️EV demand is up 35% in 2023, and lithium prices are up 8% in 2025 so far. But AMEX:LIT is at $40.82, down from last year. Is it time to buy, hold, or sell? Let's dive in. 🔍
(2/9) – PRICE PERFORMANCE 📊
• Current Price: $ 40.82 💰
• Sector Trend: EV sales globally strong (35% growth in 2023, IEA) 🌟
It’s volatile, with EV growth as a tailwind! ⚙️
(3/9) – MARKET POSITION 📈
• Market Cap: Approximately $ 1.37B (based on $ 40.82 price and 33.5M shares, per Apr 30, 2024, data) 🏆
• Holdings: 40 stocks, top include Albemarle, Tesla (per Global X ETFs) ⏰
• Trend: Lithium demand tied to EV penetration, per IEA data 🎯
Firm, riding the battery wave! 🚀
(4/9) – KEY DEVELOPMENTS 🔑
• EV Demand: Continued rise in 2025, per general expectation and IEA trends 🔄
• Lithium Prices: Mixed, with spot prices varying; ETF at $ 40.82 reflects market conditions 🌍
• Market Reaction: Reflects current market dynamics, no specific Mar 3 data 📋
Adapting, EV surge drives interest! 💡
(5/9) – RISKS IN FOCUS ⚡
• Oversupply: Fears may cap lithium gains, per industry reports 🔍
• Competition: New battery tech could shift demand, per industry reports 📉
• Volatility: Lithium prices historically swing, per Reuters 2023 data ❄️
Tough, but risks loom! 🛑
(6/9) – SWOT: STRENGTHS 💪
• EV Growth: Demand for lithium batteries rising, per IEA 2023 data (35% global sales increase) 🥇
• Diversification: 40 holdings across mining, battery tech, per Global X ETF 📊
• Sector Leader: Exposure to Albemarle, Tesla, per Global X ETF 🔧
Got fuel in the tank! 🏦
(7/9) – SWOT: WEAKNESSES & OPPORTUNITIES ⚖️
• Weaknesses: Price volatility, current price down from last known, oversupply fears 📉
• Opportunities: EV sales growth, potential lithium price recovery based on demand, per IEA trends 📈
Can it capitalize on demand? 🤔
(8/9) – 📢 AMEX:LIT ’s at $ 40.82, EV demand climbing, your take? 🗳️
• Bullish: Price to rise with EV surge 🐂
• Neutral: Steady, risks balance ⚖️
• Bearish: Oversupply or other factors cap gains 🐻
Chime in below! 👇
(9/9) – FINAL TAKEAWAY 🎯
AMEX:LIT ’s EV demand drives potential 📈, but current price at $ 40.82 reflects market caution. Volatility bites, yet dips are our DCA gold 💰. We grab ‘em low, climb like pros! Gem or bust?

Trump Media ($DJT) – Truth Social’s Latest MovesTrump Media ( NASDAQ:DJT ) – Truth Social’s Latest Moves
(1/9)
Good afternoon, TradingView! 🌞 Trump Media ( NASDAQ:DJT ) is trending 📈, last at $ 29.23 per Feb 18, 2025, close (Yahoo Finance), down 3.82% that day. Q4 2024 showed a $ 401M loss, yet cash reserves hit $ 777M 🌿. Let’s dive into this social media play! 🔍
(2/9) – PRICE PERFORMANCE 📊
• Feb 18, 2025: $ 29.23, down 3.82% from $ 30.39 💰
• Q4 2024: Revenue at $ 1M, down from $ 1.1M year prior 📏
• Full Year 2024: $ 3.6M sales, $ 401M net loss 🌟
It’s volatile, with cash as a lifeline! ⚙️
(3/9) – MARKET POSITION 📈
• Market Cap: $ 6.43B as of Feb 18, 2025, per Yahoo 🏆
• User Base: 9M Truth Social sign-ups as of Feb 2024 ⏰
• Trend: Exploring M&A, per Feb 14 filing 🎯
Firm, betting on growth! 🚀
(4/9) – KEY DEVELOPMENTS 🔑
• Q4 Earnings: $ 401M loss reported Feb 14, 2025 🔄
• Expansion: Plans for Truth.Fi ETFs, per Feb 6 Reuters 🌍
• Market Reaction: Flat post-earnings, per CNBC 📋
Adapting, diversification’s key! 💡
(5/9) – RISKS IN FOCUS ⚡
• Losses: $ 401M hit in 2024, per Feb 14 filing 🔍
• Competition: Meta, X pressure social media 📉
• Regulation: Legal woes linger, per Feb 14 SEC ❄️
Tough, but risks loom large! 🛑
(6/9) – SWOT: STRENGTHS 💪
• Cash Reserves: $ 777M buffer, per Feb 14 filing 🥇
• Brand: Trump loyalty drives interest 📊
• Flexibility: M&A plans in motion 🔧
Got resilience in the tank! 🏦
(7/9) – SWOT: WEAKNESSES & OPPORTUNITIES ⚖️
• Weaknesses: Revenue down, losses up 📉
• Opportunities: Crypto ventures, M&A growth 📈
Can NASDAQ:DJT turn cash into wins? 🤔
(8/9) – NASDAQ:DJT ’s $ 23.93 , cash-rich but loss-heavy, your take? 🗳️
• Bullish: $ 35+ soon, M&A pays 🐂
• Neutral: Steady, risks balance ⚖️
• Bearish: $ -20 looms, losses weigh 🐻
Chime in below! 👇
(9/9) – FINAL TAKEAWAY 🎯
NASDAQ:DJT ’s $ 29.23 Feb 18 close masks $ 777M cash stash 📈, but $ 401M losses sting 🌿. Volatility bites, yet dips are our DCA gold 💰. We grab ‘em low, climb like pros! Gem or bust?

SOL emerging head & shoulder providing opportunitiesBYBIT:SOLUSDT has an emerging H&S structure that is providing opportunities described below, which can be utilised based on risk appetite and preference for a swing trade or investment.
Note: The overall chart structure at the moment is highly complex and pattern failure risks, such as that experienced with BYBIT:XRPUSDT remains very high.
Scenario
An H&S structure has emerged since 23 Dec 2024. Neckline support has been confirmed 3 times around: 11 Jan, 07 Feb and 12 Feb. The price is still close to the neckline providing opportunity for entry into trades and/or investment.
DCA entry into a longer term investment - recommended approach
Allocate a percentage of your portfolio's available fund to this as an asset to hold, decide upon how many months or weeks you would like to DCA into the total position (I recommend no less that 3 months and no more than 6) and begin DCA. This approach will safeguard against mistiming the start of the DCA now before the beginning of a bearish cycle, finally ending at an as yet unknown lower support level (of 4 potential candidate price levels stated further down the text below).
The case for beginning the investment approach now
The project remains solid and has established itself as a competitor to ETH. Furthermore, it is the layer 1 of choice for memecoins and has had more new projects use it that ETH recently. Additionally, overall positive market sentiment remains as do utterance (although no formal new policies of note) of the Trump administration and financial institutions towards crypto. Finally, the large gyrations in price recently are making it more difficult to judge appropriate SL levels thereby making trading of any kind less attractive at the moment.
The case against beginning the investment approach now
The future of the project, like most projects is still unknown (crypto is the most volatile and riskiest of assets for a reason!). Although the industry is maturing, it is possible a newer project can come and usurp the place of SOL. There are further support levels (130, 90, 55, 20) that can provide better DCA entry levels, and as market sentiment can change on an utterance of Musk or Trump, patience for a better entry point caused by further bearish moves might be wiser, particularly as on the weekly chart, SOL appears to be printing it's 2nd consecutive doji - implying market indecisiveness and no clear indication that the bulls are about to become incharge again. SOL has also double topped (mid Nov 24 and mid Jan 25), near the ATH (250), indicating either upcoming bearish sentiment or another uncertain attempt at breaking the ATH.
Swing trade
Entry: 200
TP:280 - near the absolute top of the head
SL: 160 - past the dragonfly candle of 13 Jan (this candle has the risk of indicating a new support leval and all traders must be wary of the 160-150 level as that was the support level in mid Oct 24 Additionally, 170 is also near the 200 EMA and crypto daily price gyrations are sometimes very large; therefore a daily low of a dragonfly and a EMA has the potential of being a support level that should be accounted for when setting a SL )
R/R: 1:2
The case for the swing trade
The rate of change indicated is trending upwards. The neckline has proven to be a support level and has been validated 3 times.
The against a swing trade
Other technical indicators like the RSI (middling with little upwards trend) and MACD (likewise) do not provide strong positive support for the trade thesis. Having found support at the 200 EMA and broken out of the downward trend since 20 Jan, there is a possibility that the price will just range between the 50 EMA and 200 EMA (approx. 210 and 180) unless there is further external, fundamental cause for upwards momentum. Previous momentum was driven largely by the optimistic market sentiment for crypto following on from Trump's election win. Finally, a R:R of 1:2 is generally not considered worthy of such a speculative trade.
Note: There is very little justification for a margin trade at the moment - the dragonfly candle on 03 Feb carries too much risk and invalidates a margin trade theses' risk/reward ratios. Margin trading this pair is best left to when a pattern emerges that is not part of a structure that includes the 03 Feb candlestick.

Tue 28th Jan 2025 Daily Forex Charts: 5x New Trade SetupsGood morning fellow traders. On my Daily Forex charts using the High Probability & Divergence trading methods from my books, I have identified 5x new trade setups this morning. As usual, you can read my notes on the charts for my thoughts on these setups. The trades being a BTC/USD Sell, XAG/USD Sell, AUD/CHF Buy, EUR/AUD Buy & a NZD/CHF Sell. I also discuss some trade management. Enjoy the day all. Cheers. Jim

NVDA closes below 200 Day SMANASDAQ:NVDA had a very bad day today with more than 550 billion $ Market Cap destroyed. This is one of the worst days for NVDA since March 2020. The 200 Da SMA price was 122 $. NVDA closed @ 118 $. This makes it a daily close below the 200 Day SMA. There might be some more downside and sideways movement before it starts a bullish upward trend before its earnings release on Feb 26. 6-12 Months down the line this might be one of the best buying opportunities. Long NVDA 110 $ - 120 $.

Dollar-Cost Averaging: The Simple Strategy Every Trader NeedsHello, Traders! 👋🏻
Timing the market is one of the most complicated challenges for any trader. The constant question of “Is this the right time to buy?” or “Should I wait for a better price?” creates hesitation and often leads to missed opportunities – or worse, emotional decisions.
That’s where Dollar Cost Averaging (DCA) comes in. DCA meaning? Rather than trying to predict market movements, DCA takes a disciplined, consistent approach to investing. By committing to regular investments over time, you smooth out the highs and lows, removing the stress of decision-making and allowing you to build your portfolio steadily.
In this article, we’ll dive into how DCA works, why it’s an effective strategy, and how to use it to stay in control. 🧘🏻
Why Is Market Timing So Hard (and How Does DCA Solve It)? What is Dollar Cost Averaging?
The allure of perfectly timing the market is strong. Who wouldn’t want to buy at the absolute bottom and sell at the peak? But the reality is that market timing typically turns into guesswork. Even with technical analysis, factors like sudden news events, regulatory changes, or shifts in market sentiment can make predictions unreliable. This uncertainty is especially true in the crypto industry, where prices can swing dramatically within hours. For many traders, this indecision can lead to two common pitfalls:
⏰Waiting Too Long. Hoping for a better entry point that never comes, missing out on gains.
😬Jumping in Emotionally. Chasing the market during a rally or panicking during a dip, only to see prices reverse shortly after.
Dollar Cost Averaging sidesteps all of this. Instead of trying to outsmart the market, you invest a fixed amount regularly – whether prices are up, down, or sideways. It’s a simple, effective way to participate in the market without letting emotions or second-guessing hold you back. Just strategy. Nothing extra. 🤷🏻
So, What’s the Secret? How DCA Works in Practice? DCA Investing
Commit to a Fixed Amount
With DCA crypto, you decide how much to invest each time – say, $100 weekly or $500 monthly. This amount stays consistent, no matter what the market is doing.
Stick to a Schedule
Regularity is key. By investing in a schedule (e.g., every Friday or the 1st of each month), you eliminate the need to decide when to enter the market.
Take Advantage of Volatility
When prices 📉, your fixed investment buys more of the asset. When prices rise, it buys less. Over time, this helps reduce your average cost, giving you an edge in volatile markets.
Use Auto-Investing Tools
Many crypto exchanges offer auto-investing features , making setting up and sticking to your DCA strategy easier. With these tools, you can automate recurring purchases of your chosen asset at regular intervals (weekly, biweekly, or monthly). All you need to do is select the asset, set the amount, and schedule the frequency. Once configured, the platform handles the rest, eliminating the risk of forgetting or deviating from your plan.
Example:
Imagine you’re investing $200 into Bitcoin (BTC) every 2 weeks.
Bitcoin DCA Example:
After 5 cycles, you’ve invested $1,000 and accumulated approximately 0.05 BTC at an average cost of $20,000—lower than the highest price during this period.
The Key Benefits of DCA
Soooo… Why is DCA a go-to strategy for many traders?
DCA removes the stress of guessing when to buy. You follow a plan and let the strategy do the work.
By investing during both highs and lows, your average cost tends to decrease over time.
Fear and Greed are the biggest enemies of consistent gains. DCA automates your investments, helping you avoid emotional decisions that could harm your portfolio.
Whether you’re buying Bitcoin, Ethereum, or even traditional assets like ETFs, DCA adapts to your goals and market preferences.
Regular investing instills good habits, encouraging you to focus on the long-term growth of your portfolio.
In conclusion, the markets will always have ups and downs, but with DCA, you don’t have to worry about catching every wave 🏄. Instead, you focus on building your portfolio steadily, one step at a time.

$BTC 1W Largest Scale Playing with Long Term Ideas #LongThis idea i made today for long term idea just as it is an idea some basic lines and formations were made but it was pretty simple using same red lines the decline lines are same angle as it states. showing prices and times as estimates i will come look at this and progression when iI m older and know more of this trading and chart mechanics etc!
I am not a Financial advisor or any way good with number.. sorry that's a lie I am very good with math but I haven't had to make financial gains on markets not crypto at least.! I have crypto but earned it all freely over short time last 2 years have over a few band only a couple,, but free earned and mostly passive about 70% passive :) anyway and so that makes it all gains but i do swap stuff at lows and highs and various coin swaps using special maths and tools no one else does a lot and take advantage of the "virtual arbitrage" between trading oone coin for another and then another .... if you get it you get it!
WHAT YOU THINK OF IDEA its one for me to come back to in years and look and go wow we were at 100k moment JUST like the 10k moment. Only I don't remember It so well!
hope you enjoy! let me know your opinion and what could be wrong or different! lets learn from one another and take over the markets!!!!

Mon 30th Dec 2024 AUD/NZD Daily Forex Chart Sell SetupGood morning fellow traders. On my Daily Forex charts using the High Probability & Divergence trading methods from my books, I have identified a new trade setup this morning. As usual, you can read my notes on the chart for my thoughts on this setup. The trade being a AUD/NZD Sell. Enjoy the day all. Cheers. Jim

Mon 16th Dec 2024 NZD/CHF Daily Forex Chart Buy SetupGood morning fellow traders. On my Daily Forex charts using the High Probability & Divergence trading methods from my books, I have identified a new trade setup this morning. As usual, you can read my notes on the chart for my thoughts on this setup. The trade being a NZD/CHF Buy. Enjoy the day all. Cheers. Jim

Mon 16th Dec 2024 EUR/GBP Daily Forex Chart Buy SetupGood morning fellow traders. On my Daily Forex charts using the High Probability & Divergence trading methods from my books, I have identified a new trade setup this morning. As usual, you can read my notes on the chart for my thoughts on this setup. The trade being a EUR/GBP Buy. Enjoy the day all. Cheers. Jim

So the Bull market started you said? :) Long $BTCTechnical and Fundamental look into Bitcoin.
Bitcoin has recently achieved an all-time high (ATH) of around $104,000. The current trading price is slightly below this peak, suggesting a possible consolidation or minor pullback.
The chart here indicated that Bitcoin is currently trading just above a significant resistance level at approximately $102,934.71, which could now act as a new support if the price holds above this level. There's another resistance level higher up, indicating where the price might face selling pressure if it attempts to rise further.
This pattern/idea shows support levels at around $59,022.02, which is quite substantial, suggesting that this was where buyers have historically stepped in. A break below this level could indicate a deeper correction, but as of now, the price is far above this support, indicating STRONG BULLISH SENTIENT.
For this chart's trend it shows clearly that it has been predominantly bullish, with a series of HIGHER HIGHS and HIGHER LOWS! More Bullish Sentiment! The presence of green candlesticks in recent days suggests that the market has been closing higher than it opened , indicating continued buying interest. However, the presence of some red candlesticks near the ATH might signal profit-taking or a short-term bearish sentiment.
The volume on this chart or the indicator at the bottom of the chart shows increased trading volume as Bitcoin approached its ATH, which is typical when prices reach new highs. This could mean that there is significant interest in Bitcoin at these levels, but it also suggests that any move up or down could be volatile.
The Indicators over the chart in red and green arrows indicate the potential buy or sell signals based on various indicators or patterns. If these are based on moving average crossovers, RSI divergence, or other momentum indicators, they could be suggesting entry or exit points for traders.
Conclusion:
If the price can break and close above the higher resistance level with significant volume, it might signal the continuation of the bullish trend, potentially targeting new highs.
Conversely, if the price fails to break this resistance and starts forming lower highs, it might be a sign of a potential reversal or at least a period of consolidation. Watch for any bearish divergence in momentum indicators like the RSI or MACD, which could warn of a potential downturn. For those considering entering a long position, waiting for a pullback to the current resistance-turned-support level could offer a better risk-reward ratio, as this level might now attract buyers. Given the proximity to the ATH, traders should also be cautious of overbought conditions, which might lead to a sharp correction. Setting stop-losses below key support levels would be prudent.
PLEASE REMEMBER: Trading Cryptocurrencies like Bitcoin can be highly volatile, and while technical analysis can provide insights, external factors like regulatory news, macroeconomic conditions, and market sentiment can greatly influence price movements. Always do thorough research and consider your risk tolerance before making trading decisions. THIS IS NOT INTENDED AS FINANCIAL ADVICE. Rather a self help and documentation of my own journey into cryptocurrency! Let's make sure we leave nice comments and leave or talk about what is useful! But random comments are OK! :)

XRP: Accumulation Zone Hello Team,
Ripple XRP has now entered into the 5-year accumulation zone from 0.14-0.35 Cents.
- At this price point and as the price drops more will present long-term buying opportunities for the future in the form of "Dollar Cost Averaging".
XRP has a large potential for future upside movement if the SEC case is dropped and due to a large number of partnerships & use-cases acquired.
Don't expect a miracle overnight.

MA OSCILLATOR RISK METRIC | CYCLE 4 ATH UPDATE The MA OSCILLATOR RISK METRIC is an excellent custom indicator developed to help investors to DCA in and out of underbought / overheated periods of the market. Applying principals with BTC's CYCLE 4 current progress if BTC remains within historic trends then this also supports the time periods discuss in the below post.

Will Bitcoin Repeat History or Continue The Cup N HandleFalse Break Out Or Cup N Handle Continuation
1. Bitcoins most recent price action is looking pretty similar to what we experiened back in 2019-2020.
2. Bitcoin is also showing signs of a large Cup and Handle pattern which you can clearly see on the weekly.
3. If the Cup N Handle patter decides to continue playing out. I will continue my plan to just DCA on a weekly basis.
4. If History does decides to repeat what happened in 2019-2020. I will still continue to DCA weekly on the way down. BUT Wait until price falls into my 62-87.6% Fib Zone or $37,750-$22,500 to start Doubling Down on my DCA
5. My Plan is keep my blood pressure low not to predict the tops or bottoms. But to put myself in a good enough position no matter the market direction. And to continue my simple strategy to DCA.
Thank You and God Bless.

EURUSD Swing longWe've had a nice long downward move on this pair and I think it's about time for a new leg upward. Start to buy this pair around here. As you can see from pervious lows there's no real rush, it tends to wallow before making a a bigger move. DCA / Grid (Mean reversion) entry approach to this trade.

USDCAD longer term Shorts, consecutive candle ideaThis is a simple stats based short idea, the consecutive candle count is nearly at a new record high, last time it was this high was back in 2017 so these opportunities don't come up often. Mean reversion is coming so let's make some hay while the sun shines :)
Start entering shorts now and then enter more if it goes higher, don't go crazy mind, it's all about risk.
You can see a new custom indicator I've been working on.

Bitcoin short term timeframe and longI went a little short. Pretty tight up on the underside of that 200 for bitcoin, if I dare say so myself…I just jinxed it, didn’t I? …shee!t…lol
Sold some MSTR as well today in the after hours. It gave a tiny polite pop this time to let us get some out 😊 I’ll dca fully back in inside a week or two.
Bitcoin chart…same range, but I trimmed some this time at 63. I was tired of watching that damn chart range for months and just holding my pp. My average was from 2023 so I thought ‘why not try for a bit’. I have alerts set at 59 and 57 to place the proceeds back in.
I think this might be the last downturn for BTC honestly. Buying from now till Halloween is going to feel real nice for anyone in 4 months. The blue arrow points to Batman in the RSI. Yep, there he is…top 3 best head and shoulders RSI Batmans of all time.
Take care all,
MR

Is the crash here?Throughout all of social media and YouTube I've been seeing many people panicking if weather or not we have topped and should start selling. One thing that I've learned predicting mayor world events is to: always play it on the safe side when dealing with uncertainty. Instead of shorting the market, I prefer reducing my exposure, as short trades are extremely risky, and I've personally learned that the hard way. It is true that price action is now at an infliction point. With a vast amount of stocks entering a downtrend in such a harsh manner. It is not hard to see why everyone is panicking. Do I think this is the crash we've been waiting for? Perhaps it is, but I can't tell with certainty because even tough price is over extended, it does have a lot of structure supporting it.
The reason we are at an infliction point is due to the price action reaching the 25MA which many times is used as support or resistance and going below this threshold would for sure confirm a downtrend and with my Mean Returns indicator the story is the same. We are seeing a loss in momentum after having a very bullish push in the last years.
With all the recent news in the U.S. election, it is fascinating to see the market react to these mayor events. These do change the scope of how the market should behave, as a lot of uncertainty has just been introduced to the U.S. population in general. This lack of knowing what the future hold in store is what I believe to be the driving force of this recent downtrend. Combined with increasingly worsening economic fundamentals is what will give us the crash we are waiting for. But before making a decision on how to trade, it's important to consider all possible outcomes. Which is exactly what you can see in the graph. Where I've marked what different price action would mean to the economy and the market in general, as well as setting a trading plan for all of these outcomes.
This type of panicking is what leads me away from using stop losses. People panic and push prices violently. However, many times the analysis was correct from the start but hitting a stop loss gets you to close your position prematurely. That's why I define several entry levels and dollar cost average since the beginning. Using an equation to determine how much should I invest, at which levels to determine the correct amount of exposure to avoid missing out and to always have a favorable average price.

BTC/USDT WILL DCA WHALES EXPLODE BTC AFTER 74K TO 100KThank you for reading this update.
Bitcoin (BTC) appears to be in a crucial area known as the Dollar-Cost Averaging (DCA) whale protection zone. This zone is significant for maintaining the current trend, as it acts as a security zone for the ongoing DCA cycle, which remains intact.
We have been tracking BTC since it reached $53K and are now monitoring it as it approaches the next target of $74K. If BTC can confirm a move to $74K, there is a high likelihood of a major breakout to $100K.
We find it essential to stay updated with the volume trends and observe the cycle's progress.
At this moment there is no confirmation for a breakdown trend and BTC stays positive and into the cycle.
Data shows that high-volume DCA whales are not investigating for just the short term, it's a goal that can take at least 6m+, and this can be tracked depending on the transaction data.
* With DCA whales means the known large firms and the unknowns holding wallets.
