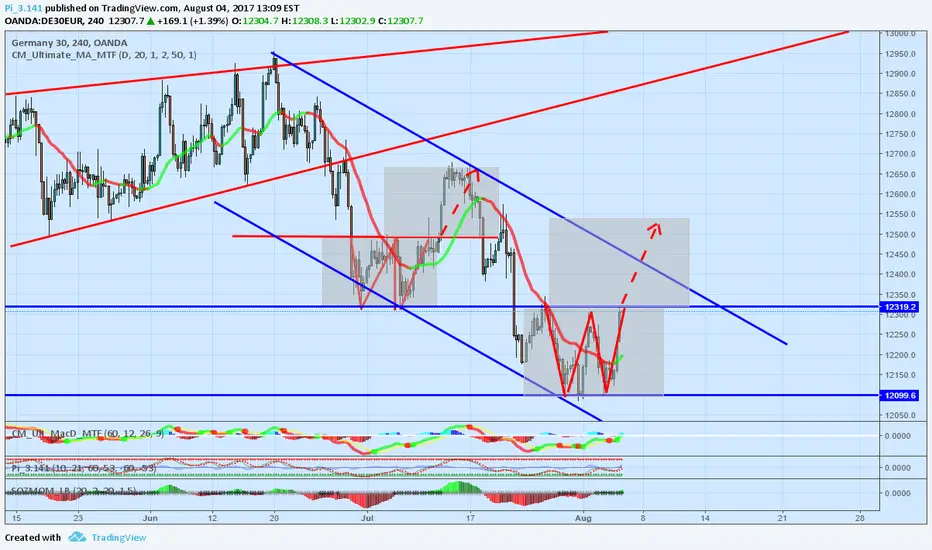
DAX BUY OPPORTUNITYPrice broke above trendline from the upside. RSI oversold with divergence. Price above 20EMA. 2 trades 1.5:1 2:1 RRR. 1st target 127.2%fib 200EMA resistance. 2nd target trend continuation. In my opinion the cycle isn't over we have some time before we get a recession. Bullish. Good Luck
De30

DE30 bearish divergenceWe are looking for a nice short here on a weekly chart, based on the chart, bearish divergence formed pretty clear signal.
Trade with care.

Dow speed limit exceededUS30 in red , sp500 blue , dax green , fr40 pink , uk100 turquoise .
Sp500 and mostly dow are much higher than all other . Sell dji for : tp1 = 23300 , tp2 = 21300

DE30/EUR 1D Chart: Rebound from 55-day SMADE30/EUR 1D Chart: Rebound from 55-day SMA
The index that compiles 30 largest German companies is advancing against the Euro in the long-term rising wedge formation. This pattern started to form two years ago and today consists of two reaction highs and three reaction lows. Consequently, the breakout of the pattern is expected to happen in the Q2 2018.
In the meantime, in the middle of this year the exchange rate started to form new junior ascending channel but due to support provided by the 55-day SMA it began to transform into another rising wedge. As the northern side contains no notable obstacles, the pair is expected to continue climbing to the top, thus ending the year near the 13,600 level. In case of sudden reversal, the above moving average should prevent the pair from making a premature breakout.

DAX testing support zoneFor the last few days we are observing on DAX a strong fall without correction. On session in November 13th price has touch support level and bounced up for near 150 points and drew bullish pinbar, but this didn't stop further price dropping. Today price has tested once again support level and went lower where buyers came out. This could beclassic hunt for stop loss characteristic for DAX. Question is if big players bought there? If yes, than we could see on the next sesssions defense of this level. This could be a good opportunity to open buy order. Looking for a bullish pin bar of November 13th which was negated we will wait for more signals to buy. If support zone at 12900-12960 will not be defended, price could drop at least to 12500 - 12300.

DAXEger fiyat 13.030'u gecer ve 13.030 ustunde kalicilik saglarsa ana hedef noktasina varana kadar turuncu olarak cizdigim fibo seviyeleri arasinda hizli hareket edip tirtikli fibo çizgilerinde yavaslayacaktir. Birincil ana hedef olan 13.330 da ise duzeltme dususu gelebilir, islemden cikip beklemek gerek.
___________________________________
If the price exceeds 13,030 and sustains above 13,030, it will move quickly between the fibo levels I draw in orange until it reaches the main target point(13.330) and slow down in the serrated fibo straps.

DE30: to touch 521 on one conditionI was asked to analysis on this index by a great folloer.
I try my best to analysis on it.
As long as price stand beyond FIBO 0.75,
we will consider DE30 has a final impulse to touch FIBO 1.27 521.23.
Less is more!

DAX possible bull flag and long opportunity to the ATHGerman Dax is forming a bull flag and could test the ATH during the coming weeks or days.
The trade it and leave it rule... why did I not follow it?I was alerted of this trade via my friend's analysis which I also deemed fit to enter at my own risk. At 2017.07.26, Dax retested the broken support (which was also the 8 EMA at that time) which resulted to a formation of a bearish pin bar.
At the split second that I've adjusted the TP because of 'potential greed,' I have not kept in mind the possibility of such movement when the gap was filled. At the time the gap was filled, Dax, without hesitation, reversed to the upside probably for some breather. Sadly, it hit my SL which were adjusted to my entry levels.

DAX $DAXlong into completion of bearish crab; already ATH in place, this one is about to be higher. High risk trade.

DAX medium TERMDAX weekly chart. Nearing the LT trend line channel+negative MACD crossover. Idea based on the assumption Macron win has been priced in by the markets.
Trade at your own risk


Bat Bearish to... recover from missed Trump's Speech Rally :)...Let's go back to last unfilled gap :)....

Ascending channel : testing new highs ?We are entering inside a warning zone, so, we must take care (eventual trade cancellation).
I'll keep you updated about new observations.

Ascending triangle failed.... Downward move in progress...Time to go down :)...
Thanks to @PSVert for his great analysis that inspired this one.

Dax Trading Idea for 13-02If he cant break 11710 we can go down to 11580.
If we break 11710 we can go to 11808 and short from there.
So I will buy on Monday from 11660 11720 with TP 11808.
For Short plan you can look at my Weekly Analysis.
Have a great week !

Dax Trading Idea 09-02-17 LONG -> SHORTI buy 3 Positions @11555 LONG with TP 11637, 11686, 11735 (move SL to entry if TP1 is reached)
I will Sell from 11637, 11686, 11735 with TP 11425.

DAX : Sell off from 11600 resistance levelDAX has been struggling with 11600 resistance level since the beginning of the year.
Time to drop some pressure, I suppose :)...

DAX - DAILY VIEW - TIME TO SELL OFF :) !DAX reached the upper daily trendline.
Seems to be a nice time to sell off, doesn't it :) ?

DAX long term predictionThe rest of the year and the beginning of the next year it will move inside the triangle. IMO
