DE30 Sell aheadGood day traders, Monitoring for a Bearish break- Could enter small sell lot here and SL just above 12,400.0 But rather risky. Conservative traders should wait for Wedge break before a Sell.
GERMANY 30

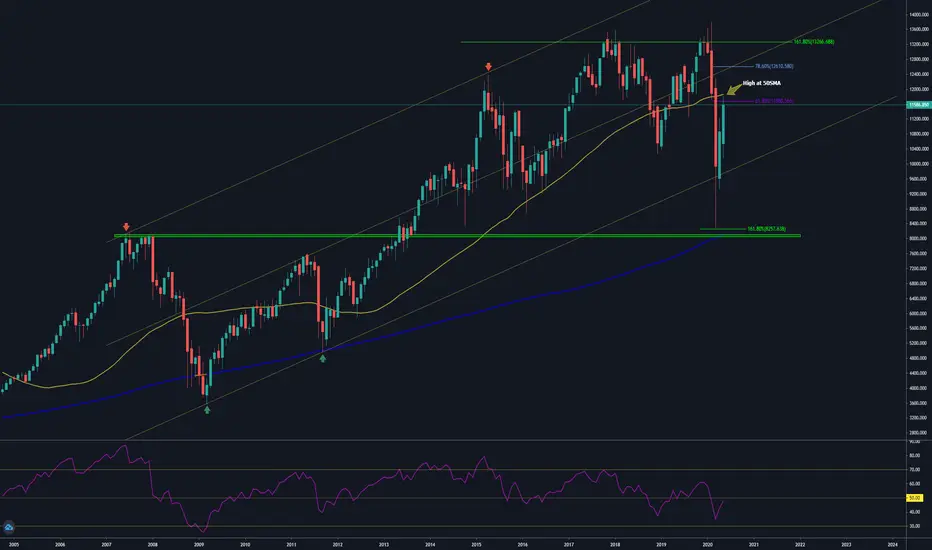
DAX monthly outlookAs the price level pulled back into bullish territory, May candle found resistance at the 50SMA on monthly chart and closed below the 61.8%. That is strong resistance.
So far, as economies in Europe reopen, we still look on the bullish side for now, but need the break of 50SMA for more confirmation.
ECB rate announced on Thursday will shed more light on the QE measures and show us more direction for the index.
1 hour time frame (see below) shows potential to pull back to 11200 territory.
Increased riots in USA and fear of similar situation in Europe puts pressure, so EU and UK governments are expected to bolster public morale.
Please support the idea and share your thoughts on DAX!
Good Luck and Stay Healthy!
#de30y - Please, please take the money ;-) #eurobonds #ecb #fedPlease, please take the money and keep it forever. Repayment is just like interest payment - devil's stuff, that's why the investors like to pay the interest to the (above all, God like) German government, so the burden of economic decision is taken away from the investors. The honorable and cheered government can distribute the money to all big companies and their shareholders, as well as to our EU-Friends. (Irony off)
1st target: - 0.9% p.a.
2nd target: - 1.5% p.a.
3nd target: monetary reform
Greetings
Stefan Bode

GERMANY 30 SELL (DEUTSCHLAND 30 INDEX - EURO)Hi there. Price is losing its bullish momentum. Watch strong price action at the current price for sell.

DAX outlookAs the equities took a bullish turn on the positive outlook on economic re openings, DAX approached the 61.8% retracement since the sell off.
If the fundamental news do not change, we should see a break higher towards the 11800 round number. First target of the breaks is 12000.
Please support the idea and share your thoughts on DAX!
Good Luck and Stay Healthy!


My analysis for Next week I keep to try focus on Range Trading : Sell Resistance and Buy support.
If it's Break last High, it's likely because of positive news on DAX.
Have good weeks, and Good Trade.

Psychological fear and freed patternI am still waiting for an opportunity to short, in my view, we see a glimmer of hope until august - september.
But I guess when it gets colder more people will go to the doctor and become sick, so more corona infections.
My assumption is that insider will trade some weeks before that corona wave 2 to save their assets.
This second wave would be fatal, cause stimulus injections will be limited this time and corona will end only until 2021 may.
A big Insolvency wave will drain the market.
In my view I see black

Dax idea - multi time frameDax tried to go lower and found support this week
this isn't over yet. Next week i believe we will have some positive days moving towards the wave (4) a key resistance level for dax. It is expect to see a rejection at his level bringing the price down to complete last wave (5)
attached to this idea is the Sp500 and last week De30 analysis
Last week i mention we were going to move towards an ABC correction and looks like we are on track. Take a look at that chart too

DAX broken trend lineLine confirmed again yesterday and now broken. Target 10200.
Please support the idea and share your thoughts on DAX!
Good Luck and Stay Healhty!

DE30 - DAX German index ABC correction - Big red week incoming Big German stocks looking for ABC correction:
SAP
VOW
SIE
LIN
BAS
BAYN is one of the big stocks that is not clear. We see a triangle pattern on daily chart. If this breaks bearish then we have a big red week for the Dax
DE30 seems to reflect this trend
next week we will be looking for ABC correction

DE30 EUR SELL (GERMANY 30 INDEX - EURO)Hi there. Price is forming a continuation pattern to the downside. Watch strong price action at the current price for sell.

DAX rising channelDAX in a good rising channel with multiple confirmations.
Break to the downside is a sell signal, need an impulsive break. It will also break 50 and 200 SMA's.
If DAX continues to the upside this morning, waiting to see if it can break higher than 61.8% to have more confirmation for a long.
PMI from Europe this morning is released, so could cause volatility!
Please support the idea and share your thoughts on DAX!
Good Luck and Stay Healthy!

DE30EUR.Short position ideaThe next target will be lunched after the price break the Fibonacci golden level 10196.8

SIE ABC correction - SIEMENSABC correction oportunity
price touched Fibo level and generated a big engulfing candle on the daily time frame indicating the beginning of the ABC correction

VW IDEA - Volkswagen idea ABC correction Key points to consider:
- HUGE daily engulfing after touching 61.8% Fibo
- H2 MACD crossover
- Hourly chart 3black crows
Price looking for ABC correction

DAX30 Short idea - Trendline bounce We can see that we've reached top of the channel which is respected for some time. Also we can expect some pull back after this big pull up, so I think there is possible that we can retest 10900 level which would be also the bottom of the channel. We shall see.


DAX potential buyWe are in earnings week, with a massive list of companies reporting their financial figures. Markets expected be highly volatile. Some technicals may be pointless. It is also the last week of April.
Looking at DAX we see that it is currently in the 2nd consolidation channel since the lows, right below the 50% Fib level. A break to the upside is a buy signal to 11500 target.
Alternatively, we can sell on smaller time frames is a reverse pattern occurs.
With EU countries slowly expected to ease lockdown in May, markets want so positive sentiment.
Please support the idea and share your thoughts on DAX.
Good Luck and Stay Healthy!

DE30 Diamon & Double top - MACD & RSI DivergencySeveral indications to be on the short side next week.
CURRENCYCOM:DE30 CURRENCYCOM:DE30
- MACD divergency
- RSI divergency
- Diamond pattern completed
- last hours started to form a nice double top set up putting even more selling pressure on the DE30 for the following week
Strategy:
- wait for confirmation of Double Top and short. You can set positions to go long here as well as some short quick profits in case it doesnt breakt the diamond pattern
- If we see double top breakout this will trigger the diamond pattern and flag breakout on the daily aiming for a long short with nice risk reward


Dax DE30EUR, Weakness Appearing - Short Term - 30min chartOverall the trading range we currently see on the Dax is still a bullish formation, we are still in an uptrend environment. However, weakness is creeping into the chart with volume /supply entering at the top to the trading range, a longer amount of time is being spent at the top of the current trading range (on the 1 hour , 4 hour time frame, when price reaches the top) than in previous range, this indicates slow, controlled professional selling (institutions moving out of a position).
Although on the higher time frames I believe we have room to go higher, from an intra day perspective, if we breakout of the bottom of this 15 minute chart trading range, and put in a subsequent lower high at the neckline, then the opportunity is there for an aggressive, quick short to the bottom of the current trading range. My thoughts overall is we are seeing early signs of weakness, and eventually this current trading range on the 1 hour, 4 hour charts will prove to be a distribution

Dax DE30EUR, Weakness Appearing - Short Term Short OpportunityOverall the trading range we currently see on the Dax is still a bullish formation, we are still in an uptrend environment. However, weakness is creeping into the chart with volume/supply entering at the top to the trading range, a longer amount of time is being spent at the top of the current trading range (on the 1 hour , 4 hour time frame, when price reaches the top) than in previous range, this indicates slow, controlled professional selling (institutions moving out of a position).
Although on the higher time frames I believe we have room to go higher, from an intra day perspective, if we breakout of the bottom of this 15 minute chart trading range, and put in a subsequent lower high at the neckline, then the opportunity is there for an aggressive, quick short to the bottom of the current trading range. My thoughts overall is we are seeing early signs of weakness, and eventually this current trading range on the 1 hour, 4 hour charts will prove to be a distribution
