MEGAPHONE ALERT! BTC 1H Outlook🧩 Megaphone Formation (Broadening Wedge)
Volatility expanding inside a widening range
Price now testing the Fib cluster (0.66–0.618) between 105,568–105,987
RSI at 66.3, nearing overbought — pressure is building
Volume surging above 20-period MA → breakout imminent
🎯 Key Confluences:
Upper Bollinger Band: 105,950
Mid BB (Basis): 105,110
Lower BB: 104,342
55 SMA: 104,500
SL Zone (Invalidation): Above 106,500 (upper wick resistance)
🔻 Bearish Breakdown Scenario:
Loss of 105,100 and breakdown from lower wedge line
RSI drops < 45 + volume spike → hedge confirmation
Targets: 104,000 → 102,500
🔺 Bullish Breakout Scenario:
Close above 106,000–106,500 with volume
Targets: 107,800 → 108,900
Manage with trailing stops — things will be quick!
⚠️ Summary:
Megaphone = Volatility Bomb
Stay nimble. If BTC fails at this Fib zone, the breakdown will be fast and decisive. If it breaks out, bulls might squeeze higher but need volume to sustain it.
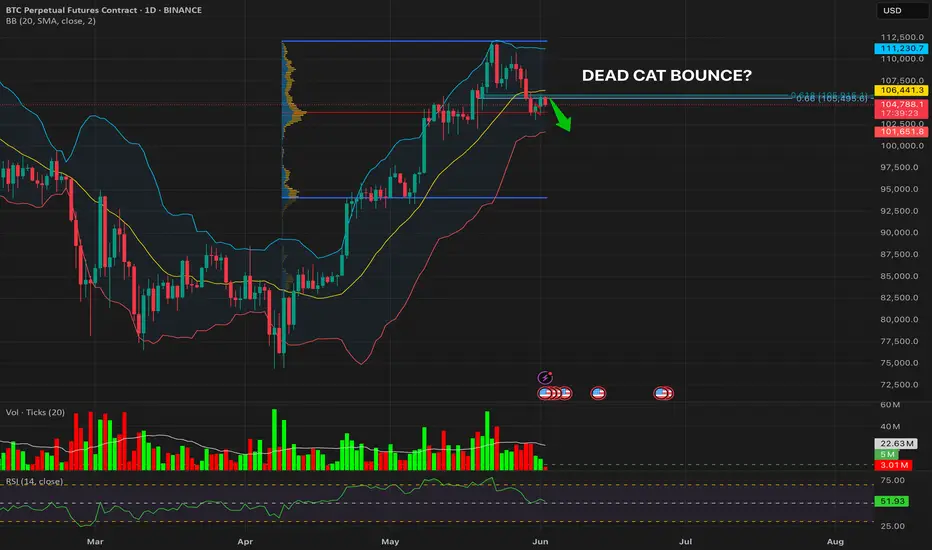
Dead-cat-bounce

DEAD CAT BOUNCE? | BTC/USDT Daily + 4H Breakdown📉 Daily Chart – Rejection from Mid-BB & Fib Cluster
BTC bounced into the 0.618–0.66 retracement zone (105,495–106,443)
Price failed to close above the mid-Bollinger Band (106,443)
Volume declining on the bounce → lack of buying conviction
RSI barely holding above 50 (52.05) → weak momentum
Price is now rejecting from the underside of broken support → classic S/R flip
Possible Dead Cat Bounce forming below structure
🕵️♂️ 4H Chart – Short Hedge Retest Opportunity
Breakdown confirmed below 104,472 HL
RSI still below 45 on the 4H → bearish momentum intact
Retest of breakdown zone with weak volume
Price capped by mid-BB + 55 SMA (105,400–106,000 region)
Structure confirms a potential LPSY (Last Point of Supply) in Wyckoff markdown
🎯 Trade Plan (RTP-Compliant Short Hedge)
Entry: ~104,800 (confirmed breakdown zone)
SL: Just above 106,443 (Fib + BB basis + 55 SMA)
TP1: 103,300 (Lower BB)
TP2: 101,500 (Lower channel bound)
TP3: Trailing 1.0% below 101,400
⚠️ Summary
BTC's bounce lacks volume, RSI strength, and structural reclaim. Unless bulls close above 106,443 with force, this setup favors a continuation lower.
I'm shorting thisTwo weekly timeframe for a better understanding. Looks like a large bearish flag forming. Price just bounce off the bottom of the flag. But I think is a dead cat bounce. Is hitting a resistance level 35-36. Doesn't look too sting to break it up. SL triggers if a weekly candle breaks up the resistance and closes above it.

Clean breakDouble top confirmed. the pair is bouncing up to test the broken support (dead cat). Not sure if it will make it all the way up the broken support zone, it might start dropping now. SL triggers if a daily candle closes above the broken support now resistance area.

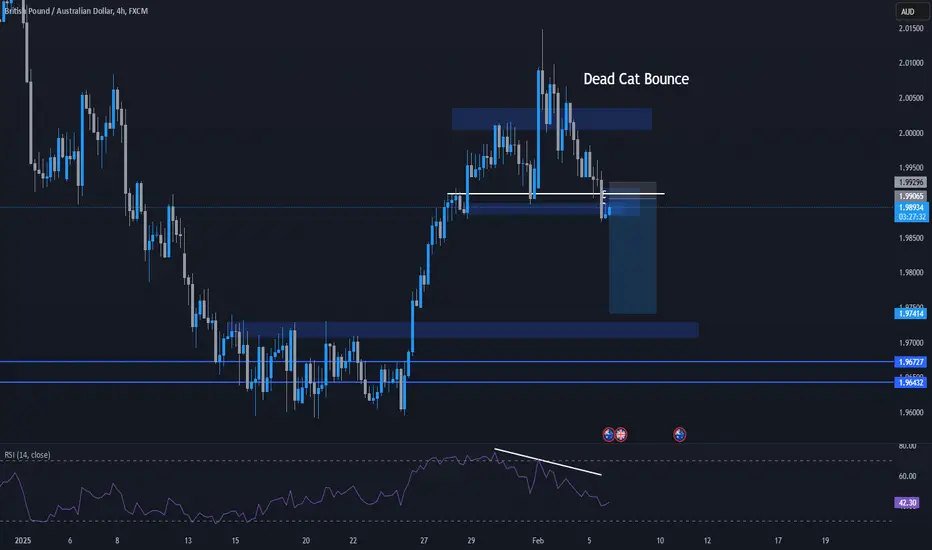
GBPAUD - Bearish Reversal Pattern + SetupHello traders,
GBPAUD has been in an uptrend since last week. But now it is showing bearishness with the break of the demand zone.
Add to this the RSI divergence which makes this trade a higher probability setup.
My entry, sl and tp are as marked on the chart.
🔥 Ethereum Dead Cat Bounce? Potential Massive Sell-Off ComingIn this analysis I want to take a look at ETH's price action over the last few weeks. It appears that ETH is underway to form a classical pattern that most of you a familiar with, a dead cat bounce into another sell-off.
Keep in mind, the dead cat has not been confirmed yet, since the price needs to go below the purple dotted line. Still, it's a pattern that will likely play out if the Bitcoin bulls will not step in very soon.
ETH (and likely also BTC) is at risk of giving away most post-ETF gains if this continues. We knew already from other analyses that Bitcoin is far ahead of where it *should* be at this point in time, so a correction might be necessary? Time will tell.

Looking at Possible Dead Cat Bounce Levels After TSLA EarningsDepending on investor sentiment, I am expecting 3 possibilities, listed from most positive to least positive investor sentiment:
In Purple (most positive): Bounce to $196-$198 fib levels, decaying to $188-192 range.
In Yellow: Bounce to $192-$194 fib levels, decaying to $184-186 range.
In red (worst): Little to no bounce, very pessimistic view on stock, decaying straight to $180-182.
If we hit red, or maybe even yellow, we are looking at a rough 2024 (See my triple top and dip Idea.)

Understanding the "Dead Cat Bounce" in TradingIn the dynamic world of trading, one peculiar phenomenon that often catches investors' attention is the "Dead Cat Bounce." This term, as bizarre as it sounds, is a crucial concept in technical analysis and market psychology. It refers to a temporary recovery in the price of a declining stock, followed by a continuation of the downtrend. This article delves into the nuances of the Dead Cat Bounce, helping traders recognize and navigate this pattern effectively.
What is a Dead Cat Bounce?
Originating from the saying, "even a dead cat will bounce if it falls from a great height," this metaphor is used to describe a brief and false recovery in a bear market. Essentially, it's a short-lived rally in the price of a stock or an index following a substantial decline, misleading some into believing that the downtrend has reversed.
Characteristics of a Dead Cat Bounce
Precipitating Sharp Decline: Typically, a Dead Cat Bounce occurs after a significant and rapid drop in price.
Temporary Rebound: The stock or index experiences a brief period of recovery, which may be mistaken for a trend reversal.
Resumption of Downtrend: The initial downtrend resumes, often eroding the gains made during the bounce.
Identifying a Dead Cat Bounce
The key challenge for traders is differentiating between a true market recovery and a Dead Cat Bounce. Here are some indicators:
Volume Analysis: A genuine recovery often accompanies increasing trade volumes, whereas a Dead Cat Bounce may occur on lower volumes.
Duration: Dead Cat Bounces are usually short-lived, lasting from a few days to a couple of weeks.
Technical Indicators: Tools like moving averages, RSI (Relative Strength Index), and Fibonacci retracements can aid in identifying these patterns.
Trading Strategies for Dead Cat Bounces
Short Selling: Traders might short sell a stock during a Dead Cat Bounce, anticipating the resumption of the downtrend.
Stop-Loss Orders: Setting strict stop-loss orders can mitigate risks if the bounce turns out to be a genuine reversal.
Patient Observation: Sometimes, the best strategy is to wait and observe the price action for clearer trend confirmation.
Case Studies and Examples
Analyzing past instances of Dead Cat Bounces can be educational. For instance, examining the 2008 financial crisis or the dot-com bubble burst reveals classic examples of this phenomenon.
Conclusion
The Dead Cat Bounce is a fascinating aspect of market behavior, representing the constant battle between optimism and reality in trading. Understanding this concept is not just about recognizing a pattern but also about grasping the underlying market psychology. As always, traders should approach these scenarios with caution, equipped with sound research and a well-thought-out strategy.

Puts AMDI think is a dead cat bounce off the 107 support. Tomorrow can open with a gap down breaking the support level. I has been doing lows lows since the last top.

BITCOIN MAKES CLASSIC DEAD CAT BOUNCEAs you can see in the chart, this is a very simple setup:
When we look at the big picture, we have a dead cat bounce breakout retest pattern.
As confirmation, we have a clear RSI bearish divergence and a descending triangle, which can be a good entry point.
As targets we have the clear support levels and we set an stop loss at the last swing high, so in case the price goes against the position, we protect our capital.
Sticking to ideas when proved wrong can be a very expensive mistake. Always be ready to change your mind.

Bitcoin Forecast Sunny🌞 (Clear: 100.0 %)🌤️ Bitcoin Weather Report: Sunny Forecast! 🌤️
According to the latest Bitcoin chart index for the past hour, I'm happy to announce that the weather in the Bitcoin world is expected to be sunny ☀️. With a confidence level of 1.0, I have high certainty in this forecast. Let's take a closer look at the key indicators:
📈 Open: 25019
🔼 High: 25063
🔽 Low: 24890
📊 Volume: 18820
📉 Close: 24918
The recent price movement indicates a potential for a dead cat bounce 🐱 following a sharp drop. This means that after a significant decline, there might be a short-lived upward movement before the downward trend resumes. However, it's important to approach this with caution as dead cat bounces are typically temporary and may not signal a sustained recovery.
Moving on to the moving averages, we observe the following values:
📈 EMA9: 25101
📈 EMA21: 25355
📈 EMA50: 25621
📈 EMA100: 25781
📈 EMA200: 25909
The exponential moving averages show a gradual increase over time, which indicates a potential upward trend in the Bitcoin market. However, it's crucial to consider other factors and not solely rely on moving averages for investment decisions.
Additional indicators include:
📉 RSI: 27
The relative strength index (RSI) is on the lower side, suggesting that Bitcoin may be oversold. This could potentially lead to a buying opportunity for investors, but it's crucial to assess other factors before making investment decisions.
📉 Fast %K: 9
📉 Slow %K: 16
📉 Slow %D: 20
The stochastic oscillator values indicate a bearish sentiment, as the %K values are lower than the %D value. This suggests that selling pressure may be prevalent in the market.
📉 MACD: -279
The Moving Average Convergence Divergence (MACD) is negative, indicating a bearish trend. However, it's important to note that this is just one piece of the puzzle, and other factors should be considered.
In conclusion, while the Bitcoin weather forecast appears to be sunny, it's crucial to exercise caution and not solely rely on a single hour's data. The potential for a dead cat bounce after a sharp drop introduces some uncertainty to the market. Remember to consider various indicators, market trends, and perform comprehensive analysis before making investment decisions. Happy trading! 💰📈

Watch this ticker attempt a rally...When less than stellar stocks attempt to run after a 90 percent drop its note worthy to watch, understand the basic mechanics of the pump and dump and FOMO by bed ridden traders that believe they can make millions while laying in bed... This is half a joke and half true, never chase trade but if you must understand technical, short term resistance above $7 upper resistance $16.... Woahhh, 200 percent gains sounds insane but also 900 percent in less than two week. Based on Fibonacci levels you'll understand why $16 is the sweet spot and if you trade this last week you'd know why $16 held in the initial rally now people dead cat bounce are really this isn't me saying BUY because I can already hear the traders with their eyes cover in buggers saying pumper as if they hold million that my suggestion to watch this for educational purpose would lead them to buy and lose such precious money... So understand this is an opinion agree to disagree and show me your analytical skills not the hot air blasting from your morning breath (@: Remember always keep watch because those with infinite resources will always have an upper hand on us the APES. Trade the trend not your greedy my friends...

First Republic Bank Continues Below $5Merely an update to my previous idea.
And well... I started this idea before the bell, and it was $3.51 at the time.
It's now $2.01 post as of typing this but that will be different already.
I think I will just post this as is, because it's moving too quickly to make any rational conclusions.
To be noted, every time $15 was broken, the market dumped it below preventing it from becoming proper support.
Now, the HKEX:5 line is going to be doing similar tricks on it and FRC fell below it.
Notice the two more recent dead cats I have professionally marked 😼
I did not have HKEX:3 price line on my previous chart, but I see that now there's a clear line there as well.
Only psychological levels matter at this point.
Same ideas:
*It's a personal opinion of mine that psychological levels, whole number resistance and support, should have this much control over price action.
Psychological levels have the most effect when there's extremes of emotions. I feel it's rather self-explanatory.
It's either going towards zero or it's getting bought to prevent it from hitting the pavement.
The variance in price alone is a clear indicator its in deep trouble while it was just downgraded to BB.
Previous low on charts of $17.60 is notable, while HKEX:20 pertains to psychological significance.
Below this, I see little more than psychological levels.
HKEX:10 , double digits. HKEX:5 , where select exchanges consider a stock a penny stock. HKEX:1 , where the rest consider it a penny stock.
You can label a ton of this chart a deadcat bounce here or there.
Please add thoughts. I didn't see a Fibonacci ladder helping much because the price action was too chaotic.
DYOR/DYOC.*

TSLA Relief Rally *Be Careful-(Short Term Bullish)***Warning Monday Jan 2nd (Market is Closed) - Q4 EV Deliveries - good report then TSLA will complete H&S pattern and continue Bullish Island Gap Reversal
Positive:
`TSLA is Very Oversold, we could see a continuation of this bounce up too 150-180 if production release is great on Monday.
-Bullish Chart patterns show inverse H&S pattern created by Island Gap Reversal.
LARGE Buying Volume strong-sign of institutional investment - this could be accumulation phase
Beginning of January tends to be positive for the stock market
NDX & SPX showing signs of upcoming relief rally (*before we make final leg down)
HYG & JNK Bonds are showing bullish divergence
Negative:
Monday possible less deliveries than expected -if is lack luster I can see TSLA dropping 7-12% to retest the low
China Covid Cases/ Shanghai Factory Slow production
Tesla is still in a Strong Bear Market pattern
Elon and Twitter Drama
Earnings report on the 23rd - with factory issues, supply issues - it does not look promising
Macro H&S Pattern puts the measured decline to $90-$80 range
Sentiment:
Short Term -Swing /Day Trading -I am only Bullish for the Short Term* (1-2 weeks) .
Long Term Investing: I am Bullish for Long Term (5 yrs) ....over-all I would choose the $109 area as 1st pt accumulation / $80 area second point / $60 area 3rd pt (TSLA will Grow 25% Sales YoY for next 5yrs) PEG ratio looking good

Bitcoin | Dead cat bounce?The trend drawn from the ATH level of 2011 looks like a pullback movement in the red line. Price can say that the sloping trend line is a pullback movement after it broke down in November of last year. As for the RSI indicator, as indicated by the red circle in the figure, the situation is very close to the scene of the sudden fall in the summer of 2015.
In general, the 15500 zone was the bottom of the bear market, and most traders are anticipating the market with the belief and hope that a bull run has begun. As far as I'm concerned, the bear market is not over and we expect to see another new bottom. This upward movement that has been going on since the beginning of the year is seen as a possible "Dead Cat's Reflection". It is too early to tell if this is the case, as the rate will prove to be a dead cat by breaking below the previous bottom.

ARKK Oversold for NowARKK is looking oversold for the time being. Looking for a nice DCB before seeing some capitulation sell off.

SPY: Very bearish! What could make it bounce?• So far, SPY is heading to the next support at $360.69, indicating we have a few more bucks to drop, and there’s no technical evidence pointing to a reversal. In the daily chart, at least, there’s not a single bullish pattern yet;
• We see some open gaps (yellow squares), and they will become targets, in the future, if (and only if) SPY triggers a reaction;
• In the 1h chart we see a possible bullish structure, a Double Bottom chart pattern. Keep in mind, this pattern wasn’t triggered yet, and maybe SPY won’t trigger it at all, but it is important to keep in mind a scenario where it’ll break the $370.21;
• By triggering this Double Bottom, SPY would bounce back up to the $388 (its next target);
• In my view, I would prefer to see it bouncing after a retest of the $360, but this could work too;
• This wouldn’t be a true bullish reversal sign, and maybe would be just a Dead Cat Bounce, but could be the beginning of a true mid-term reversal. I’ll keep you guys posted on this.
Remember to follow me for more analysis like this! Keep in touch.

CSPR died in January 2021, like RchainHyperinflation during bear market - same marketcap as we had in 20c in August 2021
The team has bad image - team scolding people in Telegram (already deleted), I have screenshot in case people say I am lying
Not listed on any major exchange since listing - hyped up Binance, never came
Still no use case
Slow chain, slow finality - eth2 coming so completely useless
Same team as RChain was also Casper fork - utterly failed
There is heavy selling pressure from validator - in entire bull market it did 10% up maybe then full retrace. I saw it going up by 10-30% many times during autumn 2021, all to retrace. Casperpad was also a scam - but good enough for final double top

Another idea worth considering (end game scenario)Fib pull from the top to the bottom of this move:
A strong rejection off of the 0.5 fib is considered to be a dead cat bounce. In this case, the price was not accepted back above and therefor further down side (below 0) is quite possibly on the line.
Check Morpheus, showing us the perfect setup for a short.
A key support / resistance flip level for me would be the 3810 area (give or take a few dollars). Lose that and it's mayhem.

DEAT CAT BOUNCEHey guys,
I went back in the chart and circled what I considered to be similar situations to where we're at right now. I think over the next month, there is an extremely high chance CAT has a fakeout rally that could very well reach $225/share. That being said, I don't expect it to breach ATH's, and I expect the rally to be an incredible shorting opportunity before a potentially violent markdown phase. The agriculture sector is still relatively high up, and when you look into it, it is fresh off of distribution and primed for a markdown(made obvious in names like DE, CF, and MOO). I am currently waiting on CAT to rally, hopefully up to $220-230/share before selling my position and flipping entirely short on the stock. I expect this stock to see the low $100's well before year-end.
Disclaimer: I was previously short CAT, and am currently long CAT at $180/share in anticipation of a dead CAT bounce(ha)


What's with the Volume on this coin?
Looking at WLUNAUSD, the one thing that I'm seeing is that the Volume of trading on this coin seems to be exponentially greater than what it was when it was at even it's greatest value, or at any time before it crashed.
Is this basically vulture trading, looking to take advantage of the resulting volatility at the bottom here? Or is this some sort of accumulation? The volume spike happened maybe a day after this coin hit its theoretical bottom.

XAUUSD (GOLD) price actionGold showed a dead cat bounce after hitting a fresh three-month low at $1810.
Technical:
The near–term support is around $1800, a breach below targets $1750.
