$BA possible deadcat bounce$BA is running into a somewhat long term trendline here on the monthly log, might be a good area for a dead cat bounce :)
Deadcatbounce

$CL_F head and shoulders on the monthly log -- pt2Well, the h&s I posted on the monthly log has already crazily just about taken it back to the 2015 lows. A bounce should come very soon. The lowest i see this going is probably $26 -- $28.00 area. We could see a bounce before that happens but im not 100% sure. Anyways this should be interesting!

Short the Dead Cat Bounce in the Market.First shock (Friday) and then denial (Monday) are symptoms of the first stage of grief. Earnings surprises to the downside will keep coming for months as companies lower guidance and analysts revise down their estimates. Short on up occasions, and cover on down days. Sound like a plan?

$ES_F bounce$ES_F has began to bounce from the FIB 50% + an older long term trendline as depicted in the chart.

MATICBTC Dead cat bounce 100%+As you can see MATIC experienced a severe drop to the upward trend line but then rebounded ~100%, dead cat bounces are a great way for swing traders too make money if they are paying attention..

MNK: DEAT CAT BOUNCE OPPORTUNITYMNK is dead or almost dead. Often times there is a dead cat bounce in stocks like these, as 'everybody' gets the same idea to throw some money at it.
This is a high risk scenario but with potentially good risk to reward ratios.
Disclaimers : I've clearly said this is high risk. This not advice to trade in securities. I am simply showing what may happen from a perspective of speculative opinion only. Your losses are your own if you enter a trade on this. Kindly sue yourself if you lose your money.

Dead Cat Bounce - A Spooky PatternIntroduction
Its halloween ! And i felt like making a post about spooky stuff related to trading. I wanted to discuss about what is a zombie economy but i clearly don't have the time nor the experience to do that. So instead i'll talk about the dead cat bounce, a pattern commonly found in downtrending (bearish) markets, this pattern is also known as "Bear market rally".
We'll describe the pattern, its causes, its upsides and downsides. Unfortunately my knowledge on price patterns is relatively low, if you feel the need to correct me leave a comment.
Brace Yourself The Dead Cat Is Coming !
A dead cat bounce is a pattern appearing during downtrends, this pattern is associated to a brief upper movement (recovery) followed by a continuation of the downtrend, therefore the pattern can be classified as a retracement.
Terminology
The term "dead cat bounce" comes from the saying that "Even a dead cat will bounce if it falls from a great height", physics won't necessarily agree with that but the phrase can be deconstructed in order to explain the pattern described :
"Even a dead cat will bounce if it falls from a great height "
- Dead : Refer to the downtrend.
- Bounce : Describe the motion of the pattern.
- Great Height : Emphasis on the prior downtrending movement magnitude.
Causes Of A Dead Cat Bounce
Causes of certain motions in prices fluctuations are hard to describe, the structures (trends, cycles/seasonality...)/patterns in price can be either : stochastic (the pattern is formed because of a realizations of random fluctuations) or deterministic (the pattern is formed because of certain external causes).
A deterministic cause of a dead cat bounce is described by Kolja Johannsen as investors taking excessive risk and unprofitable positions in order to recover an initial loss in a declining market, the accumulations of those investors as well as investors believing in a reversal participate in the creation of this upward movement.
Upsides Of Dead Cat Bounces
When a security allow short positions, dead cat bounces allow late investors to go with the downtrend from a more interesting point.
In stock markets they can allow investors to potentially profit from the bounce, however such strategy require extremely precise timing, one must make sure to sell at the maximum of the retracement. Such methodology make the investor exposed to the continuity of the downtrend, thus making the risk reward extremely uninteresting.
Downsides Of Dead Cat Bounces
A dead cat bounce like any retracement is a parasitic motion in the main trend, they might make investors believe in a reversal, in a mathematical standpoint those parasitic motions affect technical indicators, this is where robustness is required, robust indicators might be able to ignore the dead cat bounce.
The dead cat bounce deform the main trend and therefore can add complexity to a trend model.
Above a simple linear trend, we can describe it as a simple line + white noise, such equations are called equations of motions. However describing a dead cat bounce mathematically might require additional complexity.
Detecting/Avoiding Dead Cat Bounces
Classifying upward movements as either a retracement or reversal is no easy task, however we can still make use of several tools in order to detect or avoid dead cat bounces.
The first tool being filters, filtering a dead cat bounce can be made using a low pass filters (filter noise/cyclic components) or notch filters (filter cyclic components). The filter setting must be adjusted in order to be able to filter the pattern.
Blackman filter of period 100
Rolling max/min with period 100 (Donchian channels), no highest low have been detected here, witch allow us to remain with the main trend, note that rolling max/min are also low pass filter.
Another approach might be made using support and resistances, we can see that both the minimum/maximum of the dead cat bounce are both pullbacks, altho this observation is clearly insignificant and lack logic (like most technical analysis approach) unlike the previously discussed method.
Conclusions
Altho my experience on patterns is low, i hope i could teach you something new in this post. Dead cat bounces make parts of those disruptive patterns that might make us take a bad position, we have also seen that they can be made from the emotional bias from investors, that is premature re-entering of a declining market, which is never a good idea. Finally we discussed methods to filter/detect such pattern.
Like most patterns in technical analysis their detection/interpretation is relatively subjective to the user, the uniformity/complexity of stock market prices make detection of patterns quite complex. But the most important thing to take from this post is that strategies robust to retracements can help the investor make better decisions, going long because of a dead cat bounce is not a enjoyable experience, that cat wasn't so alive in the end...Happy Halloween !

This is my call for lunyr down to ~63-65 centscreated this chart a few days ago, this is what i see panning out.

10-10-2019 GBP/USD -Path to deal Brexit? Long!-The Cable held a 61% fib level and bounced from here, thanks to the possible Brexit deal. We may see a complete ABCD cycle before the Brexit happens. 1.268XX looks like an ideal target for the bull-run with U.K. and Irish are working on the pathway to a possible Brexit deal. ----Point "D" meets absolute downtrend line colored in red----

One last dead cat bounce?Is BTC setting up for one last dead cat bounce before the real fall?
I'd say it is by the look of this large falling wedge we have been forming.
Personally it seems to me that this bounce can at least retest 10k again.
What do you think? Will it break 10k? Could it reach 11k?
Leave your thoughts in the comments!

Tradable dead cat bounce soon?Bitcoin is falling within a pattern that suggests a rise is coming soon, which in my opinion will probably be just a dead cat bounce before a continued correction. But for the moment we are close to the support of this pattern, that could be a wonderful entry for a short-term long position (if we actually reach the support line), seeing how this pattern is pretty mature and confirmed by now and the target for the breakout is about a thousand dollars above the current price..

Dead cat bounce incoming?After the breakdown of yesterday Bitcoin looks like it's forming a small falling broadening wedge on the 15 min time frame, which suggests bitcoin might have a small bounce to the upside before probably falling lower. (I would think..)
What do YOU think?
WILL the drop even continue after this bounce?
Will Bitcoin fall to 4,000$?
Will it just go up to 20,000$ again with complete disregard to human logic and reason?
Cast your votes- in the comments below!

Are we in a dead cat FOMO induced bounce?The similarities are uncanny I'm not saying we are going to crash as low as we did in 2014 but I think capitulation then consolidation is probable.

Bad Apple: Paths at ER of 0.62 Fibo Retrace; DeadCatBounce?Chart says all. Not advice. Not a prediction. Just see a very expensive stock of company selling overpriced gadgets trading right at 0.62 Fibo after massive selloff bounce.
Might be fakebreak after first rejection from the TL shown price edged up over the TL. If breakdown below, expect retest of TL then ultimate rejection.
If ER miss, going straight off. If beats, then maybe an A-B-C leading to secondary correction- 'sell the news.' Really risky to be long at $200 if this dog won't hunt. GLTA
PS Credit to HH for idea on ER levels- right back where it got in trouble the last time. Smart money going into T-bills.

Bitcoin Daily Update (day 337)Disclaimer: If you are primarily interested in copying other people’s trades then this is not for you. However, if you are willing to put in the work that it takes to learn how to trade for yourself then you have found the right place! Nevertheless please be advised that you can give 10 people a profitable trading strategy and only 1-2 of them will be able to succeed long term. If you fall into the majority that tries and fails then I assume no responsibility for your losses. What you do with your $ is your business, what I do with my $ is my business.
Click here for my Comprehensive Trading Strategy | Click here for my Comprehensive Trading Process | Click here to learn about the 2 BTC' to 20 BTC' Trading Challenge
Consensio: M MA > S MA > P > L MA
Patterns: Phase 7 Hyperwave | A&E | Bear Channel
Horizontals: S: $3,742 | R: $3,820
Trendline:
Parabolic SAR: W: $4,216
Futures Curve: Backwardation
Funding Rates: Longs receive 0.0183%
BTCUSDSHORTS: Rejected from 9 EMA. Will be interesting to see if it makes lower low
TD’ Sequential: Bullish price flip with todays close, current candle is trying to make bearish price flip
Ichimoku Cloud:.Watching for close above Tenkan-Sen
Relative Strength Index: Continues to support > 50
Price Action: 24h: +0.21% | 2w: +6.6% | 1m: +12.1%
Bollinger Bands: Continues to support > 50
Stochastic Oscillator: Monthly buy signal in confluence with weekly buy signal is very rare / powerful
Summary: In a Telegram conversation with Leah Wald I mentioned that “I can’t remember the last time I felt this bullish about crypto” .
This is only the second time we have gotten a monthly Stochastic buy signal < 20 and the first time it has been < 10. The last time we got that signal it called the bottom of the 2015 bear market. Just so happens that both occurred on a monthly red 8.
I do not think we have found the bottom due to lack of capitulation / FUD as well as Hyperwave theory, however I do feel very confident that we are in for a strong bounce over the next couple weeks / months.
First target is the top of the bear channel that is pictured above under ‘trendlines’. If we breakthrough there then I expect a $6,000 retest / rejection which leads to capitulation and a return to $1,000 / Phase 1. However everything hinges on closing above $4,200. That is due to the massive gap in the visible range volume profile.
If we breakthrough $4,200 on a daily closing basis then that is the final confirmation I will be waiting for. I have already started to build my positions and am ~30% entered. Will make sure that I am 100% entered if we close above $4,200.

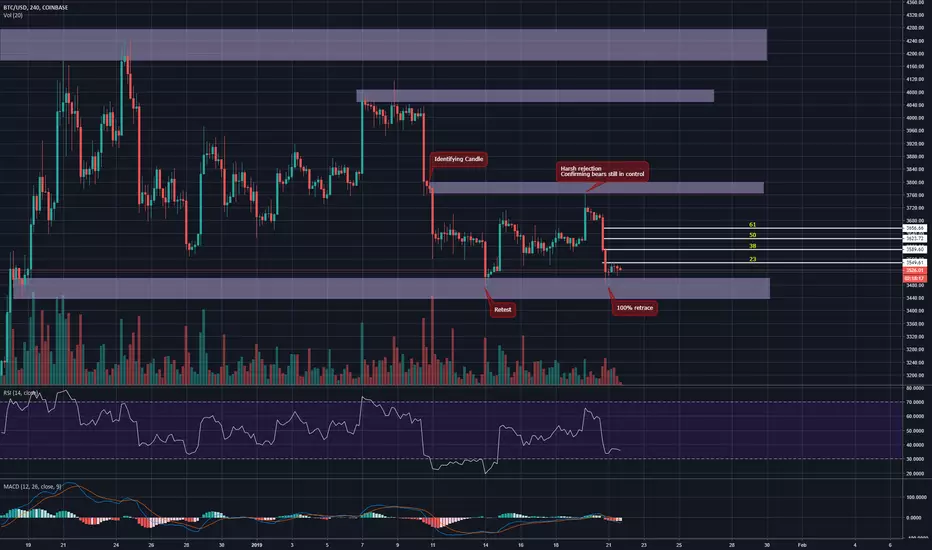
Bitcoin - A glance - 21st January - Channel forming on BTC
- New Supply Zone identified by the bear candle during the selloff (Identifying Candle)
- Perfect bounce and a long signal because of that (Retest)
- Push to the highest quality Supply Zone that’s in control of the market (Harsh Rejection)
- Because of the nature of the rejection, this was a signal to get out of the market
- With a retrace to the highest quality Demand Zone that’s in control
- More recently, a dead cat bounce to the 23 Fib retracement.
- Looking bearish overall
- Unity Trading Group.
Don't be fooled by a dead-cat bounce off of the 200 weekly MA.As I high-lighted in my previous post about the SPY, I anticipated a move down to the 200 weekly moving average after breaking the 100 weekly moving average and a key support zone, and that is exactly what happened. If there was a logical place for a dead-cat bounce, the 200 weekly moving average would be it. If price can steadily climb up back above several key moving averages and hold them as support again, I will change my stance. As of right now, I remain bearish.
-This is not financial advice. Always do your own research and own due-diligence before investing and trading, as for investing and trading comes with high amounts of risk.
Previous SPY analysis:

Why the 200MA needs to be in your arsenalAlthough BTC held the $6000 support for almost of all of 2018, five weeks ago it did eventually fall and saw us tumble down. Many have tried to predict "the bottom" since then, but there is one essential indicator which is heavily respected by the market and something you should include (among other indicators) when making such predictions in your own strategy: the Weekly 200 Moving Average .
As you can see on the chart here, despite a rather rapid fall, we have just bounced perfectly off the weekly 200MA (the red line). If you had known this, it might well have provided a precise exit/entry point on your trades = more profits in BTC and altcoins such as XRP, ETH, EOS and ADA.
Now personally I believe this to be a dead cat bounce, which will take us up briefly over the coming days/weeks, before eventually dumping us back down, this time quite possibly below the weekly 200MA - although it will put up resistance and so is something you should include in your collection of trading tools.
I've provided a link below (see "Related Ideas" for the 50, 100, 200 Moving Average ), so give it a try and add to your favourites if you want a powerful indicator in your arsenal.
Please give me a thumbs up and follow me if you found my analysis interesting.
This is for educational purposes only and not a recommendation to buy or sell.

Dead You Know What Bounce!Bad news invest in something better for the planet like Tesla or Microsoft.

WYNN -6 to -8% drop coming? I've been following WYNN for a while and I use this as one of my recession indicators of the economy. I believe people are head above water high in credit debt and can no longer afford to gamble or visit the casino.
My prediction is a -6 to -8% drop before it does a dead cat bounce up.

Bitcoin - Update [Ascending Triangle Formation Done]We posted yesterday on Bitcoin saying that we might see a bearish ascending triangle towards the next stronger support first at 6k area and we did test that support area. For those who shorted with our call at around 6.5k will save there satoshis in big amount. We will update you on the next move in a very short time. Stay Tuned.

BTC - Time For A Dead Cat BounceBears have delivered a very powerful rejection from 8.5K down to 6K. I am not expecting the 6K level to break without a dead cat bounce first. I have taken partial profit on my short from 8.2k and opened a small long at 6.1k. My target for the dead cat bounce is between 6.8k and 7k. At that price I will close my long and add more to my short. 5k remains the target.
