GBP/USD: Path to 1.3200 on Policy DivergenceThis trade idea outlines a high-conviction bearish thesis for GBP/USD. The core of this analysis is a significant and growing divergence between the fundamental outlooks of the UK and US economies, which is now being confirmed by a bearish technical structure. We anticipate the upcoming UK economic data releases during the week of July 14-18 to act as a catalyst for the next leg down.
The Fundamental Why 📰
The primary driver for this trade is the widening policy and economic divergence. The UK is facing a triad of headwinds while the US economy exhibits greater resilience. This fundamental imbalance favors the US Dollar and is expected to intensify.
Dovish Bank of England: The BoE is clearly signaling a dovish pivot towards monetary easing in response to a weakening labor market and sluggish growth prospects. This contrasts with the Federal Reserve's more patient, data-dependent stance.
Widening Rate Differentials: The divergence in central bank policy is leading to a widening interest rate differential that favors the US Dollar.
Geopolitical Headwinds: Fiscal policy from the new UK government and ongoing trade tensions are creating additional headwinds for the Pound.
The Technical Picture 📊
Price action provides strong confirmation of the bearish fundamental thesis, showing a clear loss of upward momentum and the formation of a new downtrend.
📉 Death Cross: The 50-day moving average has crossed below the 200-day moving average, forming a "death cross," which is a strong bearish indicator.
📉 Key Level Lost: The price has recently broken and is holding below the critical 200-day moving average, a classic bearish signal.
📉 Bearish Momentum: Both the RSI (below 50) and the MACD (below its signal line and zero) indicate that bearish momentum is in control.
The Trade Setup 📉
👉 Entry: 1.3540 - 1.3610
🎯 Take Profit: 1.3200
⛔️ Stop Loss: 1.3665
Deathcross

$BTC Failed to Reclaim EMA9 - 200DMA in SightSo close, but so far away.
CRYPTOCAP:BTC held the 50DMA as support today but failed to break above the EMA9.
I suspect ₿itcoin now makes it way back down for the long awaited retest of the 200DMA ~$95k as I’ve been stating since the death cross.
If BTC can reclaim the EMA9 to close the week there may be a shot to continue the bullish uptrend, otherwise this correction will take a few weeks to play out.

Golden Cross vs. Death Cross: What Do They Really Tell Us?Hello, traders! 🤝🏻
It’s hard to scroll through a crypto newsfeed without spotting a headline screaming about a “Golden Cross” forming on Bitcoin or warning of an ominous “Death Cross” approaching. But what do these classic MA signals can really mean? Are they as prophetic as they sound, or is there more nuance to the story? Let’s break it down.
📈 The Basics: What Are Golden and Death Crosses?
At their core, both patterns are simple moving average crossovers. They occur when two moving averages — typically the 50-day and the 200-day — cross paths on a chart.
Golden Cross: When the 50-day MA crosses above the 200-day MA, signaling a potential shift from a bearish phase to a bullish trend. It's often seen as a sign of renewed strength and a long-term uptrend.
Death Cross: When the 50-day MA crosses below the 200-day MA, suggesting a possible transition from bullish to bearish, hinting at extended downside pressure.
📊 Why They Work (and When They Don't)
In theory, the idea is simple: The 50-day MA represents shorter-term sentiment, while the 200-day MA captures longer-term momentum. When short-term price action overtakes long-term averages, it’s seen as a bullish signal (golden cross). When it drops below, it’s bearish (death cross).
This highlights a key point: moving average crossover signals are inherently delayed. They’re based on historical data, so they can’t predict future price moves in real time.
🔹 October 2020: Golden Cross
On the weekly BTC/USDT chart, we can clearly see a Golden Cross forming in October 2020. The 50-week MA (short-term) crossed above the 200-week MA (long-term), marking the start of Bitcoin's explosive rally from around $11,000 to its then all-time high above $60,000 in 2021. This signal aligned with growing institutional interest and the post-halving narrative, reinforcing the bull case.
🔹 June 2021: Death Cross
Just months after Bitcoin’s peak, a Death Cross emerged around June 2021, near the $35,000 mark. However, this was more of a lagging signal: by the time it appeared, the sharp pullback from $60K+ had already taken place. Interestingly, the market stabilized not long after, with a recovery above $50K later that year, showing that Death Cross signals aren’t always the end of the story.
🔹 Mid-2022: Another Death Cross
In mid-2022, BTC formed another Death Cross during its prolonged bear market. This one aligned better with the broader trend, as price continued to slide towards $15,000, reflecting macro pressures like tightening monetary policies and the collapse of major players in the crypto space.
🔹 Early 2024: Golden Cross Comeback
The most recent Golden Cross appeared in early 2024, signaling renewed bullish momentum. This crossover preceded a significant rally, pushing Bitcoin above $100,000 by mid-2025, as seen in your chart. While macro factors (like ETF approvals or regulatory clarity) also played a role, this MA signal coincided with a notable shift in sentiment.
⚙️ Golden Cross ≠ Guaranteed Rally, Death Cross ≠ Doom
While these MA crossovers are clean and appealing, they’re not foolproof. Their lagging nature means they often confirm trends rather than predict them. For example, in June 2021, the Death Cross appeared after much of the selling pressure had already played out. Conversely, in October 2020 and early 2024, the Golden Crosses aligned with genuine upward shifts.
🔍 Why Care About These Signals?
Because they help us contextualize market sentiment. The golden cross and death cross reflect collective trader psychology — optimism and fear. But to truly understand them, we need to combine them with volume, market structure, and macro narratives.
So, are golden crosses and death crosses reliable signals, or just eye-catching headlines?
Your chart tells us both stories: sometimes they work, sometimes they mislead. What’s your take? Do you use these MA signals in your trading, or do you prefer other methods? Let’s discuss below!

Mastering the Death cross and Golden cross - How to use it!In this guide I will discuss the Death crosses and Golden crosses. The next subjects will be described:
- What SMA to use?
- What is a Death cross?
- What is a Golden cross
- Is a Death cross always bearish and a Golden cross always bullish?
- How did the Death crosses and Golden crosses play out this cycle?
What SMA to use for Deathcross and Golden cross on the daily timeframe
In technical analysis, when identifying Golden Crosses and Death Crosses on the daily timeframe, the most commonly used moving averages are the 50-day and the 200-day simple moving averages (SMA). The 50-day moving average represents the average closing price of an asset over the past 50 trading days and reflects medium-term market trends. The 200-day moving average, on the other hand, represents the average over a longer period and is used to gauge the broader, long-term trend.
What is a Deatch cross?
A death cross is a bearish technical analysis signal that occurs when a short-term moving average crosses below a long-term moving average. Most commonly, it refers to the 50-day simple moving average crossing below the 200-day simple moving average on a daily price chart. This crossover suggests that recent price momentum is weakening relative to the longer-term trend, which can be an early indication of a potential downtrend or extended period of market weakness.
The death cross is often interpreted as a sign of increasing selling pressure and a shift in investor sentiment toward caution or pessimism. While it does not predict immediate declines, it is closely watched because it has historically preceded some significant market downturns. However, like all technical indicators, it is not infallible. Since it is based on past price data, the death cross is a lagging indicator, meaning it often appears after a downward trend has already begun.
What is a Golden cross?
A golden cross is a bullish technical analysis pattern that signals the potential beginning of a long-term uptrend. It occurs when a short-term moving average, typically the 50-day simple moving average (SMA), crosses above a long-term moving average, most commonly the 200-day SMA, on a daily price chart. This crossover suggests that recent price momentum is strengthening in relation to the longer-term trend, indicating growing investor confidence and increasing buying interest.
The golden cross is widely viewed as a positive signal by traders and investors, often marking a shift from a downtrend or consolidation phase to a more sustained upward movement. It reflects a change in market sentiment where shorter-term gains begin to outweigh longer-term losses.
Is a Death cross always bearish and a Golden cross always bullish?
The death cross is not always a purely bearish signal. While it reflects that price momentum has shifted to the downside, it's important to remember that moving averages are lagging indicators. By the time the crossover occurs, much of the downward move may already be priced in. As a result, it's common to see a relief rally shortly after the signal appears. This bounce can catch traders off guard, especially those who enter short positions expecting immediate continued weakness.
On the other hand, the golden cross often sparks a wave of bullish sentiment. Many traders see it as confirmation of a strong uptrend, leading to increased buying pressure. However, just like with the death cross, the lagging nature of the signal means that much of the initial move may have already happened. It's not unusual for the price to stall or even retrace shortly after the crossover, especially if the market has become overextended. In both cases, the market often reacts in a counterintuitive way in the short term, which is why these signals are best used alongside other tools and indicators.
How did the Death crosses and Golden crosses play out this cycle?
In this cycle, we’ve seen three death crosses and three golden crosses on the daily timeframe, with a fourth golden cross currently in the making. Interestingly, all three of the previous death crosses have not led to sustained downside as many might expect. Instead, each one has marked a local bottom, followed by strong upward movement in the weeks and months that followed. These signals, rather than being a reason for bearishness, turned out to be contrarian indicators. The most recent death cross occurred when Bitcoin was trading around 80k. From there, it managed to rebound impressively, climbing back above 111k, a clear reminder that death crosses, especially in this cycle, have not been reliable signals for further downside.
The golden crosses, on the other hand, have behaved a bit differently than usual in this cycle. The first golden cross actually marked a local top, with Bitcoin facing rejection shortly after. During the second golden cross, price action was more neutral, BTC moved sideways for a period before eventually continuing its upward trend. The third golden cross was followed by only a shallow pullback, after which Bitcoin pushed to new all-time highs.
Now, we are approaching the formation of the fourth Golden cross. Based on the pattern of past crosses and current market sentiment, a minor pullback could be on the horizon. It’s not guaranteed, but given the level of euphoria in the market right now, some cooling off would not be surprising. Even if a pullback does occur, the larger trend remains intact, and this golden cross may end up reinforcing that momentum.
Thanks for your support.
- Make sure to follow me so you don't miss out on the next analysis!
- Drop a like and leave a comment!

$BTC Post Death Cross PA Has NOT Confirmed 200DMA - Must Read!Throughout Bitcoin's history it has had 11 Death Crosses (50DMA crossing under 200DMA), and 10 of those times price has retested the 200DMA within ~3 months (with 1 outlier).
Do you know what time it did NOT retest the 200DMA? You might have guessed it… this most recent death cross ☠️
The only outlier that price did not retest the 200DMA within ~3 months was in 2015, where it took nearly a year to retest.
In that time, CRYPTOCAP:BTC ripped 200% just 75 days later, which marked the start of the PARABOLA.
This is why I have been so adamant with sticking to my base case for Bitcoin’s next move.
Is this time different? 🥸
Will it take nearly a year to retest the 200DMA?
An interesting observation I found was that if we take 90D from the most recent death cross, it brings us out to July 6th, which is right around when the 90-day pause of tariffs is lifted 🧐
Having said all that, if PA confidently breaks above and confirms previous ATH (~$110k), I will lean towards the 2015 outlier for the 200DMA retest, which would put us into late Q1 2026.
That would line up nicely with a suspected top of the cycle 🥲

BTC - Is this rally sustainable and what to expect?In the past two days, Bitcoin has experienced an impressive surge in price, exploding from around 85k to over 94k, showing strong bullish momentum. This rapid movement has certainly caught the attention of many traders and investors. However, while the price action has broken through previous lower highs, signaling a potential shift in market sentiment, it's crucial to approach this rally with caution.
Although the recent price increase indicates that bullish momentum is in play, it's important not to overlook the possibility of a short-term pullback or consolidation. The market has shown volatility before, and while breaking the lower-high structure is a positive sign, it doesn’t necessarily guarantee sustained upward movement.
In this analysis, I will dive deeper into the current price action and what it means for BTC short-term outlook. We’ll explore the factors to watch in the coming days and the potential risks that could challenge the bullish trend.
------------------------------------------
What will we discuss:
- Golden Pocket fibonaccy with resistance
- Point of Control
- Stochastic RSI
- The deathcrosses
------------------------------------------
Golden Pocket fibonaccy with resistance
The golden pocket Fibonacci zone (0.618–0.65), measured from the highs to the lows on the higher timeframe, is located between 96,450 and 97,580. This area aligns with a key resistance level that previously triggered a strong move down in BTC. The golden pocket often acts as a strong rejection zone, and bears are likely to try defending this level again. So be careful on how price will move into this level and how it reacts.
------------------------------------------
Point of control (POC)
The Point of Control (POC) for the entire trading range from November to the present is located precisely at 96,450. This level is particularly significant as it aligns with multiple technical factors, creating a strong confluence zone. Not only does it coincide with a well-established resistance area that previously initiated a sharp move to the downside, but it also sits within the golden pocket Fibonacci.
The POC marks the price level where the highest volume of trading activity has occurred during this entire range, indicating a strong area of interest for both buyers and sellers. High-volume nodes like this often act as magnets for price and tend to offer either strong support or resistance depending on the context. In this case, with the POC positioned within a broader resistance zone, it becomes an even more formidable barrier.
------------------------------------------
Stochastic RSI
The Stochastic RSI on the daily timeframe is currently in the overbought zone, where it has remained for approximately 10 consecutive days. This prolonged stay in overbought territory suggests that bullish momentum may be weakening and the indicator is beginning to show signs of exhaustion.
Typically, when the Stochastic RSI hovers in this upper range for an extended period without a meaningful pullback, it signals that a reversal or at least a slowdown in the prevailing trend could be imminent. The oscillator appears to be running out of steam, and barring a sudden surge in buying pressure, it is likely to start curling downward in the coming days or within the next week.
This could imply a shortterm correction is luring.
------------------------------------------
Deathcrosses this cycle
A deathcross is a bearish technical indicator (lagging) that occurs when a shorter-term (50-day MA) crosses below the longer-term (200-day MA).
Deathcross 1
At the time of the first death cross, the price of BTC had already formed a local low before the crossover occurred. Following the death cross, BTC experienced what is commonly referred to as a "death cross rally" — a counterintuitive move where price rallies shortly after the bearish signal.
This rally was significant, as it broke short-term market structure to the upside and eventually found support at the 50-day MA, the same level that previously acted as resistance. That support held, even during a brief rejection, and marked a key shift in momentum.
From there, BTC continued its upward move and eventually went on to make new highs, effectively invalidating the immediate bearish expectations typically associated with a death cross.
Deathcross 2
The second death cross in this cycle occurred after Bitcoin had already established a local low and began moving back upward toward the death cross. Initially, BTC struggled to break above the 50-day MA, but it eventually managed to push through.
However, this time, during the subsequent correction, Bitcoin was unable to hold the 50-day MA as support. Instead, it formed a higher low, indicating a shift in market dynamics and suggesting that the selling pressure may have been weakening. This higher low marks a crucial point in the price structure, as it hints at potential bullish momentum building, despite the earlier bearish signal from the death cross.
Deathcross 3
This time, the low was established right at the moment of the death cross, and BTC began to move upward immediately after the crossover occurred. After initially struggling to break above the 50-day MA, BTC surged higher and managed to surpass both the 50-day and 200-day MA.
Currently, BTC is facing strong resistance at these levels. The question now is whether BTC will correct and find support at the 50-day MA once again, as it did during the first instance, or if it is aiming to form a higher low, similar to the second occurrence.
In both scenarios, Bitcoin has historically experienced a pullback after a few days of upward movement, so a correction at this point would not be surprising.
------------------------------------------
Thanks for your support.
- Make sure to follow me so you don't miss out on the next analysis!
- Drop a like and leave a comment!

$BTC Rejected at .618 Fib - Correction Coming!Textbook rejection at the .618 Fib for CRYPTOCAP:BTC
Now on its way to retest the 200 and 50DMA as expected.
If that does not hold, we’ll go back to my original inverse head & shoulder idea ~$78k.
This will be the catalyst for Bitcoin’s next leg up to $130k end of June.

THE DEATH CROSSDeath Cross Triggered During Consolidation: What It Could Mean
The 50 SMA (blue) just crossed below the 200 SMA (red), signaling a Death Cross—a traditionally bearish indicator. But here’s the catch: this didn’t happen during a steep downtrend. It happened during consolidation.
That changes the narrative.
When a Death Cross forms during a period of sideways chop instead of a clear downtrend, it often reflects lagging momentum, not accelerating weakness. It can trap shorts expecting a breakdown, especially if price is coiling above strong support or forming a basing pattern.
💡 Key things I’m watching:
Does price respect the consolidation range low?
Are we forming a bullish divergence on RSI or MACD?
How does volume behave around the cross?
This may not be a "short and hold" moment—this might be a shakeout before trend resolution. Stay sharp. Don't trade the cross, trade the context.

S&P 500 Index Goes 'Death Crossed' Again, Due To Unruly EconomyThe "Death Cross" is a technical chart pattern signaling potential bearish momentum in the US stock market, occurring when a short-term moving average (typically the 50-day) crosses below a long-term moving average (usually the 200-day).
Despite its foreboding name, historical data shows its implications are often less dire than perceived, serving as a coincident indicator of market weakness rather than a definitive predictor of collapse.
Historical Examples and Market Impact
The death cross gained notoriety for preceding major market downturns:
2000 Dot-Com Bubble: The Nasdaq Composite’s death cross in June 2000 coincided with the burst of the tech bubble, leading to a prolonged bear market.
2008 Financial Crisis: The S&P 500’s death cross in December 2007 foreshadowed the 2008 crash, with the index losing over 50% of its value by early 2009.
2020 COVID-19 Crash: The S&P 500, Dow Jones, and Nasdaq 100 all formed death crosses in March 2020 amid pandemic-driven panic, though markets rebounded sharply within months.
2022 Ukraine's War Crisis: The S&P 500, Dow Jones, and Nasdaq 100 all formed death crosses in March 2022 due to proinflationary surge on Ukraine's war and Arab-Israel conflict, leading to a prolonged bear market within next twelve months, up to March quarter in the year 2023.
These examples highlight the pattern’s association with extreme volatility, but its predictive power is inconsistent. For instance, the 2022 death cross in the S&P 500—its first in two years—occurred amid Fed rate hikes and geopolitical tensions, yet the market stabilized within weeks rather than entering a prolonged downturn.
Perspectives on Reliability and Use Cases
While the death cross reflects deteriorating short-term momentum, its utility depends on context:
Lagging Nature: As a lagging indicator, it confirms existing trends rather than forecasting new ones. The 50-day average crossing below the 200-day often occurs after prices have already declined.
False Signals: Post-2020 data shows the S&P 500 gained an average of 6.3% one year after a death cross, with Nasdaq Composite returns doubling typical averages six months post-cross.
Combined Analysis: Traders pair it with metrics like trading volume or MACD (Moving Average Convergence Divergence) to validate signals. Higher selling volume during a death cross strengthens its bearish case.
Strategic Implications for Investors
For market participants, the death cross serves as a cautionary tool rather than a standalone sell signal:
Short-Term Traders: May use it to hedge long positions or initiate short bets, particularly if corroborated by weakening fundamentals.
Long-Term Investors: Often treat it as a reminder to reassess portfolio diversification, especially during elevated valuations or macroeconomic uncertainty.
Contrarian Opportunities: Historical rebounds post-death cross—such as the 7.2% Nasdaq gain three months after the signal—suggest potential buying opportunities for risk-tolerant investors.
Fundamental Challenge
Stocks Extend Drop as Powell Sees Economy ‘Moving Away’ From Fed Goals
Powell sees economy ‘moving away’ from job, price goals due to Trump's tariff chainsaw.
Fed well positioned to wait for policy clarity. Strong jobs market depends on price stability, he adds.
Stocks extend declines, bonds rally as Fed chair speaks.
Conclusion
The "Death Cross" remains a contentious yet widely monitored pattern. Its dramatic name and association with past crises amplify its psychological impact, but empirical evidence underscores its role as one of many tools in technical analysis. Investors who contextualize it with broader market data—such as earnings trends, interest rates, and macroeconomic indicators—are better positioned to navigate its signals.
While it may foreshadow turbulence, its historical track record emphasizes resilience, with markets often recovering losses within months of the pattern’s appearance.
--
Best wishes,
Your Beloved @PandorraResearch Team 😎
// Think Big. Risk Less
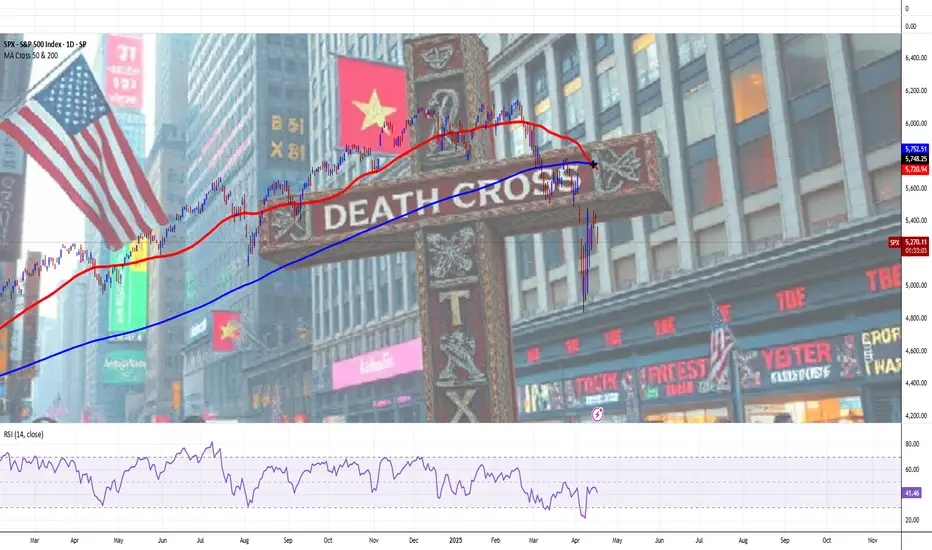
DEATH CROSS on the SP500?We just witnessed the 50-day SMA crossing below the 200-day SMA — a technical signal known as the Death Cross.
Historically, this pattern has been associated with:
Trend reversals from bullish to bearish
Extended downside pressure
A loss of investor confidence in the short-to-medium term
🧠 While not always followed by major crashes, the last time this pattern showed up in a similar setup was followed by an accelerated drop — and that’s exactly what we’ve seen again.
The real question now is: 👉 Was this a false signal or is more downside ahead?
🔍 Keep an eye on price action around the 5,400–5,500 zone. If it fails to recover, this death cross might just be the start of a deeper correction...

2012-2017 Deathcross Goldencross Pattern for BTC Deathcross then Goldencross then Deathcross creating a zone indicates a bearish move.
The time to sell before bigger dump ahead
Goldencross then Deathcross then Goldencross creating a zone indicates a bullish move.
The time to buy before bigger pump ahead

$BTC Inverse Head and Shoulders Finally FormedAnd just like that, the Death Cross has formed the right shoulder for the Inverse H & S idea I formed on March 14th
We may sit a bit more downside to retest the 50WMA at $76k for confirmation
If we get a V-shaped recovery tomorrow, this very well could be the bottom for CRYPTOCAP:BTC

Death Cross forming now on NDX weekly chartHi Renny here back with a chart for you guys to check out.
50 dma can be seen to be crossing below the 200 dma.
Look what happened after the last time that happened in 2022...
You would have done well to take money off the table the last time the 50 dma crossed below the 200 dma.
What's your take? Is there more downside from here?

Bitcoin Breakdown Head & Shoulders Pattern Death Cross in Play?This daily BTC/USD chart is showing a potential Head & Shoulders pattern, which is a classic bearish reversal structure. But that’s not all Bitcoin is also at risk of forming a Death Cross, signaling deeper downside potential. Here’s what stands out:
🛑 Key Bearish Signals:
🔻 Head & Shoulders Formation: The pattern consists of a peak (head) with two lower peaks (shoulders) on either side, indicating a loss of bullish momentum.
🔻 Neckline Breakdown: BTC is testing the neckline support around $76,000—a break below this level could trigger further downside.
🔻 Death Cross Forming: The 50 SMA (yellow) is sloping downward, getting dangerously close to crossing below the 200 SMA (blue)—a well-known bearish signal that could accelerate selling pressure.
📉 Bearish Targets if Breakdown Confirmed:
If BTC breaks below $76,000, the measured move projection suggests a possible drop toward $50,000-$52,000, aligning with previous structure support.
🚀 Bullish Case – Can BTC Recover?
For bulls to regain control, Bitcoin must reclaim $88,000+, invalidate the breakdown, and push above key moving averages. Otherwise, downside pressure remains strong.
⚠️ Final Thought: Death Cross + Head & Shoulders = Bearish Storm?
A Death Cross happening alongside a Head & Shoulders breakdown is a dangerous combination for bulls:
- A Death Cross occurs when the 50-day moving average crosses below the 200-day moving average, signaling a long-term trend shift to the downside.
- Historically, BTC has seen major sell-offs after this formation, especially when combined with bearish structures like we see now.
- If BTC loses $76,000, the next stop could be $50,000-$52,000—but if bulls defend this level and reclaim FWB:88K +, they can avoid disaster.
Verdict : Bitcoin is at a make-or-break moment—either bulls step in now, or we could see a steep drop ahead. Will you short, or do you think this is a bear trap? Let’s discuss! 🧐🔥

Bitcoin Price Action: Breakdown in Progress Bitcoin is showing clear signs of a breakdown from a rising wedge pattern, a classic bearish reversal structure. The chart suggests that BTC failed to sustain momentum above key moving averages and is now heading toward critical support zones.
Key Observations:
🔹 Rising Wedge Breakdown: BTC recently broke below a rising wedge, indicating potential further downside.
🔹 Moving Averages as Resistance: The 200 SMA (blue) and 50 SMA (yellow) are acting as resistance, confirming bearish momentum.
🔹 Support & Target Levels:
First Target : Around $79,845 - $78,516, aligning with previous structure support.
Second Target : $75,762 - $72,500, where strong demand could emerge.
What’s Next?
Bearish Case: If Bitcoin fails to hold the $78,000-$79,000 zone, we could see further declines toward $72,500.
Bullish Rebound: A strong bounce from support levels could push BTC back toward $85,000, but it needs to reclaim key moving averages to confirm strength.
🚨 Final Thought: Bitcoin bulls need to step in soon, or we might see deeper corrections ahead. #DeathCross

$BTC Death Cross Forming Inverse H & SAs expected, CRYPTOCAP:BTC is rolling over, hopefully to form that right shoulder for the inverse h & s patter to confirm the next leg up.
This dumped is fueled by the impending death cross, which historically marks big reversals, since the cross is already priced in.

$INDEX:BTCUSD Action Potential? End of Day decisionINDEX:BTCUSD We see BTC continue to eat people trying to long this market based on low timeframes.
BTC is currently in an uptrend on the micro but overall there is a bearish cloud that continues combatting all growth
I believe this is artificial and tonight's close below the sup/res area at 95,500 will see another test 0f the support trend line.
if that breaks and cannot set new highs above the flipped sup/res trend that should open the way for a crawl towards 200EMA

CNH JPY Short Suggestion: Trade For Monday 9 Sept.24
This is the Daily chart for the Chinese Yuan & Japanese Yen. You can see following along the trend line how strong the Yuan was until a month or two ago - when it sharply sold off - 50 EMA diving under the 200 EMA creating a 'death-cross' which can signal a trend change. Even the last couple of Daily candles resumed this weakness down.
So, I see the Yuan falling some more and perhaps quite swiftly down to the levels and take-profit levels I have clearly marked.
One thing to be aware of is that the Yuan is heavily oversold at the moment & I see demand coming back into it very soon after this final 'flush-down' plays-out. Then we might trade it back up when I see enough demand coming back into it.
easy_explosive_trader
Chris

$SOL Death-Cross Looming on 4-hrDeath-Cross looming on the CRYPTOCAP:SOL 4-hr
Price closed well below the .236 fib and BMSB.
Next retest will be $122
I'm still looking for a daily close ~$110 before the next leg up.

Bitcoin’s "Death Cross" Bitcoin's drop below $58,000 has triggered a "Death Cross," signaling a potential new wave of selling. This pattern occurs when the 50-day moving average (DMA) crosses below the 200 DMA.

Bitcoin eyes 44 000 $ - Death cross signals larger correctionBitcoin is currently targeting the $44,000 level, a key area where multiple former support lines converge and where the 1.618 fibonacci retracement target is. This level also aligns with the potential completion of Elliott Wave 4, setting the stage for a possible upward push.
The recent Death Cross—where the 50-day moving average crosses below the 200-day moving average—signals a larger correction may be underway. Historically, this pattern has often preceded significant market downturns. However, the $44,000 zone could serve as a critical support level, possibly marking the end of the correction.
If BTC holds this level and completes Elliott Wave 4, we could see the beginning of a new bullish wave, potentially pushing the price toward the $100,000 mark. While the current outlook is cautious, the long-term potential for Bitcoin remains strong in my opinion.
Here are three reasons why the scenario of Bitcoin reaching $44,000 before a push toward $100,000 might unfold:
Macro-Economic Uncertainty: Bitcoin's short-term outlook is influenced by macroeconomic factors like rising interest rates, a stronger U.S. dollar, and global recession fears. These elements could reduce demand for riskier assets, potentially leading to a price decline despite Bitcoin's long-term potential.
Strong Support at $44,000: This level is significant due to the convergence of several former support lines, making it a likely area for buyers to step in and stabilize the price, potentially marking the end of Elliott Wave 4.
Fundamental Drivers: Despite short-term bearish signals, the long-term fundamentals for Bitcoin—such as increasing institutional adoption, limited supply, and inflation concerns—remain strong. These factors could fuel a rapid recovery and push BTC to new all-time highs after the correction.
Thanks for reading and make sure to follow as I post more charts weekly!
X:@PuppyNakamoto
BINANCE:BTCUSDT COINBASE:BTCUSD BITSTAMP:BTCUSD BINANCE:BTCUSD KRAKEN:BTCUSD BITFINEX:BTCUSD

BTC at Risk - Death Cross Signals Potential Drop!Welcome to another analysis, where I dive into the latest developments with BTC and explore the potential paths ahead.
I'm becoming increasingly bearish on BTC following the confirmation of a "Death Cross," where the 20- and 50-day moving averages have crossed below the 200-day moving average. This pattern is often seen as a strong indicator of a bearish reversal and the start of a new downward trend.
Historically, when we experienced a "Death Cross" in January 2022, BTC dropped from $50,000 to $15,000 per coin. While there have been instances where BTC recovered after a Death Cross, given the current pattern of lower highs and lower lows, coupled with the ongoing uncertainty and volatility in the stock market, I believe the bearish scenario is the most likely outcome.
Although I'm long-term bullish on BTC, it might be time for the cryptocurrency to take a breather, potentially allowing altcoins to take the spotlight!
Be sure to follow for more updates like this! I also post daily on X: @PuppyNakamoto.
Thanks for reading, and good luck with your trading!
BITFINEX:BTCUSD KRAKEN:BTCUSD BINANCE:BTCUSD COINBASE:BTCUSD BITSTAMP:BTCUSD BINANCE:BTCUSDT

Bitcoin Death-Cross on the Daily Looks BEARISHYuh-OH 😲
CRYPTOCAP:BTC Death-Cross playing out just as expected.
Bulls better pray we don't break below $55k 🤓
