Bitcoin on track for Bear MarketBearish Cross EMA forecast 17th June - Dependent on price action
Spot Price Trading Above the Futures Price - Bearish
Not Financial Advice
Deathcross

BTC - Weekly Elliot Wave FormingLooking at the Weekly charts, you can see a textbook Elliot Wave beginning to form.
Wave 1 was the bull market before COVID.
Wave 2 was the COVID crash.
Wave 3 was the bull market that took us towards 65k.
Wave 4 is what we're experiencing now.
My guess (and hope) is that somewhere between $20-30k will be the bottom of our 4th wave. With the impending Death Cross coming in about a week, I find it hard to believe that we won't see a dip to at least $28k.
The 5th wave is very hard to predict, but I'm hoping to see a push towards $100-150k before Summer of 2022.
Be safe.

Does The Death Cross Really Matter? (Amazon & Bitcoin)This is inspired by TradingShot's recent post (love their analysis). They posted all the instances of the daily death cross in Bitcoin's price history. For those who aren't aware, the death cross occurs when the 50 day moving average crosses below the 200 day moving average. If Bitcoin doesn't move well above $50k in the short-term, it's likely the death cross will occur relatively soon. The name is scary, of course, but just as the media tends to put forth bearish articles when price is doing poorly (since more people engage with content that confirms their bias), the death cross can simply be something that tends to occur when price stagnates or moves lower for a little while. Essentially, it could be meaningless.
I'm convinced sentiment and psychology are a lot more important than indicators such as Moving Averages (especially on the daily timeframe ). When I first started writing analysis, I didn't even include MA's at all. I began including them because I eventually realized how trading bots and algorithms use them to their advantage. And they do seem to be useful on bigger timeframes, such as the weekly and monthly.
Anyway, I keep thinking about how everyone is using past Bitcoin price action to determine current probabilities....but there are signs Bitcoin is maturing as an asset. In this case, I look at other assets that have matured (or solidified) over time. Take Amazon stock, for example. Prior to 2010, AMZN had 6 death crosses on the daily chart . 2 of them resulted in bull traps, while the other 4 indicated immediate new lows.
1. 5th August, 1999 - close of $48.63. Price declined to $41 a few days later before the bull trap to second peak of dotcom boom at $113. Selling at that death cross, and you'd have to sit on your hands.
2. 15th March, 2000 - Decline from near $63.75 to $5.51 on 1st October, 2000 (over 90% drop).
3. 24th March, 2004 - took a year to decline from $39 to $31 (less than 25% drop).
4. 9th March 2006 - Decline from $35 - $26.
5. 28th February 2008 - Short-term decline from $67 - $60ish before a bull trap to $90 in August 2008.
6. 14th October 2008 - Decline from $55.86 to $34.68 in November 2008 (bottom of financial crisis).
Since then, there have been 7 more death crosses for AMZN . None of these produced any extensive bearish period. If you sold at 3 of those death crosses, there was no opportunity to buy lower afterwards. Even after the 4 that resulted in price declines, it would have been difficult to time the bottom, since ONLY ONE of them resulted in a decline of more than 10% (December 2018), making selling largely pointless.
1. 8th July, 2010 - The low had already been set a few days earlier. Closed at $116 and the golden cross occurred in September, when price was $150. Never saw such low prices again.
2. 29th December, 2010 - this death cross marked the exact low near $167.
3. 2nd May, 2004 - Close of $308. This is one case where price headed lower shortly thereafter, heading to the bottom of $284 a week later.
4. 28th March, 2016 - close near $580. Price was in an uptrend and continued afterwards. Golden cross three weeks later.
5. 12th December, 2018 - $1663 close, price dropped to a low of $1307 by Christmas Eve for the bottom of the tech capitulation.
6. 10th October 2019 - close at $1720. Golden cross in Feb. 2020, right before the COVID crash. AMZN dropped to $1626, so I suppose this one worked out as well, though the decline was less than $100.
7. 19th April 2021 - close at $3372, Golden cross just 10 days later, BULL TRAP to a low of $3127. Price is now almost back to what is was on the day of the recent death cross.
What does this all mean? It's possible that MA crosses don't matter so much on the daily timeframe once long-term confidence in an asset has been established, and particularly once institutions become involved. They may only indicate a temporary slowdown of momentum (or may simply be a result of momentum that has already slowed). Selling at death crosses in the first 10 years of Amazon would have given some pretty great swing trading opportunities, but this changed significantly in the next decade, as Amazon established itself as the behemoth it is today. This is likely because when it was a young asset there was a lot more uncertainty. Buying the dip wasn't necessarily a "given." Will that change with Bitcoin? We'll see.
Now let's look at Bitcoin Death Crosses
1. 27th December, 2011 - Close at $4.80, decline to $2. 01 in November.
2. 9th April, 2014 - close near $440, declined to near $346 over the next two days. Then price rebounded above $600 over the summer (this was a bull trap).
3. 5th September, 2014 - $480.52 close, eventual decline to $163.88 (bear market bottom on 14th Jan. 2015).
4. 14th September, 2015 - close near $230. Price briefly dropped a few dollars lower over the coming days but basically moved up from there. Good place to buy.
5. 31 March, 2018 - Close at $6925 before short squeeze to near $10k in May. Only a good place to sell if you had the patience to wait until later in the year. The next golden cross was a year later near $5500. Waiting for that cross didn't give you a huge discount.
6. 26th March 2020 - Close at $6764. Price briefly headed sub-$6k over the coming days, but that was pretty short-lived. This was a good buy-in point.
Even with Bitcoin , it's not always a surefire thing. And just as with Amazon, the worst declines after the death cross occurred were within the first few years of its existence. If Bitcoin and crypto are to continue solidifying their presence in global markets, and as assets, we might consider the possibility that the daily death cross doesn't mean much at all, aside from simply confirming that bullish momentum has been lost in the short term.
This is not financial advice! Just something I noticed. This is meant for speculation, education, and entertainment only.
-Victor Cobra

BTC PPV Fight - 50 Day MA vs 200 Day MAThis is the MAIN EVENT OF THE EVENING!
Presented by Bulls, Bears, Whales, & Leverage.
Our three judges scoring this contest are.. Elon Musk, Michael Saylor, & Satoshi Nakamoto.
And NOW, Ladies and Gentlemen of TV, this is the moment you and the degenerates around the world have been waiting for!
LIVE from my wife's boyfriend's basement, IT'S TIME!
INTODUCING first, fighting our of the white corner, weighing in at a current weight of $45,600, the 50 DAY MA!
INTRODUCING the CHAMPION, fighting out of the pink corner, weighing in at a current weight of $42,120, the 200 DAY MA!

LTCUSD DEATH CROSS - WILL IT SURVIVE?Litecoin is struggling to cross above the DAILY 200 EMA , this could indicate weakness at the moment.
Will it survive the retail psychology?
Discuss with us in the comments!


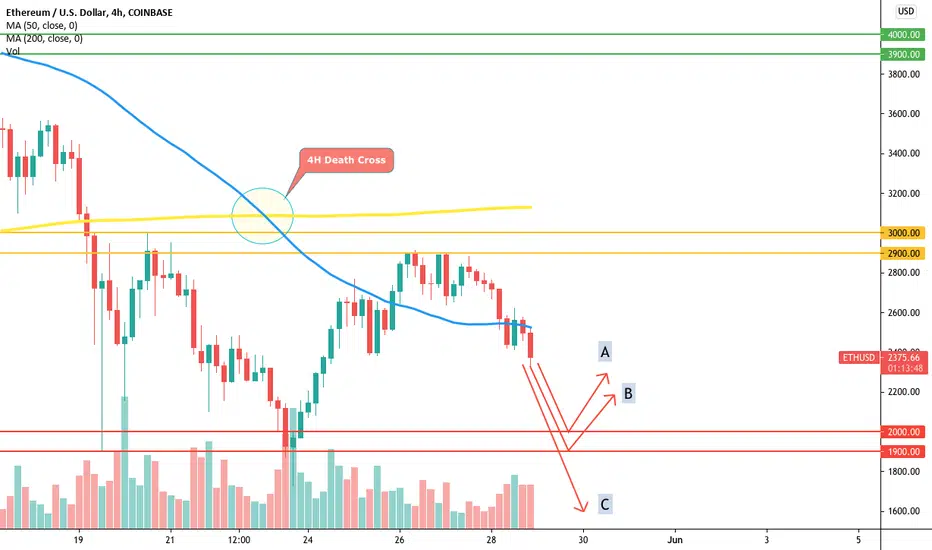
Most Likely ETH possibilities drawn outTake a look and decide for yourself
A. B. C. D.
Please comment what you think will happen. This isn't YouTube, Im not asking for you to comment so that I get more money for trending, I just want the community to try to come to a consensus so we can get a better feel for what other traders are thinking.

Daily Death Cross Would be better if we could somehow avoid the death cross but it looks like its going to happen in the middle of this month.

Bitcoin Death and Golden Cross on the Daily Time FrameIn a recent publish on my chart regarding the Death Cross. This is the same chart just zoomed out so you can see at which point in the $BTC #Bitcoin history did the Golden and Death Cross occur and what was the actual result. Now this is a chart and charts don't lie. Plain and simple facts. You will also see the number of fake outs that occurred and immediately what the price of $BTC #Bitcoin did after. There is also a concern that if $BTC #Bitcoin carries on it's sideways movement the Death Cross will be killed but unfortunately this is not the case. In order for the Death Cross to be invalidated is for the price of $BTC #Bitcoin to go up and keep going up and not to go up and retrace to the same price levels again and again just like we are seeing now in the price of $BTC #Bitcoin

BTC so bearishA bearish pennant and a death cross? Maybe we get another chance to buy very very cheap. Not sure if I did it right so feedback is welcome. Thanks

BITCOIN - Death Cross + Fib TimeBTC death-cross looks like it will happen somewhere between the two trend-based fib time projections. Trends do not magically implode at the sight of a death cross and often price is on a bounce as they do, but it is interesting that the DC is lining up with the time fibs. I am looking to fib time to provide a more accurate projection because they are a fractional extrapolation of stability found in phi / golden section and so more likely to find a continuation / reversal point. But it looks like DC will happen at the 1.618 fib of pivots 1,2,3 so I roughly guesstimate the wave 4 collapse will begin around 12th June.

BTCUSD. The Bullish and Bearish Scenario. Which will happen?Hi everyone,
Thank you for considering reading my idea.
Here we have, as well all know, TWO POSSIBILITIES: (a) If we're on a bear market or; (b) we are STILL in the middle of the bull market. Who knows? Nobody. What actually matters is Bitcoin's price movement in the future. There are LOTS of great TAs but some of them may be based on their biases. They want it to go up for gains or they're just really bearish to accumulate more Bitcoin at lower prices. Either way, we should all be prepared for what Bitcoin will do next and make great TAs to navigate the market on what will MIGHT happen in the next minute, hours, days, weeks, or months.
Here's what we need to look forward to in the NEXT FEW WEEKS.
Let's start with the Bearish Scenario :
If we continue trading below 20MA in the next few months, we will get our death cross and Bitcoin's price may be LOWER than the 50MA before the death cross happens. See 2013 and 2017 bullruns. For those who're new out there, a death cross (see orange arrow) is when the 20MA crossed downwards the 50MA. From there, we will likely get rejected the 50MA until the price reach the 200MA.
Now, with the Bullish Scenario :
We need to pump like hell to prevent the death cross. See 2013 and 2017 bullruns where the death cross happened months after the peak is reached. But how do we know what price we should pump everyday to prevent this death cross? According to Benjamin Cowen on his recent video about Bitcoin's Death Cross and how to avoid it, the data suggests that we need to pump $800 every day to avoid the death cross (starting June 5 GMT+8). It's not necessary to pump exactly $800 every day but on average, it needs to be $800. For example, on day 1, we pumped $400 only but on day 2, we pumped $1200. For more explanation, you may want to check him out on YouTube.
To safely navigate the market and prevent biases, check out Alessio Rastani also on YouTube. These 2 analysts are one of the best imo on YouTube so I recommend for you to check them out if you have not.
For my TAs, if we're going to continue this bullrun or we're currently on a bear market, please see my analyses on the Related Ideas below.
Like this idea and follow me for more analysis like this.
Cheers,
Juvs

Death Cross-Daily chartDeath Cross is about to happen.
What does this mean?
The death cross is a technical chart pattern indicating the potential for a major sell-off. The death cross appears on a chart when a stock's short-term moving average crosses below its long-term moving average.
Please like and share the idea.
Thanks.

ETH showing weaknessDeath cross on the 4H chart with ETH falling. Could check back to the 2,000 or 1,900 level but it could possibly break through that. Should bounce back once it finds a bid and some support.
Which scenario or path do you think is more likely? A, B, C, or none of the above?

Solar Energy ETF - Death CrossChart shows death-cross highlighted as a pink circle. The definition of a death-cross is when the 50sma crosses below the 200sma.
This technical pattern signals further downside.
The red horizontal level R1, is the bullish short-term target, if we can cross the 50 (orange) and 200 (red) moving averages, and revert the death-cross. However, unless we can stay above the mid-level (blue-line), that is unlikely happening..
S1 could be an important support around $58, as we see a couple of tests back in September 2020.
OBV shows lower lows, supporting the downtrend.

BTC: Last chance for survival.Every time a death cross happened (200/50MA cross) BTC has entered into a bearish cycle.
During JULY 2017 bullrun, BTC was close to complete a deathcross, 50 and 200MA were getting closer, but after the "dip" a strong rejection happened and price recovered.
That was BTC hope for nowadays price action once we fell from 64k, but then 30k flash crash happened and 200MA 1D (39k) was pierced.
Can we go push prices above 200MA 1D massively and quick so 50MA moves higher quickly and draws away from 200MA avoiding a massive death cross?
It's last BTC hope for resuming the bullrun, otherwise BTC will complete a wyckoff distribution following by an accumulation which may take months.
Marketbuy or crash.
NFA.

May maybe The EndCenario for the end of this bull run.
Massive H&S
I dont think we will ever see 20.0k again.
PS. There is a bullish cenario if we avoid 30k area.

Bitcoin: DeathcrossBitcoin was looking very bullish because of the goldencross a few days back. But now it is about to form a deathcross because of the redline (50ma 4h) crossing the greenline (200ma 4h) from above, wich is a bearish pattern.
The 100D MA is the first support to look for because we held that previously. If we break through that support you want to look for the 128D MA wich is also the 20W MA .

Bear pennant or Adam & Eve (double bottom) ?I saw someone pointing out a bullish scenario and i drew it out.
So the bear case; Bear pennant, Death cross and broken trendline.
Bull case; Bitcoins gonna bitcoin.

Bitcoins broken trend and death crossThe trendline that has been holding for a couple of months has been broken and a death cross has appeared on the 4h chart.

BTCUSD COINBASE: 4HR . A Very, Very, NASTY cross...BTCUSD COINBASE: 4HR . A Very, Very, NASTY cross...
CAVEAT: This is not financial advice.

$Bitcoin are we facing a death cross, again?Hi all,
Just wanted to hear your thoughts on, if we are facing a death cross again like we did back in September 2020?
I don't think so, but EMA 50 will come very close to EMA 200 if the market drops again.
Love to hear your opinion! ;)
Take care and beware of the whales
