Zooming downwardsLooks like a death cross has formed on the daily chart for zoom. I’ve initiated a short position. Good luck to all.!
Deathcross

Death Cross Chart Pattern - GoldA death cross occurs when the 50-day moving average crosses below the 200-day moving average.
In addition we can observe the weekly EMA ribbon directly on support:
Occasionally this is a setup, but if price falls below the ema ribbon that is considered very bearish - particularly on a weekly time frame.
Additional Clarity offered on the death cross here:
This death cross indicates, according to technical analysis, that the short term trend (50day) has fallen under the long term trend (200day).
Treasury Yields are indicating the dollar may rise higher, and as those of us who have been observing the increase in the US Dollar see - a bullish DXY is a bearish signal typically for gold.
The 10Y hit its highest level today since Feb of 2020 (which was pre-covid mania)
This is because owning bonds offering a yield is preferable vs a commodity that does not offer yield. The Yield in Treasuries is direct competition with gold - along now with the new powerhouse on the block Bitcoin.
Keep in mind as well that an ounce of gold now costs .03~ bitcoin! Chart will be provided below.
It is also worth stating that Bitcoins market cap is now $975.2B. If we exceed $1.5T Bitcoins market cap will have surpassed silver which one could then assume the next runup will be targeting superseding Golds dominance.
The other issue gold has to contend with is optimism from the broader market that as the nation opens back up, and consumers flush with cash we may see, and hopefully so, a broad economic recovery. The irony, and a strength for gold though is that the formula for inflation is M2*V=inflation. We all know that M2 has gone significantly higher, unprecedently higher. Velocity has been more than muted, it has been crushed. I would argue (and may get some counterpoints shooting me down, and I welcome the debate) that as the nation opens back up, we will see an increase in spending and activity and dare I say traveling and vacationing, home improvements, acquisitions of new homes to take advantage of low rates - which will heat up the economy & increase velocity. If velocity increases enough we could see a nice pop in inflation - not calling for hyper inflation, but even a conservative pop could work wonders for gold.
Keep in mind that retail sales increased 5.3% in January which is indicative that those stimulus checks are indeed being put to work. www.marketwatch.com
Pivot Points for Gold Targets:
There is a lot to weigh out when one considers longing gold, but for now gold appears to be in a position where the gold bears have taken over, and the gold bugs are fighting for support.
If you enjoy this chart please be sure to like it! If you see things differently I respect your opinion and would love to learn from it! Please be sure to comment and tell me why I may be wrong.
And as always friends I wish you nothing but good fortunes and great success!

BRENT CRUDE OIl short setupHy trader
good mood and profitable deals!
Analysis:
3-way deathcross
continuation pattern
Set up:
Short
Trigger breakout, bullback
Wait for the triangle breakout until the 4h candle closes under the pattern, or trade the bullback!
Keep in mind that things can change!
If you like this idea support me with likes and comments!

Tesla is not out of the woods. Death-cross and bear pennant.Tesla is not out of the woods yet. There is still a death-cross and what appears to be a bear pennant on the chart.

Grim outlook. Death cross and reverse cup and handle.50 MA has moved around the 200 MA and now crossed below.


FSLY Death Cross + Break in Support could bring big downsideFSLY is down approximately 50% since January 27th and unfortunately it looks like the bleeding may continue. As you can see from the chart the retest of support is occurring in unison with the occurrence of the moving average death cross. I think there is a good chance support will be broken here in which case I believe we would likely see a further drop in price to $40-$50 level.

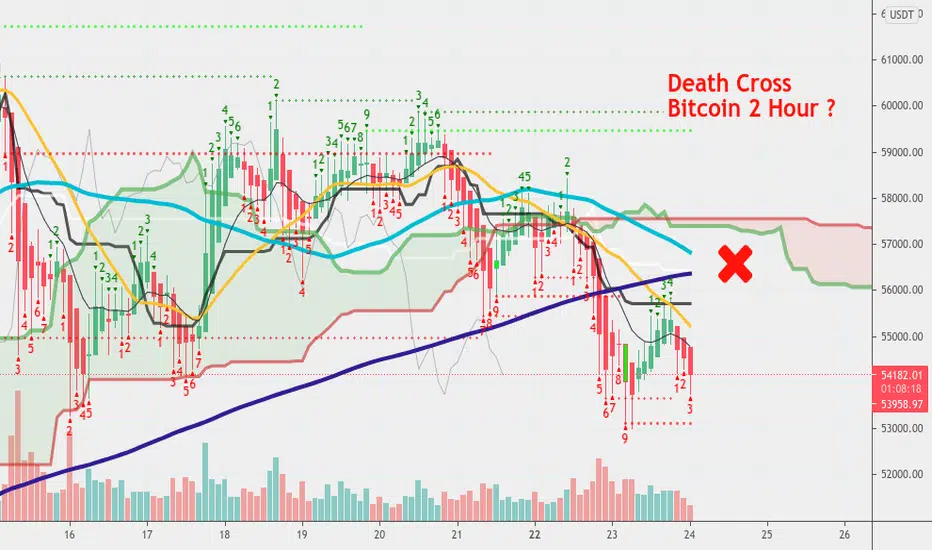
Hoist The Jolly Roger BTC/USDT #Bitcoin $BTC #BTC Here we see our Bitcoin 2 hour chart . Can you see that red X on the chart ? Well, X marks the spot where we may see a Death Cross happening
very soon . A Death Cross is when our light blue 50 MA crosses down and through our dark blue 200 MA . This should bring downward price movement. It's a very bearish event - though keep in mind this is the 2 hour chart . While it's hard to know how low this can go it wouldn't be impossible for Bitcoin to actually go sub 50k here . Please understand we are still long-term bullish for the rest of the year even if we see more pullback on Bitcoin. This will also be great for altcoins which could see a little altseason starting soon.
AMD update: potential path based on technical analysisNo death cross on the daily chart. The stock has significant support at the $73.90 level. Most recent resistance at the $87.10 level.
4H Chart Looking Bearish Short-term but on the verge of a reversal back into bullish sentiment.
We'll see how this plays out with stimulus just being announced with the backdrop of a global semiconductor shortage. It could be choppy, be careful. There could be some chop while the chip shortage is resolved and the tech sell-off finishes, but this should be a good medium-term trade/investment to start building a position in.
Buy under $80.
Price Target $100-115
Stop Loss $70.

The Golden Cross Against The Death CrossThe Golden Cross Against The Death Cross
What is a simple moving average? A simple moving average of the price is a mathematical method by taking the sum of the price in the timeframe you decided to use and then divide that by the total number of the price you decided to use. An exponential moving average of price places more weight on recent price.
What is a Golden Cross? A Golden Cross is when the 50 units moving average crosses above the 200 units moving average.
Predictability of a Golden Cross? Usually Bullish
What is a Death Cross? A Death Cross is when the 50 units moving average crosses below the 200 units moving average.
Predictability of a Death Cross? Usually Bearish
Thank you for reading!
Greenfield
Disclosure: I am not a financial advisor. This is not a recommendation, not a representation, and not a solicitation. You should do your research and come to your own decision. Investment involves significant risks. You need to understand that you may lose your money. Past performance is not an indication of future performance. Chart reading is subjective information.

GOLD Death Cross bears could win this one. my 2nd scenario for gold, i have posted a chart with a bullish outlook as-well.
will be waiting for confirmations before taking any action, Bulls could still pull this back, the MACD is very close to flipping.
let me know your views in the comments!

USDCHF Potential Setup!Patience is the key...
If price break and close below 200EMA, wait for retest then take the trade after 2 bearish candles confirmation. Death cross on 1H timeframe is in formation, wait for it to add confluence to your trade!
Trade wisely :)

$gsx - gap to fill, making its way back to pitchfork medianno real resistance until 99 area.
lets see if the death cross can become a golden gross once again....
on watch this week

Death Cross in Gold Miners as Bitcoin DoublesWe cited the bullish potential in gold prices late last year. This played out as expected, but there hasn’t been any follow-through. Now some bearish patterns are taking hold.
This chart shows the downward trend line in the Market Vectors Gold Miners ETF. Notice how the latest rally tried and failed to push above it.
Next is the rising channel in place since late November as GDX clung to the 200-day simple moving average (SMA). That pattern is starting to look like a bearish flag, with the potential for a breakdown if the late-December lows give way.
Third, notice how the 50-day SMA just slid below the 200-day SMA. That’s a bearish “death cross” pattern.
Even more things are happening off the chart than on it. After all, the U.S. dollar feel steadily in November and December. Gold’s inability to rally with that favorable backdrop is potentially bearish.
Next, the greenback is showing signs of bottoming. If it were to keep bouncing, that could also hurt gold.
Finally, Bitcoin doubled in price between December 15 and January 8 as GDX did nothing. BTC’s relative strength, combined with the drumbeat of institutional adoption, suggests a real sea change is taking place before our eyes. The next few months could be important in the history of money!
TradeStation is a pioneer in the trading industry, providing access to stocks, options, futures and cryptocurrencies. See our Overview for more.

BTCUSD looks like Bitcoin forming a head and shoulders on hourlyare we recovering or is this just halfway into our pullback down to sub $30K bitcoin? also i see a death cross forming with 50/200 emas

GBP/AUD FALLING: DEATH CROSS + CHANNEL BREAKGBP/AUD convincingly broke through its channel, which held strong since early September. Accompanying this break-through, a bearish cross of the MA50 and MA200 (so called death cross) happened a few bars earlier.
Target 1 should be an area where you want to unload some of your positions, in case the price will rebound from the support line. Target 2 could be reached with enough volatility, but dont be sure of it.

EUR/NZD 🇪🇺🇳🇿 to fall and bounce!EUR/NZD 🇪🇺🇳🇿 has formed the broadening Wedge pattern. The price has recently been rejected by the bottom upward trendline , however as the death cross suggesting the price can possible test the area again after which , according to the ROC divergence and stochastic crossover the price is going to rice up to the test of 1.76985 lvl with the possible further growth.
If you like the idea PLEASE don't forget to hit the LIKE 👍👍👍button
Also share your thoughts and charts here in the comment ⌨️ section.

GBP/USD🇬🇧 🇺🇸 to decline!GBP/USD🇬🇧 🇺🇸 has formed the descending triangle. The price has been falling according to the smooth downtrend except the fake out. However , as the Stochastic is in the overbought and about to cross over and the 50&200 ma provided us with the Death Cross the price is going to decline.
If you like the idea PLEASE don't forget to hit the LIKE 👍👍👍button
Also share your thoughts and charts here in the comment ⌨️ section.

Brent 🛢to decline and then bounce!The upcoming Death Cross suggest that the Brent🛢 is going to fall. However as we have strong support levels indicated below and the RSI is lying in the oversold area we shall expect the bounce from one of the levels indicated below.
If you like the idea PLEASE don't forget to hit the LIKE 👍👍👍button
Also share your thoughts and charts here in the comment ⌨️ section.

CHF/JPY 🇨🇭🇯🇵 to fall to the 115.344 with the following spikeTaking the multiframe look at the CHF/JPY 🇨🇭🇯🇵 on the 2H chart we see the Long Upper shadow that suggest that the price can decline down to the Local Support of 115.344 that is also backed by the bearish ( almost Dead Cross) narrowing of 50&200 MAs at the 12 H chart. There the price most likely to bounce from the long lasting Uptrend Line up to the area of 116.166 lvl.
If you like the idea PLEASE don't forget to hit the LIKE 👍👍👍button
Also share your thoughts and charts here in the comment ⌨️ section.

USD/CAD🇺🇸🇨🇦 to fall and test the 1.31011 level.USD/CAD🇺🇸🇨🇦 pulled back from the lost lasting downtrend line and together with the death cross and the swing of the ROC 12 suggest that the price is going to decline and test the 1.31011 level.
If you like the idea PLEASE don't forget to hit the LIKE 👍👍👍button
Also share your thoughts and charts here in the comment ⌨️ section.

Bitcoin approaching a death cross and heading lowerThe 50 (Green) DMA is approaching crossing under the 100 (Blue) DMA. If this goes ahead, this would trigger a strong signal that BTC will be heading lower.
With the RSI also close to the over bought level, this adds another signal/metric for an impending downward trajectory.
The price has also remarkably followed a supporting trendline for over a month. If a death cross gets triggered and the price falls below this trendline, a downward pattern on 3 signals (death cross, over bought RSI, price falling below a supporting level) will have been confirmed.
At this point, it looks as if a downward pattern will be forming soon.

Golden and Death CrossesThe most popular and simplistic way to use moving averages is to divide the market into a bullish or a bearish one based on a cross. Even today, financial newspapers refer to these crosses as being really important and defining for a market. In order to look for a golden or a death cross, a daily timeframe needs to be open on the financial product one is interested in trading. In our case, let’s use the daily chart on the BTC/USD. The next thing to do is to apply two different moving averages on the chart: one that takes into account 100 as a period (MA100), and one that considers 50 as a period (MA50). This means that MA100 is plotting a value based on the values of the last 100 days, while the MA50 one is taking into account only the last 50 days.
The overall idea to interpret a market is quite simple: When the MA50 moves above the MA100, or it makes a cross, this cross is called a golden cross. It means that from that moment on the overall market turned bullish, and so buyers should dominate that market. The opposite is true as well: When the MA50 crosses the MA100 to the downside, the cross that is formed is called a death cross, and signals a bearish environment in the period ahead. The BTC/USD chart below shows both golden and death crosses, as the MA50 (the red line) crosses above or below the MA100 (the white one).
Best regards EXCAVO
