SPX vix results refelected on this chart PAIN & GAINIt might sound crazy, but if history is relevant to today's bull market. Then, we could see a bull market the likes of which no one have seeing in our live times. But,
what about if we do not ???? what about if we get some of the less readings. time will tell the story. CHARTS FOR THOUGHT !
wish you all the best.
Deathcross

Bitcoin reaching 3k if we don't break this levelBitcoin is extremely overbought on rsi, is rejected from MUST BREAK resistance, has high volume, and death cross on MACD. The eth crash coming will take bitcoin with it.
BTC at 7000 soon.
Potential 4hr chart double bottom in play on BTCUSD price action is 1 4hr candle away from 4hr deathcross, but this could easily end up being a deathcross fakeout even if the cross occurs...there is double bottom potential here on the 4hr chart if it can flip this green horizontal neckline to solidified support...the breakout target for the double bottom is pretty close to the target from the 4hour falling wedge pattern from my previous idea as well which makes for good confluence...also we are currently inside a bull flag too on the 4hr which is making upn the right part of the double bottom and also has a similar target once again increasing the confluence and in turn the probability for a bullish breakout. Best to wait and see it confirm first before making a move as well as seeing how price action responds to the initial cross of this 4hr deathcross.

Death Cross Forming $UNI will be testing out the Death Cross pattern with $UN paper trading. History shows that UN usually will go down the day after - 2 days after the pattern is complete, reaches it's low a few days later. The goal is to reach $53, right where it was before it blew up last month from earnings


DEATH CROSS FAKEOUT?Yesterday i was looking for a breakdown on the GBP/JPY. We retraced a bit but couldn’t break the support. Now we are resuming upwards and i am looking to go long. But we first need to break the overhead resistance at 133.8. Keep an eye on it.

GBP/JPY DEATH CROSS!A potential play on GBP/JPY. We can see a death cross being confirmed and the price action getting pulled right into the cross. If we resume down from here i would be expecting price to come back down into the 130.8 ish range. We could see a bounce in that area but i think it is more likely to find a bottom in the 129.4 ish area.


BTCUSD, Winter is coming!The sun is leaving the mountain.
It might take a month as the previous winter.
What's your plan?

0001. Hoggish Play - Short UVXY As the name implies, I prefer to keep Hoggish Plays to myself, since they end up paying most of my living expenses.
But, there is no need to keep this one to myself, so buy Puts for 6/19 at the money or out the money. Either works.
Not going to add much more commentary, since it's a Hoggish Play.
GL
-Hoggish Pig
AMEX:UVXY
TVC:VIX

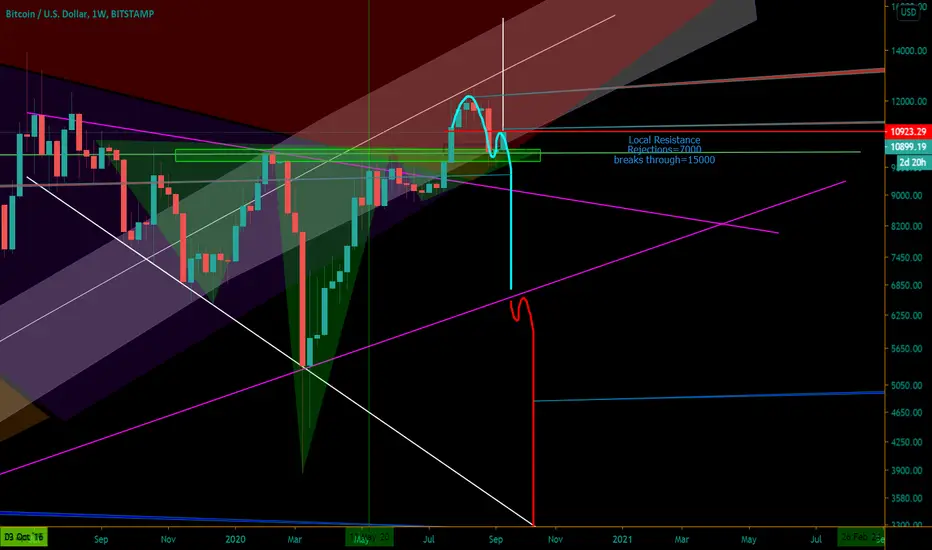
This is my look at Bitcoin VS USD on 05.28.2020I'm not a financial advisor, Don't buy or sell bass on what I'm saying... I do own some Bitcoin and I think it has a great future, this future may or may not be that great so PLEASE DO YOUR OWN HOMEWORK. THIS POST IS JUST FOR INFO ONLY...
This is my look at Bitcoin Vs USD on 05.28.2020
This is an experimental indicator that I have made and testing it out... It is using the EMAs the white line is 13 EMA, the green line is 55 EMA and the yellow line is 89 EMA ...
The points going pass is a future guess by the experimental indicator and the way it works is if it's pointing down like the white one is on this chart, to me, it's suggesting that Bitcoin is going to head higher in the next couple of days and using the RSI and the MACD that should be happening sometime over the weekend or early next week has helped to confirm that for me...
The points going pass is a future guess by the experimental indicator and the way it works is if it's pointing up like the white one is on this chart, to me, it's suggesting that Bitcoin is going to head down in the next couple of hours and using the RSI did have a couple of death crosses over the last day or so and the MACD looks like it will have a death crosses any time now!
What do you think about this, a good idea or a bad idea?

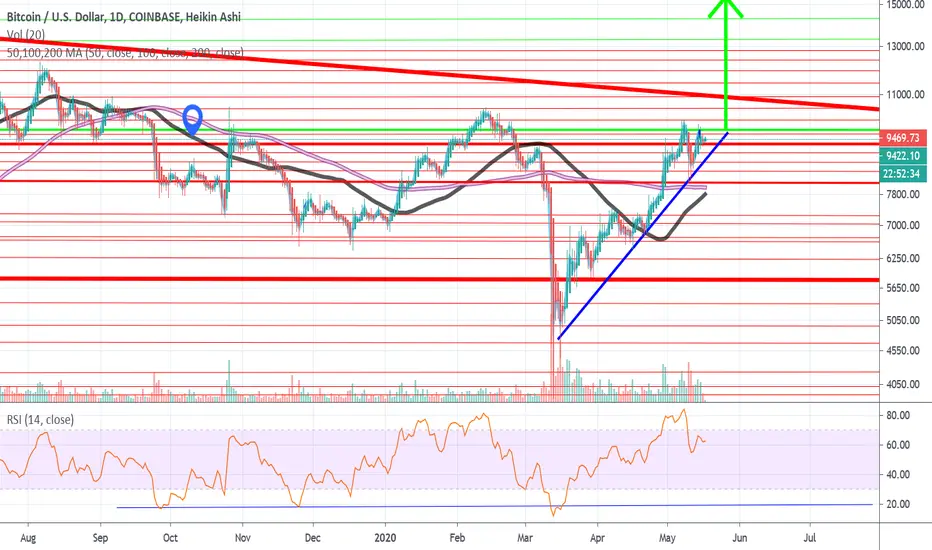
Ascending Triangle breakout for Bitcoin?Inside of the ascending triangle on a micro scale Bitcoin is forming a cup & handle, there is merit potentially for a inverted H&S as well.
The RSI is displaying a inverse H&S, interesting because the moving averages are about to converge
Only time will tell, but a golden cross followed by an immediate death cross seems like a future occurrence.
75% oil drop start?He spoke in the previous neutral forecast about the likelihood of a second fall of 2012-2014, apparently it started much earlier than planned and the death cross is getting closer

oil will fall, it's a matter of timeHello everyone, so on my chart, you can now see a repeat of the price movement, namely starting from 2012 (as indicated on the chart) and a possible intersection of the two-day moving average or, as usual, the appearance of the death cross

Bitcoin Analysis UpdateThis is an Update for:
After breaking the $ 7400 , now BTC entered a range between the two ($ 7800 ~$ 8000 and $ 7400 ) Support and Resistance. ( 61.8 Fibo on $ 8000 )
The second test of $ 8000 is probable. BUT the 2D Death Cross is confirmed a long time ago and now the Price action tested the 2D EMA200 . I entered a short position based on 2D EMA200 .
As long as Bitcoin is below that moving average, I'm bearish and covering my short positions.

Bitcoin's Range MovementPlease leave a LIKE and COMMENT if you like the analysis.
Yesterday's decrease caused the price to fall back within the $7150 - $6650 trading range. While it initially found some support above the midpoint of the range, it fell below afterwards. The bearishness is strengthened by the possible bearish cross between the 50- and 200-period moving averages (MA), otherwise known as a death cross.
An almost identical movement occurred on April 11. The price had increased above the resistance of the range, only to fall back inside it shortly afterwards. After the death cross occurred, the price moved upwards all the way to the resistance line, only to drop sharply afterward.
If the same movement transpired this time around, the BTC price would increase and touch the resistance line only to fall towards support afterward.

Bitcoin 2D Golden/Death CrossesBitcoin 2D (Golden/Death) Crosses case study shows that after these crosses, price action will test one or more EMAs to confirm the cross and Bots & Algos.
Will it happen again this time?
With every 2D Candle close, the momentum between EMA200 and EMA55 becomes stronger to the downside.
Meanwhile, Bitcoin could test the 2 EMAs but the change of behavior is when a candle closes above EMA200.
So as long as BTC is below EMA21, I am Bearish. but if a candle closes above EMA200 ( fake the death cross ) - based on PriceAction - I become Neutral or Bullish.

AUDJPY potential shortWaiting for the break of support. Also 50SMA breaking below 200SMA for a death cross.
Target 1 around 66.2 area.
Please support the idea and share your thoughts on AUDJPY!
Good Luck and Stay Healthy

Adobe Deathcross DailyThere seems to be some discrepency regarding the nature of the rising broadening wedge, with some thinking its bullish while others bearish. I believe it is bearish, following Bulkowski's chart pattern rules. Short should be placed just under or above 200DMA if deathcross follows through. For a rising broadening wedge to be valid three or more touches must be evident at resistance and support lines.

RSI "DEATH CROSS" & "GOLDEN CROSS" during Pandemic VolatilityJust a quick idea that shows how, as the Covid-19 crisis worsened, the RSI "Death Cross" clearly indicated the huge drop off in price that was about to occur.
Conversely, despite record unemployment claims in the US, when the RSI "Golden Cross" recently occurred, the price was able to break through previous resistance.

Death CrossThe death cross occurs when the short term average trends down and crosses the long-term average, basically going in the opposite direction of the golden cross, and is understood to signal a decisive downturn in a market.
Here we can see how the death cross triggered a year-long bear market.

Ascending Triangle or Head & Shoulders?On the RSI there's a H&S patter so visible if I need to draw it I'm not sure you're familiar with a Head & Shoulders pattern.
What Is A Head And Shoulders Pattern?
A head and shoulders pattern is a chart formation that resembles a baseline with three peaks, the outside two are close in height and the middle is highest. In technical analysis, a head and shoulders pattern describes a specific chart formation that predicts a bullish-to-bearish trend reversal. The head and shoulders pattern is believed to be one of the most reliable trend reversal patterns. It is one of several top patterns that signal, with varying degrees of accuracy, that an upward trend is nearing its end.
Key Takeaways
A head and shoulders pattern is a chart formation that resembles a baseline with three peaks, the outside two are close in height and the middle is highest.
A head and shoulders pattern describes a specific chart formation that predicts a bullish-to-bearish trend reversal.
The head and shoulders pattern is believed to be one of the most reliable trend reversal patterns.
What Does The Death Cross Tell You?
The death cross occurs when a short-term moving average (typically 50-day SMA ) crosses over a major long-term moving average (typically 200-day SMA ) to the downside and is interpreted by analysts and traders as signaling a definitive bear turn in a market.
The opposite of the death cross occurs with the appearance of the golden cross, when the short-term moving average of a stock or index moves above the long-term moving average. Many investors view this pattern as a bullish indicator. The golden cross pattern typically shows up after a prolonged downtrend has run out of momentum. As is true with the death cross, investors should confirm the trend reversal after several days or weeks of price movement in the new direction. Much of the process of investing by following patterns is self-fulfilling behavior, as trading volumes increase with the attention of more investors who are driven in part by an increase in financial news stories abut a particular stock or the movement of an index.
Limitations Of Using The Death Cross
All indicators are “lagging,” and no indicator can truly predict the future. Once & while a death cross can produce a false signal, and a trader placing a short at that time would be in some near-term trouble. Despite its apparent predictive power in forecasting prior large bear markets, death crosses also do regularly produce false signals. Therefore, a death cross should always be confirmed with other signals and indicators before putting on a trade.

Weak signals on GBPUSDWe have recently seen a massive dip in GBPUSD price, followed by a big increase in price, making GBPUSD very volatile, what I would expect after this big increase in price is a slight pullback to the next important support level .
I'd keep an eye out as this is quite the good short in my view, as we clearly have weakening volume and candles, and I would expect people to start closing their longs soon. A death cross will help confirm this.
Feel free to leave feedback and if you have any questions don't hesitate to contact me through discord or telegram linked in my signature.
Here's a longer term view of my resistances/support
cheers,
tonite
