The Difference Between A Death Cross And A Golden Cross?What Does The Death Cross Tell You?
The death cross occurs when a short-term moving average (typically 50-day SMA) crosses over a major long-term moving average (typically 200-day SMA) to the downside and is interpreted by analysts and traders as signaling a definitive bear turn in a market.
The opposite of the death cross occurs with the appearance of the golden cross, when the short-term moving average of a stock or index moves above the long-term moving average. Many investors view this pattern as a bullish indicator. The golden cross pattern typically shows up after a prolonged downtrend has run out of momentum. As is true with the death cross, investors should confirm the trend reversal after several days or weeks of price movement in the new direction. Much of the process of investing by following patterns is self-fulfilling behavior, as trading volumes increase with the attention of more investors who are driven in part by an increase in financial news stories abut a particular stock or the movement of an index.
Limitations Of Using The Death Cross
All indicators are “lagging,” and no indicator can truly predict the future. Once & while a death cross can produce a false signal, and a trader placing a short at that time would be in some near-term trouble. Despite its apparent predictive power in forecasting prior large bear markets, death crosses also do regularly produce false signals. Therefore, a death cross should always be confirmed with other signals and indicators before putting on a trade.
Deathcross
SO close! 100/50MA (2 Day) IN COMING!Historically, these crosses have a 100% success rate.
8 year cycle -Venus.
2012, very similar set prior to entering a year long bull market that gained over %5258%.

SPY - Short ConfluenceA lot of confluence occurred towards the end of the day. SPY broke the 14 EMA, the 50 EMA, the trend line and has rejected a previous support 3x on the 15m chart.

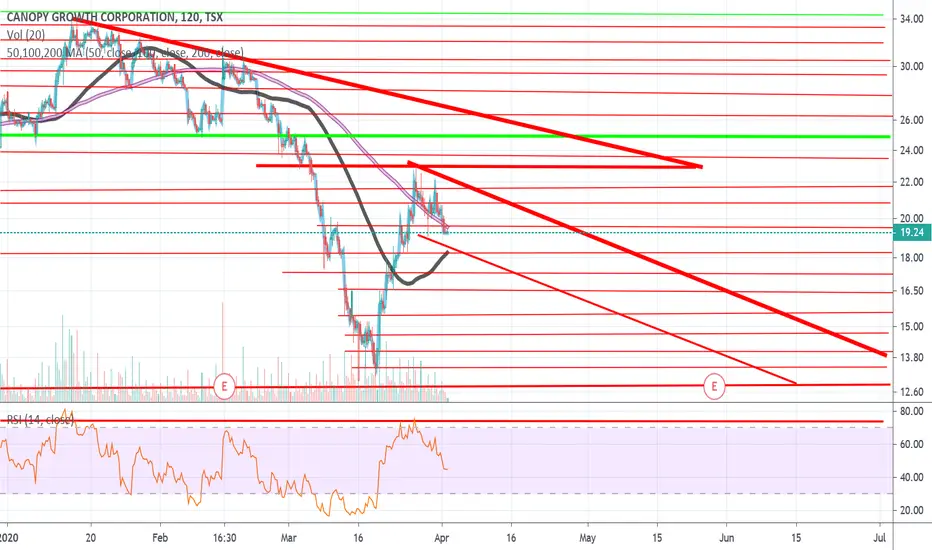
Sequential Bottom. Death cross-50,200 day MA. Retest Imminent What most people are overlooking is the 2011 market decline. I think we're going to see a sequential bottom with an undercut of the prior low. It happened in 1974 in which there was an Oct. low with a subsequent Dec. low. It happened in 1980 with the bunker hunt decline, in 2001, in 2008-9. Point is we historically have had secondary tests.
This death cross of the short term MA crossing through the 200 is signaling an imminent retest. So, it would make sense for the sell-off to occur this week because I think we're yet to see major equity selling during this Quarter-end pension fund rebalancing.

Moving average death crossAs you see , the 50 Days MA showed by Gold color , crossed downward 100D MA and 200 D MA , this shows that you must close as soon as possible the longs on BTC
This is cation that we must not ignore and act as what we see , not what we want to happen.

Death Cross Pump Dump Triple Flip 360 No ScopeBTCUSD seems to play out with what we expected only half the time, in regards to crosses. At the moment im a bit bullish considering recent price action and mostly scalping. Anyone care to let me know what they think the death cross will bring? Comment below if you do. Happy Trading!

quick "death cross" analysis: predicting the bottomWe are about to "death cross" on the 200/50 daily.
Consider that previous "death cross" was never as severe, lasted from 4 and 9 months respectively.
The parabolic downtrend line is about to break, so we might see higher prices in the next 24 hours, before diving down again.
We should fully expect a drawn out "death cross" down trend to last 2-3 quarters at least, before climbing just before elections up to keep trump in office. (he probably doesnt need the help....biden is terrible)
we might see a pull back to 2600 and 2800, before falling to 2000 before ranging, where smart money will likely let us accumulate, followed by a bull trap, before dumping the market to wash out weak hands by testing the 2K low. Once the stop hunt is complete, smart money will move markets back up again.
Going long now could get you stopped out early by another weak stop hunt to 2100 might hit in 5-7 days. Target price of 2500/2600 is good, but high volatility means we position sizing and risk management is more important than ever. better to use ES as a hedge IMO.

Dow Jones Industrial Death Cross Imminent The last time we had a death cross was December 2018. The previous death cross before that was January 2016. Go back in time and look at the charts. Both times the DJI dropped for approximately 5 more days and then started going back up. I expect the same thing to happen after this death cross.


More WorseDeath cross on daily. Target can be 3600-3150. To regain bullish territory btc should close daily candle above $5900 and hold.

GBPJPY DOWNSIDE - DAILY TIMEFRAMEWe have downside looking nice and clear for GBPJPY after the price fell clearly below the SMA's recently. Looking at the monthly fibonacci levels, it looks good to drop until potential TP zones.

CHFJPY DOWNSIDE - DAILY TIMEFRAME Right then after a very volatile period due to coronavirus, it is time to move on as best as possible with unaffected pairs. Currently we have found a sell off available for CHFJPY, which does not seem to have the volatility issues presented currently through other main currency pairs.
A death cross is looking due on the daily charts, towards the fibonacci level shown which has been analysed on a monthly candle time frame to engulf the entire historical movement of the price.


ETHEREUM LOOKING BULLISH AGAIN!!Hey there,
please support this idea with your likes and follow me on TV if you don't want to miss out!
Take a close look at this chart and what is written on it.
Ethereum is currently being rejected my the 1004h MA and price is now being squeezed
between the 100 and 2004h MA. We are going to have a deathcross of the 2 moving averages
shortly, so we will see if this is going to have an impact on price.
Since the 2004h is ascending and only the 100 is declining, I wouldn't put too much emphasis on this signal.
250 seems to provide strong resistance with multiple factors in play, such as Setup-trendline of the
TI Indicator, 0.5 fib, structural support in the past, and psychological round number.
For now we have a big hurdle to get over with price now sitting at key structural resistance from the
consolidation at the top.
Luckily for Ethereums price, we are now forming a 4h bullflag and if this day closes around the current vacinity
then this could send ETH into 250USD.
Ok so as I am writing this we are breaking over the bull flags resistance, so now the 1004h is the next hurdle, which
we are now sitting on.
Exciting times and many trading opportunities currently, take your chances and play wisely!
Thanks and cheers,
Konrad

S&P 500 Death Cross possible soon.The 50 moving average is beginning to turn downwards towards to 200 moving average. This is not a nice scenario.

LTCBTC at a key fulcrum point.ltcbtc at a key fulcrum point. Needs to maintain support on the one day 200ma to trigger the falling wedge breakout and maintain the golden cross...if it loses 1day 200ma support then it will likely trigger the double top breakdown which could send it into a deathcross. If it did flip back to deathcross, that deathcross could still be more of a deathcross fakeout as long as prive action were to have a huge rebound after the breakdown. So even if the double top were to occur that doesn't necessarily mean a sustained deathcross is a guarantee we could still just have a deathcross fakeout and flip right back into a golden cross shortly there after.

BTCUSDT 4H DOUBLE DEATH CROSS LONG TRADE STRATEGYThe double death cross strategy employs one more moving average that will help you anticipate when the death cross signal will occur. The third moving average is the 100-day MA, which is a medium-term MA situated between the other two moving averages.
Step #1: Wait for the 50-day EMA to cross below the 100-day EMA. The two moving averages also need to converge with the price action. You can read more about day trading price action here.
If we get the crossover of the 50-day MA (blue line) and 100-day MA (orange line) at the same time the price is testing those moving averages like it’s doing on the GBP/USD chart below, that’s the best-case situation for trade because we can define the risk.
The rule you need to keep in mind is that when the MAs converge with the price you have to get ready for the ride because it is going to get BUMPY!
Step #2: Multiple entry strategy: Sell1 when we close below 50-day MA and 100-day MA. Sell2 when we break and close below 200-day MA.
Using multiple entries to improve your average entry price can be the best way to approach the death cross signal. Scaling into a position is our preferred trading method when looking to capture a large price move in a currency pair.
The fact that the price was near the death cross signal, it created tension in the market that eventually will lead to a sharp move to the downside.
We pull the trigger on the first half of the trade once we close below the 50-day and 100-day moving averages.
If at the moment when the death cross developed we’re already trading slightly below the two moving averages, sell at the market the moment we close below.
The second half of our position is entered once we break and close below the 200-day moving average.
**Note: It’s important to remember that the success of the death cross signal relays on this simple trade secret that price and the two moving averages need to converge.
Keep it 'simple stupid' is not just a simple aphorism, but it’s an old truth that can make the difference between losing and making money trading.
Step #3: Hide your protective Stop Loss above 50-day MA and 100-day MA
The most important thing we need to define when trading is our risk. If you want to be a profitable trader you really need a limited risk. This is the type of death cross trades that we want to pull the trigger on.
If the price were to move back above those moving averages, we can safely assume this is yet another false trade signal. In this trade case scenario, we’re risking a little and our reward is potentially much bigger.
So, the best place to hide your protective stop loss is above the 50-day MA and 100-day MA.
Step #4: Choose your own Take Profit strategy or use this Two-step process for the take profit strategy: Mark on your chart the high of the candle when the 50-day MA crossed below 200-day EMA. Take profit when this high is broken.
Our take profit strategy might seem a little bit complex, but once we break down the steps you need to follow, it will make more sense why we’ve chosen this approach.
The first thing you have to do is to remember what we said at the beginning of the article which is that when the price doesn’t converge with the two MAs this is a death cross false signal.
In the example below, we can observe this type of price action.
Now all you have to do is to mark the high of the candle when the death cross happened and take profit as soon as the high gets broken.
**Note: The above was an example of a SELL trade using the death cross strategy. Use the same rules for a BUY trade – but in reverse, in which case we have the golden cross trading strategy.
Conclusion - Death Cross Stocks
Following the death cross trade signal can be a very efficient approach to identify bearish sentiment in the market. If you want to switch from short-term trading and try capturing larger trends the double death cross trading strategy can help you achieve your goals.
You must know that the death cross definition is universally applicable to any other asset classes. We can have a death cross crypto or a death cross gold the same way we can have a death cross S&P 500. Capturing and detecting bearish trends can be a hard task because downtrends are typically different than bullish trends. However, the double death cross strategy gives you a systematic way to tackle bearish trends.


Looming death cross for Bitcoin Dominance?We could see a death cross as the 200 daily moving averages approaches the 50 daily moving average.
However, the MACD suggests that we could see a bullish crossover so maybe bitcoin dominance will bounce off of the 50 daily moving average. Either way, I see something significant happening soon.
Thanks

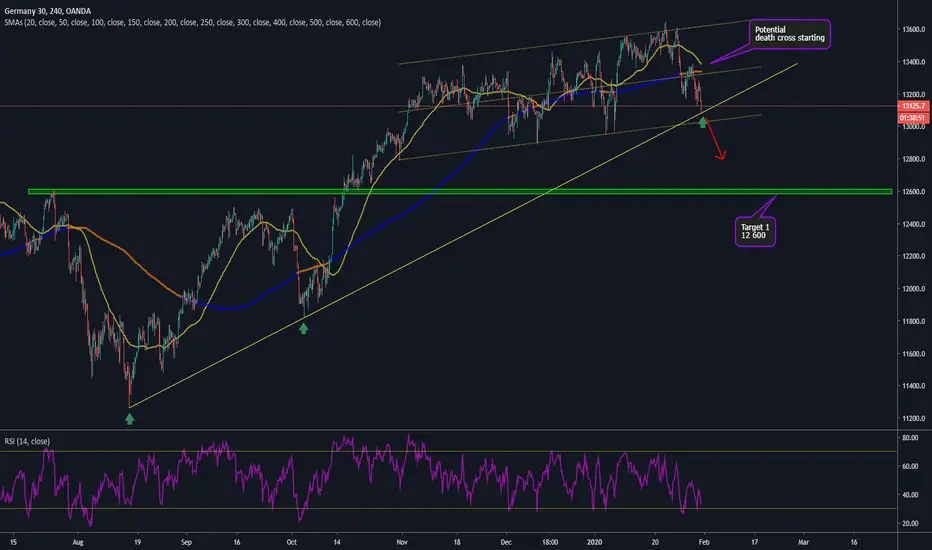
DAX shortAs the virus outbreak continues to slow growth, Dax confirmed the 3rd touch on the trend line. Also potential death cross as 50 SMA could cross below 200 SMA.
Chinese economy expected to be 2/3 shut down next week as the country battles the outbreak.
Overall, market sell off expected to continue.
Good Luck and stay healthy!
Golden Cross, Death Cross, and Halving - Time ComparisonsUsing a 50/200 MA I've laid out time frames between the various occurrences of golden crosses, death crosses, and halvings.
Wanted to share with the community and see what theories any of you may have from seeing this and if you're noticing any patterns.

Death Cross pattern MA100/MA50. This pattern is pretty accurate.
Every time we se a death cross between MA100 and MA50, we drop aprox -29%.
Right now, there is high probability for a new death cross.

BTC Searching for SupportBTC had an infamous death cross back in mid November (red ellipse) and has struggled to keep the 200 day EMA above the 50 day EMA ever since. Recently however the market has been making effort to do just that.
There has been quite a bit of volume recently suggesting seller exhaustion may be around the corner. The price is forming a strong upwards channel in which is steadily collecting confirmation points along the lower support line. It is still finding resistance with the upper bound but greater volume could possibly break it through.
Back in late October, the 50 and 200 EMA lines almost made a death cross but instead the market rallied and within 2 days went from $7490 to $10,480. Unsustainable at the time the price slide from there to a lower low of around $6620, a natural market correction happening over 1.5 months.
Now the market seems to be on the verge of a re-crossing of the EMA's back to a bullish trend . It will take around another week fr this switch to be confirmed and in that time BTC needs to steadily gain sup [port at the price level it is at.
The gold line directly connects with the support level of the current channel. This forms a natural Thomas Denmark ( TD ) bullish trend . That is, the price was being consolidated within that triangle and the market had 3 times where it hit the lower bound, which is a bullish trend line , and it could have slid out of the channel but instead bounced to a higher high, within four candles. For more on TD indicators please read this article: forextraininggroup.com
There are many bullish signals for BTC in the news recently such as the famous hash ribbons turning buy, www.newsbtc.com which makes this a precarious time for BTC because the bullish trend wont be con rimed until we have a healthy market rally to ~10k that isn't within a 48 hour window, with sustainable volume .
