Deathcross

BTC | DeathCross 1D The previous Death Cross in 1 day, the price dropped by about 2500$, will history repeat itself?
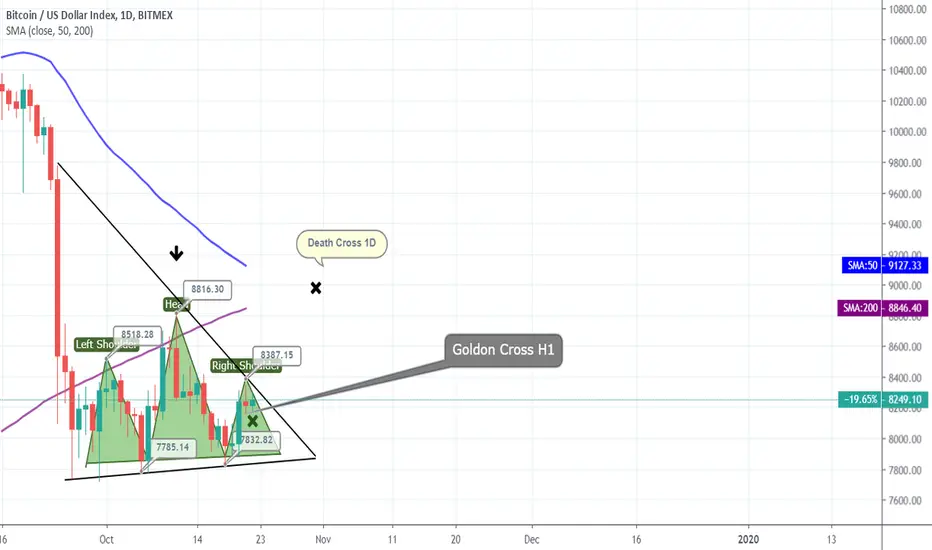
BTC | Bounceology (Pt.2)As mentioned in a idea published back on September 3rd where I highlighted (Figure 2) BTC's price action being supported by the .382 fib level drawn from the weekly top of Dec.2017 to the low of last year. That .382 level of around 9430 was touched 4 times during the months of July to August before breaking down on September 24.
Now in Figure 1, we can see the current trading range in the past month being supported by the 7800 level. And this level has been touched 4 different times as well. If we use what happened in Figure 2 to the current price action, we can expect in 25 days for BTC to breakdown again through this support. A strong indicator for this to happen is the looming death cross approaching.
Let me know what you think.

Sign for long term bearish market?I want you guys to notice something very important as-well...
What we see here are averages of E200 and E50, both going downwards, while E50 is crushing towards a death cross, now this cross is special, because not only it will confirm bigger TF averages are coming for impact, but also they are going downwards, if 1 of them would have went upwards instead then it would weaken the death cross, but if both going downwards an if both will cross? then Bitcoin is going to stay bearish for many more months before we can see new signs for the next bullish phase...

Death Cross 1D XBT | Bitmex | Short the CornDeath Cross Coming in 1D, crossing MA 50 & 200, I think we'll go down quickly ::)

Bitcoin - The bottom is in or is 4k it?Well... BTC wants us to believe that the bottom is in. We have touched the $7800 area plenty of times and it has refused to go lower -- which makes it look like a bottom. If this is it then the bottom is being built in the middle of nowhere which is out of the norm. There are a couple of places where it would make more sense to bottom out so I recommend we wait till we get there ($6500 - $7000). Also, there is no massive green candle avoiding the impending death cross so far, and the downtrend looks like it has too much momentum to be stoped. Your best bet is to wait and see how the 50/200MA crossover is going to affect price(but we know the answer to this already.) Once we see clarity we'll put our capital to work again.
Don't forget to follow me to stay one step ahead of the chaos.
Let's read what BTC is trying to tell us in this chart. The 200MA has rejected price many times in the last 3 weeks, this tells us that there is no strength to go up. Also, support is getting heavy, every rejection sends BTC down back to support and those candles are piling up quickly, support may not hold any longer. Every time you lose the 200MA on the 12H timeframe you take that as a hint that things have gone south for the corresponding asset, that happened to BTC a few weeks back and now we are seeing it on the 1D timeframe. Once the 50MA crosses down the 200MA it will seal the deal and we will see the price drop for a while. In the days after, BTC will range and spike up and range again while on its way down. Right now let's be out with cash in hand waiting for BTC to hit the $6500 - $7000 area so we can get some more cheap alts. As of today, 4k is not in play but it could be depending on how aggressive the death cross is.
NOW, THE LEGEND;
Support trendlines are green
Resistance trendlines are Red
Horizontal support lines are white, the thicker the stronger the support
50 Moving Average is yellow
200 Moving Average is white
THE TREND: Still going down but near the bottom
THE OUTLOOK: Almost safe to buy BTC but let's wait just a little more.

Bitcoin daily outlook 10-18-19Okay everyone it has been no secret that I have been bearish over the last few weeks. I know it is bothersome to some of my perma bull friends that want to see a sea of green once more. But the thing is Bitcoin and trading do not care about your feelings. We need to look at the data on the chart and keep the decision making free from emotions. Just based on the 50 MA (orange line) and 200 MA (blue line) things are looking more bearish by the hour. The 50 MA (orange line) is creeping closer and closer to the 200 MA (blue line) and when the 50 MA (orange line) crosses below the 200 MA (blue line) it is bearish. Especially on the daily time frame. Of course a death cross has a chance to be a big nothing and may not cause the dip Im expecting but its better to know whats in front of you so you can prepare for anything. This is Bitcoin after all. The last time the 50 MA and 200 MA crossed it was bullish (due to the fact the 50 MA crossed above the 200 MA) This is widely known as a "Golden cross" and look at the data. The price rose before the actual event. I believe sometimes traders go ahead and make a move prematurely when they see something like this. Which is why we saw the price rise slightly before the actual cross. But after the cross is where the real fireworks happened. We went from 5100 - 14k within 2 months (approximately) Now we are looking at the opposite scenario. The orange line is crossing below the blue line.. It could cross in a week or a month. Or if a miracle happens and the candles climb we could avoid it all together. But realistically I think we should all prepare for the worst and hope for the best. Where will this death cross take us? My target short term for the next drop I think we have in store is 6500 - 6800. The 50 MA on the weekly is at 6800 and the top of the cloud is at 6500. Just my 2 sats... But WTFDIK right? Go Astros

BTC | Extended Boring Price ActionAs I have mentioned earlier this month, BTC price action is consolidating into a more narrower and tighter range hoping to see a breakout/breakdown in the near term. As we continue to wait for either or, prices continue to consolidate putting traders and enthusiasts to sleep. I agree, it's been pretty bleak for the past few weeks.
What we do see is that the .382 support level has not been breached yet but what is alarming to see is the 21 SMA breaking the 100 SMA on the daily last week. The last time this happened was back on August 14, 2018, which then lasted for 6 months.
Will we see this occurring again? If so, should we expect a bear market for another 6 months?
Let me know your thoughts.


BTC | INITIATE SHORT ON THE HOURLYInitiating Short.
Reasons:
1.1H 50 & 100 SMA death crossing the 200
2.Lack of a bull case scenario
3.Since June, the last 8 times this has happened has resulted in actual price drops. No fakes.
Will keep you all updated.


RUSSELL 2000 (RUT) BEARISH SIGNAL SMAsThis index just trigered a triple death cross signal (10 SMA under 50 SMA under 200 SMA). The triple cross has happened at the same time (very unusual).
Wait and see with a bearish bias until proven wrong. To be noted that the Russell 2000 index usually warns ahead of troubles in the big cap indexes.


Can we avoid a bear market death cross?Definitions of a bear market vary, but there are three truly fundamental ways to define it:
Are we below the weekly 21 EMA = YES.
Are we below the daily 200 MA = YES.
Is the daily 50 MA below the 200 MA = almost.
Despite its sensational name, a death cross (and indeed a golden cross) are incredibly reliable indicators of the approaching market trend. We last enjoyed a golden cross on 23rd April, just days before the 177% pump we then experienced throughout May and June.
However , with BTC now held firmly by 200 MA resistance, we have an incoming death cross due to occur on or around 21st October. If this happens it massively increases the likelihood that we are back in a confirmed bear market and heading down to retest the range between $4000 and $6000.
Do you believe we can avoid a death cross? And will it confirm that we are indeed in a bear market?
Please give me a thumbs up and follow me if you found my analysis interesting. This is for educational purposes only and not a recommendation to buy or sell.


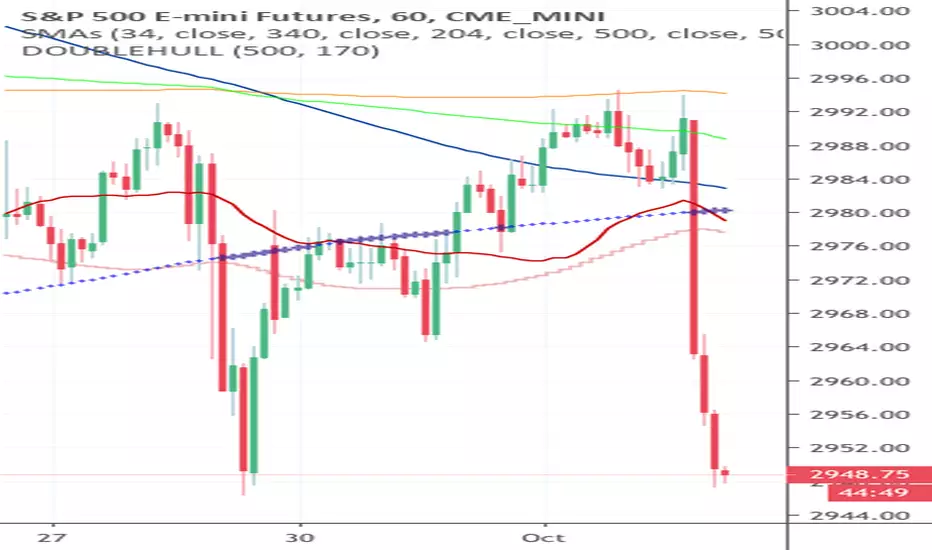
ES1! : 34SMAx500SMA DeathCross : May 7th, August 1st, Sept 30thES1! : 34SMAx500SMA DeathCross : May 7th, August 1st, Sept 30th


Long Term BTC trend analysis Hello everyone, my name is CombJelliesAreCool, lets get to brass tacks.
Lets start off with the red and green curves i have surrounding the entirety of the price action for BTC, i started off with the first high and low back in Oct 2010 and connected the green curve with every subsequent rally high and connected my red curve with every subsequent rally low. Doing this, its clear to see that touching either of these curves is a trustworthy indicator for the end or beginning of a sustained uptrend. Due to the inherent volatility of the bitcoin market, its entirely possible for a downtrend to occur inside of an uptrend of vice versa. However, if your uptrend doesn't touch the green curve or the downtrend doesn't touch the red curve then the trend has not completed. This indicator has played out without fail for almost 10 years now and can be seen in action with the rallies of 2011 and 2013 and the down trends of 2014 through early 2015 and i posit for the downtrend of 2018 through the rest of 2019.
On this indicator i took my inspiration from @MagicPoopCannon but I came to a different conclusion on the shape of the curves, he posits that as time goes on the price of bitcoin will eventually stabilize, although I agree with him that price action will eventually stabilize as the market gets saturated, I highly doubt stability is coming anywhere in the near future with the increasing adoption and exponential amounts more money that's coming into the market so my bands increase in width as time goes on as opposed to decreases.
Lets move on to the SMA cross, it looks like there's an impending deathcross on the horizon coming to confirm this downtrend we've been in for two months, with this harsh of a downtrend in the past week I assume its coming sooner than later, especially looking at the shape of the 50 SMA up close.
Now for the NVT analysis, I noticed that the shape of the nvt during late 2012 through mid way 2014 has a lot of confluence with the NVT of mid 2017 through now. I first noticed that a new end of the downtrend wasnt confirmed until the NVT for a green oversold signal, one that we didnt have, even during out catastrophic drop in Nov 2018. If you look at the red lines you can see that the shapes of the NVT are basically symmetrical. You see a gradual rise into a steep rise followed by a monster of a dropoff, boom, green oversold signal, a gradual rise and plateau followed by yet another steep rise and another, albeit ever so slightly less of a dropoff than the previous, this takes us into the mid 70s of the NVT, we plateua, chop for a couple months than a decent uptrend and a very gradual drop off of the third red peak of the NVT, and finally our second green on the NVT since out first red peak and a touch of the red curve to signify the end of the downtrend. A majority of this trend is confirmed including the steepness of the angles and the timing of the plateaus in the trend. I would assume this would indeed be the case if we had good NVT data for our very first bull and bear cycle.
If this fractal plays proportionally our eventual low will likely be the high 2000s or low 3000s and our rally high in 2023 will be around 250000 - 300000 dollars per BTC. Shes going down boys.
Thank you for reading, Im open to ideas and criticisms.

Feather in my cap: my deathcross worked swimmingly!!!Btcusd collapsed after daily 34 sma x 500 Hull MA
1 John 4:10

brschultz death cross dude WoW!!! It Works!!! 34 SMA x 500 Hullbrschultz death cross dude WoW!!! It Works!!! 34 SMA x 500 Hull

4h BTCBack from an intensive week away due to work issues.
The snap shot we were left of 50 EMA ( Yellow) getting a 4H death cross with the 200 EMA (Blue) is still intact and actually consolidating the bearish picture, though there was a small attempt to cross back. Usually the price tend to attract back to the EMA's when they are father-away just to drop back again.
My position is still bearish, thought there is the 4H-daily and now the weekly triangle in the play, which is nested in the bear channel started in the topping of June. The bottom area of the triangle can give us a bounce up with the current slow grinding bearish aspect. The 4H TD had a 9 BUY, which was ignored and now is in a RED 3 count.
Keep open the eyes and safe trading folks.

You can see just how impressive/important the 34x500hull is! A.IYou can see just how impressive/important the 34x500hull is!!!
