Bohus Pollak view on Apple Death Cross on 1D chartThe death cross occured on 50 MA and 200 MA
Disclaimer: Bohus Pollak is not a financial advisor, nor do any of our employees, executives, or affiliates hold such certifications. None of the content on this website or any other Bohus Pollak media pages on internet constitutes as financial advice. Essentially, Bohus Pollak attempt to take the pain out of researching your favorite cryptocurrencies by providing data, analysis, and fundamental information all in one place. All of this information is Bohus Pollak own subjective opinion and nothing should be taken as financial advice. All Individuals are responsible for their own research and due diligence before making any investments. Cryptocurrencies, Forex, binary options are volatile and Highly speculative, an investor, trader, speculator, or any type of buyer of cryptocurrencies or investments has a risk of loss. Bohus Pollak holds no responsibility for losses incurred by cryptocurrency and investment purchasers. All of the content on Bohus Pollak ideas and posts and content distributed by any media is his own subjective opinion and is not in any way financial advice.
Deathcross

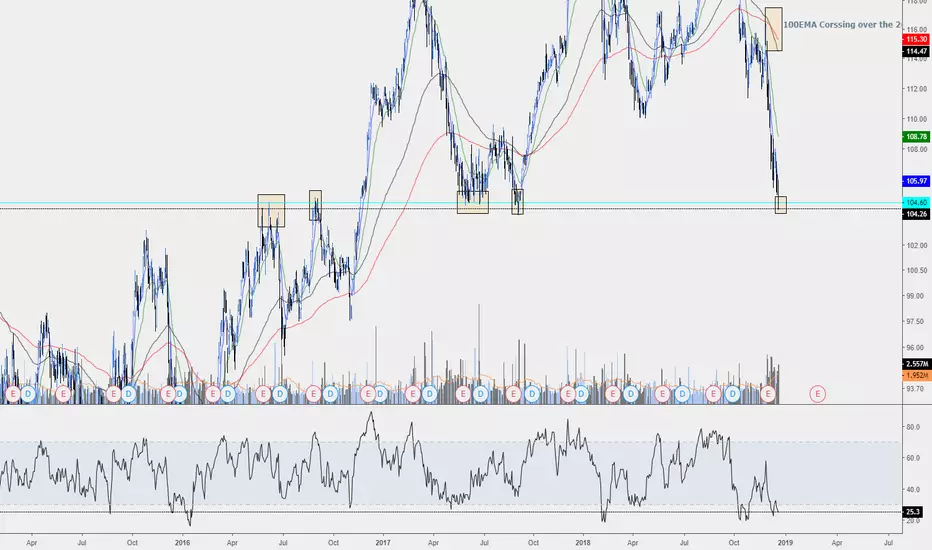
CIBC Hitting Major Daily S/R LevelTaking a look at the daily chart CIBC TSX:CM to see that it could be at a very decisive point around the $104 area. Price hit a major horizontal that acted as a strong resistance turned strong support with price hitting that level on multiple occasions with subsequently massive price movement to follow.
* If price breaks this S/R level with conviction I will look to enter on a pullback to the S/R level
* If price bounces off this level this week I would cautiously enter a long position with a stop just below the S/R level
Considering the current market conditions and with this being the third retest of the S/R Level coupled with the 100EMA/200EMA bearish cross I'm inclined to favour the bearish scenario over the bullish in this case.
Trade Wisely,
Chloster
S&P 500: Panic breaks outThis is a short one. It appears that the SPX spooked itself last night! Well, to be fair it was probably news of the death cross which caught some investors, that was related to some price action.
Markets - at their tips - are ruled by hope, fear and greed. Watch this space. No predictions - as usual. :)

EGY Death Cross Imminent EGY will form a death cross either later in the trading session today or early tomorrow. Set a stop loss at 1.59 and rebuy on the rebound at 1.55. There's a huge potential floor beneath this. Long in the mid term, short in the short term.

Big Short!A lot of alts a showing good signs at the moment but sad to say $BNB is not one of them.
-Prior Bearis Divergence
-Bearish Fan Pattern
-Bearish complex head and shoulders
-Death Cross
- 50% discount
Stay Safe Amigos!

DEATH CROSS ON SP500 Imminent!By the end of the current week we will have a Death Cross on the S & P 500. This is very bad news for the US Economy!

S&P 500 TopI believe that it is possible to beat the market through a consistent and unemotional approach. This is primarily achieved through preparing instead of reacting. Click here to learn more about how I use the indicators below and Click here to get my complete trading strategy! Please be advised that I swing trade and will often hold onto a position for > 1 month. What you do with your $ is your business, what I do with my $ is my business.
I am calling a top in the S&P 500 and the charts pretty much speak for themselves. What is most important to me is the death cross with the 50 & 200 day MA’s along with the 200 flattening out after a multi year trend.
I am also viewing the current range as a Wyckoff Distribution pattern. From here I would expect a breakdown of the ice line or one last dead cat bounce to retest the middle of the trading range at $2,700 - $2,725. The 50 day MA also happens to be waiting in that area and if that does get retested then it would provide a high probability short sale entry. Same goes if we get a daily close below the ice line.
When we zoom out to the weekly the picture does not get any prettier, in fact it provides very important confirmation.
We broke down the 3 year bull trend line and promptly turned it into resistance. The 22 week MA has rolled down, with the price below it, for the first time since the last presidential election. This week also just closed a bearish engulfing candle.
According to Thomas Bulkowski:
“the bearish engulfing candlestick serves as a bearish reversal in 79% of the 20,000 examples that I studied.”(1)
I have been fully out of my S&P longs for over a month and now I’m fully entered into shorts. That is due to the price closeing below the 4, 9, 50 & 200 MA’s on the daily combined with a death cross with the 50 & 200 along with a bearish crossover with the 3 & 9 MA’s. This is confirmed with the weekly closing below the 4, 8 & 22 MA’s with bearish crossovers across the board.
If you would like to learn how to use moving averages more effectively then I would strongly recommend subscribing to Tyler Jenks Hyperwave youtube channel and starting with the following video.
www.youtube.com
(1) thepatternsite.com

The S&P 500 is F*cked - Death CrossWatch out below, more pain is ahead. The S&P 500 $SPX will form a death cross tomorrow with the 50 and 200 SMA's and we're basically all fk'd. Make sure you have stop losses in place for any long positions, look for overbought futures for a short position. HOLD ON TO YOUR HATS IT'S GONNA GET BUMPY


BCHSV: Bitcoin Cash SV Death cross Time For SHORT Selling !!BCHSV Death Cross Between 20 EMA & 50 EMA, Now We Are Bearish We Cant trade against Trade So Time For SHORT Selling.
Let see ....!!
You Can Trade Above Given Entry, Exit and Traget Point.
You Can Also Set Stop Loss own RR Ratio.
Warning- I m Not a Financial Advisor this idea Only For Educational Purpose Only.
Thank You !!

SPX - ObservationsWhats up Traders -
Just looking at the charts for previous signals and potential future signals.
We see that in the last few weeks, day traders could have acted on two very common trading signals -
- Hanging Man
- Hammer pattern
Both of these signals formed and were confirmed, and would have led to winning trades.
Now that we are back to the resistance line of the descending triangle, we are hoping to see a DOJI on the daily bar for 11/29/18. With a down day on 11/30/18, we would view this as a bearish signal and likely enter a short trade.
Anyway, hope this chart spurs some thought.
Let us know if you have any questions.


Dow Jones Death Cross on the Horizon!The Dow Jones is on track to have its first Death Cross since August of 2015. This is bad news due to the fact that there is little good economic news to jump it up in price significantly enough to change it. December 14, 2018 is the current Trajectory...
Dead Cats all along the way!


DEATH CROSS in CRUDE OIL!We have officially seen the Death Cross in the Crude Oil market; and a confirmation of it with the established "New Low" below the 200 MA.
Dead cats all along the way!

DEATH CROSS UPDATE!SPX DEATH CROSS has been updated to 12/6/18 due to heavier than expected selling; bringing down the 50 SMA faster than the original tragectory indicated!

Death cross forming on S&P 500It can be seen that there is a death cross (SMA-50 crossing below SMA-200) forming on S&P 500 with daily candles. The market has been going down quite noticeably recently and it seems highly unlikely the death cross can be prevented. Drawing tangents for the SMAs indicates they will cross approximately mid December. However, the current double bottom could indicate the prices going up despite the strong downwards pressure and thus, postpone the death cross. If the price breaks below the double bottom I would see the death cross forming even before mid December but if the price goes up from now it will likely form mid to late december.
All in all the forming of the death cross seems quite likely in mid December. When this happens it signals we are likely to be entering a bear market and opening more opportunities for shorting. This might be a good moment to take a look at ones portfolio and consider how much risk you are willing to take and how long your investment time horizon is.

DOGEUSD ON THE DAILY CHART BUY IN PRICE PREDICTION POINTUSING THE EMA 200 AND EMA 50 IN COMBINATION WITH THE RSI TO PREDICT THE FUTURE OF THE NEXT DOGEUSD BOUNCE
WHEN THE EMA 50 CROSSES THE EMA 200 IN AN UPWARD MOTION WHILE THE RSI IS SHOWING HIGHER LOWS AND HIGHER HIGHS
I MIGHT HAVE GOT IT WRONG OR MAYBE IM MISSING SOMETHING PLEASE FEEL FREE TO LEAVE YOUR POINT OF VIEW ON MY IDEA
FOR WHEN I THINK ITS GOING TO BOUNCE BACK THANKS FOR CHECING IT OUT.. PEACE

TOTAL WORLD STOCK MARKET DEATH CROSS!Death Cross happened already and there are short signals everywhere! Random walk down with dead cats all along the way!

DEATH CROSS COMING TO A MARKET NEAR YOU!As you can see, from the chart that the current trajectory of the 50 and 200 day SMA's are indicating that by mid December we will have us a Death Cross in the Broadest market measure...the S & P 500.
This could however happen sooner or later than 12/12/18. This is given that the SMA's stay on their current trajectory through 12/12/18.
A larger than expected fall from here could make that Cross happen much sooner, and a rise from here would push it out until mid January or February.
Its going to happen either way.

12/7/18 Death Cross on SPY?Trajectory currently says December 7th...This is the one that will bring down the broader market if it crosses.

NASDAQ Death Cross by 12/4/18?The current tradjectory for the 200 and 50 MA's says that there will be a Death Cross by 12/4/18. Will it happen...I say yes.
The Russell is already in Death Cross mode. Like I said last week, the next to fall will be major indexes!

Load up your trolleys and grab a mary poppins umbrella!Bitcoin fell to new lows as I'm sure everyone frantically knows and my previous trade was stopped out. In hindsight I should not have been using Bitfinex charts. The discrepancy between exchanges makes for inaccurate TA so I'll be sticking to Coinbase for my market direction until there's parity again. Not all bad news though, we may have had the capitulation we were waiting for. Before all the lucky perma bears start screaming the dirty $3k number all over the place, Bitcoin seems to have found support on the larger previous trendline connecting the highs in December 2017 to the highs in July 2018. This could potentially mean that the pop we had on 15 October was a break out from a prior falling wedge and we have now successfully tested that wedge as support. If we drop back into this wedge I am expecting a large rebound. RSI is also oversold at the lowest levels it has been since January 2015, so I don't believe that there really is not much room for additional selling pressure. Same applies to all relevant time frames so get shopping and load your trolleys.
A move back into the apex of the previous wider falling wedge will hopefully see a breakout from there. When tether drops like this the market becomes unsettled so hopefully the volatility keeps on creeping back over the next week so the breakout can take place with strong volume.
If we have a deathcross on the 3D chart between MA50 and MA200 then this trade is trade is invalidated and we stay below the trendline resistance at least until SEC decision date on 29 December 2018 imo so keep an eye on your 3 day moving averages and use appropriate risk management, especially at these levels (if you're swing trading).
