$BIR - Short Term BearishLong term parallel resistance $4.29 was broken
Broken short term UT,
MACD curling,
Death cross 5EMA and 15EMA
Next support $4.0
Must hold level $3.85
overall short term bearish and long term bullish if it holds $3.85
Deathcross

VXR: Head and Shoulder Pattern + Death Cross + Descending Tri Unless something fundamentally changes the stock isn't looking healthy. Low volume signaling a large movement about to occur within a bearish descending triangle and with the stock trending under 200 EMA. This is after completing a bearish H&S pattern. However, it is to be noted that the SMAs are building towards bullish momentum, so a close eye must be maintained for any anns that will reverse the tide down.


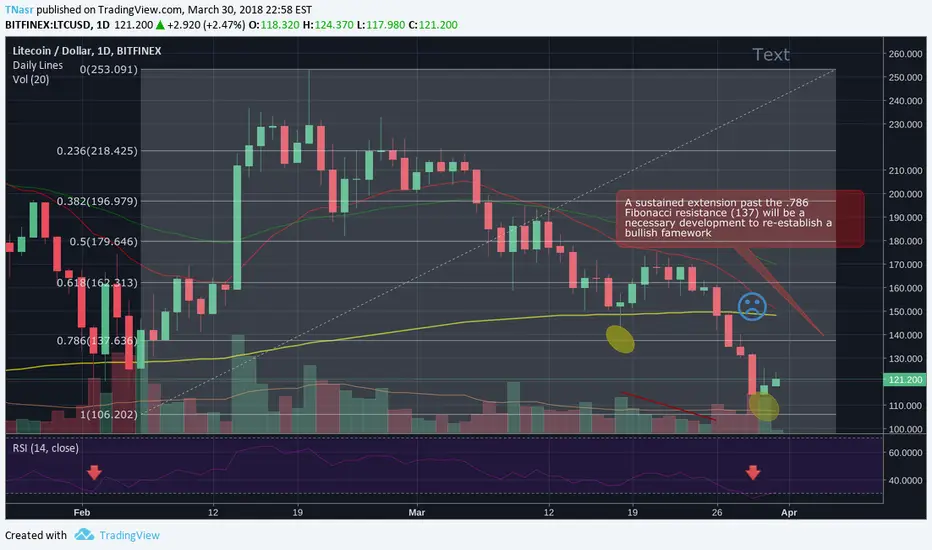
Litecoin... almost thereLitecoin is at a critical pivot I have been highlighting for a long time in several posts. The 'golden ratio' of .618 Fibonacci resistance which LTC is currently teetering around (now a few dollars below). We need to see a solid extension above this level, which equates to about 163, to establish a firmly bullish perspective going forward as far as technical analysis is concerned. The importance of Fibonnaci levels is critical and this is shown with 11 elliptical circles showing where Fibonnaci levels have served as support/ resistance. Recent bullish development include:
1) A reversal in volume patterns with respect to price indicated by the upward sloping green line which is preceded by 4 or 5 downward sloping magenta ones.
2) Positive RSI developments indicated with a white dashed line.
3) Failure of the 'death-cross' to occur which happens when the 50-day movilng average dips below the 200. LTC is also above both of these moving averages.
4) Bullish MACD crossover visible at the bottom.
At the time of writing RSI is indicating LTC is a bit overbought and may pull back a bit but I doubt this would be the start of a large drop. If you find this info useful please give a like, criticisms welcome.

Bitcoin (BTC) MA Death/Golden Cross Analysis (Part 10) --> +40%Welcome to my 10th segment in my golden/death cross live trading analysis series! My strategy is simple: trade the waves and lock in profits. We're making USD on long segments and making BTC on short segments. Forget trading on the absolute highs and lows, we're trading on reliable signals that have been successfully backtested and confirmed in this analysis! Don't believe me? I'm not calling shots after the fact, so go back and see the other trades. We've lost money on a few but have made a lot more than we've lost!
We're still on our 5th segment here, and the metrics are as follows:
Segment 5
04/08/2018 - BUY $6,900
04/25/2018 - SELL $9,000
TBD - BUY TBD
Beginning ($): $10,700
Ending ($): $13,950
Beginning (BTC): 1.55
Ending (BTC): TBD
This was by far our longest bull run here, and we locked in a bunch of profit because of our previous gains against BTC! Let's keep up this magic! Stay tuned for my live trades!

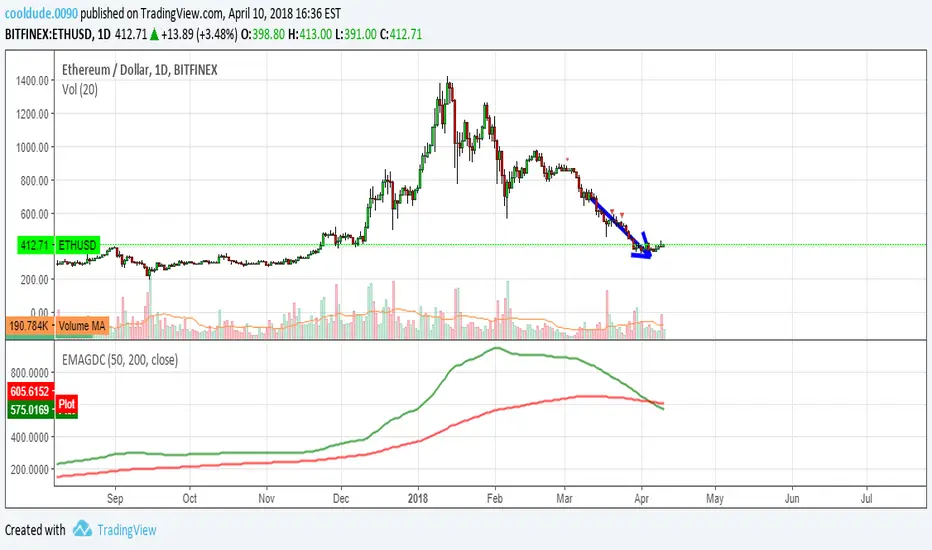
BTC ETH LTC :: 1D MA Study :: Death Cross City or Consolidation?Pretty wild eh! I chose the 3 big dawgs because they have the best data for this, but all the coins move together.
What's more powerful...a death cross or a convergence of MAs with the heavy ones on top and short terms on bottom, anyone?
Enjoy!

Litecoin showing signs of lifeDear all! Its been an amazing week in the crypto world and Litecoin is no exception though it hasn't has dramatic moved compare to some other coins. Usually my posts are a bit long winded but this time around I will break down my technical analysis into 4 main points.
1. We saw bullish signs over a week ago in term of RSI and a MACD crossover and these indicators were correct in guiding the near future for Litecoin.
2. In terms of the candlestick chart the fact that Litecoin managed to rebound just before we would have seen a 'death-cross' (50 day moving average crossing below the 200 day MA) is amazing plus we are very close to surpassing those two moving averages. Look for the white downward arrow towards the right of the chart
3. Per all the yellow and purple elliptical ovals in the chart signifying the importance of Fibonacci support and resistance levels it is very important we extend past the .618 to establish a firmly bullish framework.
4. Volume validates the authenticity of movements up and down. Per four magenta lines on the graph we've seen upward spikes in volume which led only to decreased volume and a subsequent decline in price. Per the most recent volume (indicated by a green upward sloping line) we have seen both volume and price increasing- very bullish.
I am anticipating that we may face resistance at 150 for a reason not evident in this chart and potentially retrace back moderately towards the low 140s before continuing back up. Please give a like if you found this info useful, thanks!

Bitcoin 2018 Half Year PredictionBasing this off of basic indicators.
The first circle is after the first death cross between the EMA 50 and 100 day moving average at the beginning of the 2015 Bull run that peaked in 2018.
The second circle marks the second death cross where the 50 and 100 day moving averages cross indicating a possible end to this 2 year bull run and going bearish. I believe we will become bearish for a few months while Alt Coins have the possibility to become bullish.
I also believe during this time is when a lot of coins trading in USD pairs will seperate their prices from Bitcoin and possibly other coins overtaking BTC. I am still holding in alts but no longer long term holding in BTC.
For BTC to reach 70-100K it would need widespread adoption by the masses which can only be possible by a collapse of fiat currency or a financial crash. This would leverage the market to turn to gold, cryptocurrencies, and other assets to store their wealth.
But if many of the alts best suitable for currency unmarried their prices to BTC that would separate a big part of the Alt Coin market from the BTC market. Meaning alt coin market cap would not be included in the Bitcoin market cap. Maybe this is the year BTC looses its crown in being the king?

Bitcoin to 9,700? Yes it possibleHello,
Welcome back to my page, hope everyone is having a great week so far. let jump right into our weekly bitcoin prediction.
Last week i told you guys that bitcoin will possibly break out to 7,400 and close the week with high of 8,000. Well, it turns out to be accurate just like i predicated it, if you havent seen my video on youtube where i predicated the price gain go check it out.
For next week theres two scenarios likely to happened. btc is currently trending at 8,346. We could see a strong opening week for btc given all the chaotic things going on with stocks and in US, it would help btc in a positive way plus the last day for US taxes is April 17th which is 2 days from today. If we break up trend we could see a massive jump to somewhere around 9,700-9,800 at the end of the week. If we break side ways we could close the week with price of 8,900 to 9,100. i dont think we would fall below 8,000 at the point cause we have strong resistance below 8,000 USD.
If We Maintain the current price over night without dropping, We would see a run between 9,00 to 9,200 on Monday and Tuesday and maintain through the week with a little high and down.
Everything is looking good so far and i hope it works out like this so we can all make money.
Please Like, Share and Follow for more accurate predications
Also please let your comment below, i wanna hear from you. yes you reading right now!
Thank you.

LTC... not out of the woods yetDear all! In my last post (LTC... still teetering April 8) I noted that LTC has shown no clear direction up or down but that a recent pattern of price movement does not bode well. I think according to technical indicators this may have changed though direction is still not clear. We have recently seen some bullish indicators manifest. Specifically there has been a bullish MACD crossover (denoted with a downward pointing arrow) and a notable bullish divergence as far as RSI is concerned (denoted with a dashed white line, above MACD and below the chart) but LTC is NOT out of the woods yet from a Technical Analysis perspective.
For context please note that you are looking at candlesticks, each representing one day in a chart whose scope is just over 2 months. From the chart we can see 4 (highlighted by yellow ellipticals) instances where Fibonacci levels served as support; but were subsequently broken to the downside, and 6 (in light blue) which have served as resistance. I will not focus on the Fibonacci tool in this write up as we are too far away from the most meaningful levels. Instead I want to focus on volume.
LTCs price behavior, like may coins, may depend on that of Bitcoin but in the most recent leg up LTC has been lagging; your guess is as good as mine as to why and this could easily change in the future, look at the run up from Feb. 6 to the 20th for example. Following from the first paragraph above we are not out of the woods yet. This is for several reasons. In the most current run up we broke a downward sloping resistance line but this is the first of four hurdles to clear with the 50 and 20-day moving averages and the .786 Fibonacci still overhead. If and when we break them volume on any such move will also be important because per 4 downward sloping magenta lines at the bottom of the chart we have seen decreases in volume (after an initial upward pop) leading to decreases in price and I'm concerned this pattern may repeat itself. Please look carefully at two white downward facing arrows within the chart (similar to the arrow in the MACD box). VOLUME validates the strength and authenticity of price moves in any direction and we have already seen higher than recent volume on an upward move on Mar. 9 which did not lead to a trend reversal so I am concerned that the volume in the most recent pop (second white arrow/ April 12) is not sufficient enough for a trend reversal as well.
Within the current levels as long as we don't dip below 106 (the start of Fibonacci levels) an argument can be made for being neutral. Also note the 50 day MA is slowly converging towards the 200 at the point of the sad face but I don't think they will necessarily inevitably meet plus remember that MACD has shown a bullish crossover if only with respect to shorter time frames. In my last post I wrote "Long term, and potentially in as little as under a month this bear market could be over and we will be headed up but the technicals have to show us evidence of that." and technicals are beginning to show just that but VOLUME is a concern. If you find this info useful please give this post a thumbs up. Lastly I want to emphasize the importance of studying contrarian views to your own. If you are long any given coin study short opinions and vice-versa, also be flexible and willing to change your mind, be like water.

Death cross?If you look closely, using the 20-50-100-200 EMA, the 200 EMA is about to finally cross 100 EMA. When this happens, the 200 EMA will be at the top, followed by 100 EMA, then 50 EMA, and 20 EMA at the bottom. This is the hallmark of real bear runs in every market ever. Also, if we look at RSI, the price level is still lower than March, yet the RSI is much higher than March levels, even with the current dip as i type this.
Also, although 4H charts show good bullish indicators on ichimoku kinko hyo, the 1D charts have always been slow to reflect those. When it finally did a day ago, it was conflicting with most of the fundamentals. If the bull run starts now, it would be really conflicting with previous BTC trends.
Truth is i don't think anyone knows what is at play here right now. Best to take some profits if you have them and have those fiat ready in case the big bear comes.

BTC support resistance and Death CrossAfter death cross, BTC looks no good. New target is about 2500$.

Bitcoin (BTC) MA Death/Golden Cross Analysis (Part 8) --> +7%Welcome to Part 8 of my BTC tracking analysis. I'm using a simple wave analysis to capture gains while BTC continues to decline in price. At the beginning of this, I outlined that this is my only investment in the crypto market, as altcoins don't tend to do well when new money is not flowing into the market. Some have done well, but this is much riskier than the method that I'm using here. At the end of our last leg, we were up 55% on BTC and we're not up 7% against USD.
Segment 4
04/01/2018 - BUY $7,150
04/04/2018 - SELL $6,900
TBD - BUY TBD
Beginning ($): $11,100
Ending ($): $10,700
Beginning (BTC): 1.55
Ending (BTC): TBD
The MA is flat now, so this may also be a short segment depending on where the price moves here! Follow along and trade!

LTC... still teeteringIn my last post (LTC: FIbonacci levels are in play Apr 30) I noted that LTC has shown no clear direction up or down but that a recent pattern of price movement does not bode well. I think this is still the case. For context please note that you are looking at candlesticks, each representing one day in a chart whose scope is just over 2 months. From the chart we can see 4 (highlighted by yellow ellipticals) instances where Fibonacci levels served as support; but were subsequently broken to the downside, and six in light blue which have served as resistance. I am concerned we will break below 106 and am not sure if this will happen.
LTCs price behavior, like may coins, may depend on that of Bitcoin. I think Bitcoin (and this Litecoin) may be forming a bearish head and shoulder pattern which started in late March. I am basing this observation based on 6-hour candelesticks (not visible in my chart above though it loosely shows a potential H&S). As noted in the chart we must see an extension past the .786 (138) currently serving as resistance per the fifth yellow elliptical. Volume on any such move will also be important because per 5 downward sloping magenta lines at the bottom of the chart we have seen decreases in volume leading to decreases in price and I'm concerned this pattern may repeat itself. The start of Fibonacci (106) has held as we did not dip below 109 in the most recent dip and I'm hoping it will hold in the near future as well.
Even if we extend past the .786 we could still be below the 200 day moving average. Within the current levels as long as we don't dip below 106 an argument can be made for being neutral but the coins position is simply to precarious at the moment for me to be anything but short. Also note the 50 day MA is converging towards the 200 at the point of the sad face thus I see no evidence of upside in the near term. Long term, and potentially in as little as under a month this bear market could be over and we will be headed up but the technicals have to show us evidence of that. If you find this info useful please give this post a thumbs up. Lastly I want to emphasize the importance of studying contrarian views to your own. If you are long any given coin study short opinions and vice-versa, also be flexible and willing to change your mind, be like water.

Double Bottom Bitcoin IdeaSo far so good, but we need a little extra push up. Also, we need a crossover on the Stoch RSI. I think bitcoin might still be a bit frugal due to the expectation that the death cross will drag it down a lot. As I explained in my previous post, I feel like the deathcross might not be as bad as you would expect seeing the context of bitcoin and how the prices of bitcoin have established in the last months. Usually, a death cross would be a confirmation of a long-term downtrend. Actually, it is a confirmation that comes quite late - the downtrend already has occurred before you see a deathcross. Still it can move down more... However, we experienced a super hype in the media in december, so this might have affected the moving averages in such a way that it looks worse than it actually is. Furthermore, as you can see on the two-day chart, a death cross is basically non-existent and the 200 EMA is still holding it as support. I would be worried though if it severely breaks underneath it. Either way, it can still grow in various directions. If the double bottom would complete, it does fall within a classical textbook of a nice bullish double bottom. Thanks Bulkowski.
Disclaimer: I am a beginner and this is not investment advice. Feedback is welcome.
Note: I picked 2-day instead of 1-day in an attempt to reduce noise caused by the hype.

IOTA is touching the ''Death cross''Looking at the IOTBTC chart, I noticed that the price is under 2 important points of resistance.
- The previous support which acts now as resistance at 0.000159-0.000165
- The Death cross (50MA crossing the 200MA) is just above the resistance
Also I have to mention that I do not trade the death cross sell signals blindly. This time I like very much the fact that the price action is really close to the death cross. There are 2 ways I could enter this trade. First is to enter when I got a new daily low, at 0.000153. The second way is to wait until the price gets near to the 50MA. In this case I got a great risk reward but the chances of being stopped out are more. Last thing, from fundamental perspective I believe that IOTA is still overvalued vs BTC (as most of the altcoins) and there is more downside in the longterm.

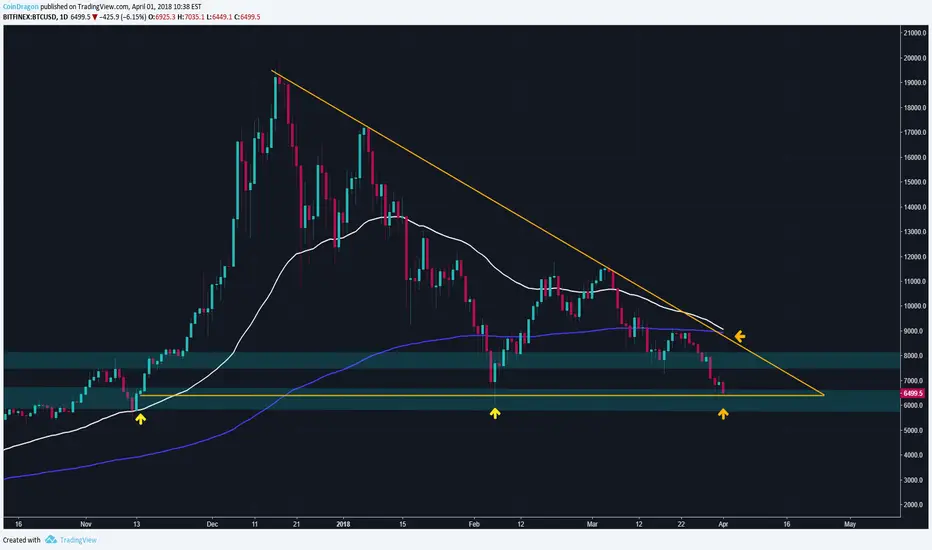
Bitcoin Bearish Probability SignalsBitcoin loves triangles (they are very accurate the majority of the time).
1.) We just confirmed a mammoth Descending Triangle, which is a bearish signal.
2.) We can either breakdown from here, if we do on strength (large volume) -> Great short setup, with tight stops.
Or horizontal support holds and we consolidate or more, retest resistance or breakout for the bounce we all love.
(The Death cross is getting intimidatingly close too)
Will do some analysis on bitcoin scenarios and post them after this.
Litecoin is at an inflection point!Dear all, Litecoin seems to be at an inflection point for multiple reasons. I'll explain. First for context please note you are looking at daily candlesticks in a chart whose scope is a little bit more than 2 months. The Fibonacci levels are determined from the run that started on Feb. 6 and ended on Feb .20. On Mar. 18 we saw LTC retrace to the .786 (in the first yellow elliptical) which served as perfect support and we subsequently witnessed a bounce. However in this bear market LTC fell further as we saw volume consistently decrease (denoted by a red downward sloping line).
Very recently we saw LTC retrace to within 3 dollars of the Feb.6 start of the run (denoted by the second yellow elliptical); if we break 106 we are probably headed down more. One moderately bullish development is that RSI is showing that LTC is oversold (denoted by a red arrow) which may provide some upward momentum. The last time RSI was at this level (first red arrow) we saw a sustained break to the upside. One bearish development that almost seems imminent is the 'death-cross' of the 50 day moving average nearly breaking below the 200 day, denoted by a sad face.
I entered LTC recently in the teens and am looking to sell in the low to mid 130's with a view to the .786 serving as resistance. If however LTC increases with volume I may hold longer. I want to emphasize the importance of studying contrarian views to your own. If you are long any given coin study short opinions and vice-versa, also be flexible and willing to change your mind, be like water.
Continues to consolidate - Death Cross Surprise?The consolidation continues as we forecast. I believe with all the fervor and misinformation transmitted over the death cross, there will be a small counter rally before Bitcoin heads lower.

BTC/USD - Official Death Cross - M - AnalysisWill the Death Cross bring the BTC price down, to around the 3000 price range?
The PURPLE lines indicate a stronger support and resistance zone than the RED lines.

Setup for a short-sell on Bitcoin/U.S. Dollar (BTCUSD)
Once the price comes out of the bottom of the wedge and the candle closes, it should be a good place to short. I'm gonna set my stop-loss right above the bottom support line of the rising wedge.

Finally seeing bearish priceaction post deathcross; bearpennant?It was confusing to me why there was such an unexpected bull surge recently immediately following the death cross on the 1 day chart on bitfinex. We climbed almost to the last recent climb but couldn't attain a higher high above it before now finally seeing a bearish reversal...This may be because even though the 2 moving averages have crossed on the current day candle...those moving averages can be moved until the current 1 day candle closes and then their positions for today are set in stone....so maybe it was a last ditch effort by some big holders to somehow take us high enough to push the death cross back apart before the 1 day chart closes 8 and a half hours from now. That would unfortunately take about 5 times the bull impulse we've currently seen which now that we've turned back around without even surpassing the last high seems unlikely which should set the death cross into stone by the time this 1 day candle closes. We are currently forming an equilateral triangle with price action that will likely be a bear pennant and once todays 1 day candle closes and sets the deathcross in stone on the bitfinex map will likely cause all other exchanges where the deathcross has yet to happen yet to occur....this will create a bloodbath on April Fools day with people thinking bitcoin is doomed...however I think that will be cryptos Aril Fool's Joke....I still hypothesize that it will only dip to the price level of the low we reached on february 6th (5700-5900) which I think will trigger a massive double bottom at that point and see us skyrocket back up and into the bull market just in time for the second quarter after triggering a goldencross soon thereafter....this is all just a gut instinct and is in no way shape or form meant to be taken as gospel or financial advice. We will soon see in the next couple days. Make your own decisions, choose wisely and good luck!
