Potential Falling Wedge on CRMBulls tried to reclaim the 200 EMA, but were strongly rejected. Salesforce is down 11% in two days. We're entering my "Buy Zone" (where it's on my radar, but I need a confirmation, like divergence, before I'm ready to take a position). I'm expecting a Falling Wedge to form, and will likely wait for it to play out further. It's too risky for me at these levels, but more aggressive traders may have an opportunity to scalp some short-term profit before we head down further.
----------------------------------------------------------------
These are my personal views and not financial advice. Please do your own research before investing.
I'd love to hear your thoughts, ideas and feedback. Feel free to Comment and I'll try and get back to you quickly.
If you appreciated this analysis, consider Liking or Following . Thanks!
Deathcross

Big week for BTCIt's a big week for BTC. Things to watch this week:
-Will BTC move up to close above the 200 day average ($47,953)?
-BTC continues to trade down within a downward channel from all time highs, will it reverse?
-Will BTC see death cross if 50 day ($51,965) cross the 200 day ($47,953)?
-Since December 27th BTC has dropped and now trading in a tight wedge, would this Bear flag play out?
-Would the H&S neckline hold (neckline break will force BTC to test $30K and if it doesn't hold $18-20k might be tested)?
BTC needs more volume to come in or it might be hard to overcome these hurdles.
All these points are based on the daily chart. Have a great week!

Luna moving in a Rising wedge pattern* Luna in 3H time frame is moving within a Rising wedge pattern.
* Rising wedge occurs when the price moves between two ascending trendlines forming higher-highs and higher-lows.
* If the price bounces from it's support zone ( around $84 ) it will regain the $101 levels. If price moves below the support zone we can expect a drop till $75.

XRP - Next targetsHeading down towards the previous support level of 0,73894. Lets see if we can hold that level and bounce back up towards the 0.382 fibonacci level of 0,79935. We also formed a death cross so not looking good at the shorter timeframe.

The Sandbox 2 [40k or 53k ?!]The Sandbox
We are still in a Sandbox like Jun 2021
touched 3 times bottom of the box and 3 times top of the box
2 Scenario is possible:
1. a Death Cross (ma50/ma200) like Jun 2021 , break down to 40k Support
2. break up the Sandbox to 53k resistance and a parabolic move in Q1 2022
but we should Retest descending trend line (white line)
What do you Think?

FB - Death CrossThe cross of MA50 and MA200, also known as Golden Cross for bullish trend and Death Cross for Bearish trend.
FB is almost two years in upward trend from the start of pandemic, but the death cross on December 10 cannot be ignored, even it is fake or not.
Price is trading above MA50 and MA20.

BTC Officially Entering Death Cross at D-1We will look bear dominance in the next day, good luck :
$100.000 in the end of this year? maybe in the other reality yes :p

Extreme Fear on Bitcoin Street. #Deathcross before another dip?!Hey guys! I hope you fine and staying positive during this period.
Since last update, we reduced Bitcoin exposure from 56K breakdown. Bitcoin market continues sloping down despite good news, positive sentiments and fundamentals.
Key level to hold right now is near 47-46K. Seems like if this level is going to fail, price will drop towards 43-39-35K during January-February 2022.
In case of price action breakout from 53K-ish, I think the price will stay in the range of 55-50k for a little while.
Right now is the time to stay on hold with new entries. Being extra careful is a good plan for this short period.
Keep in mind that price action changes quickly, so if we see a positive breakout from 55k, this would mean the price will go back to the rising trend which was developed during 2020.
Best regards
Artem Shevelev

Ethereum price analysis * Ethereum is retesting the breakout level of Symmetrical triangle.
* If the price gains support on the above trendline, it will bounce back to $4850 level. Price below the lower trendline is bearish.

How soon we forget BITCOIN Death Cross and Golden CrossBitcoin is on a wild ride. Sometimes we forget where we have been. If you remember it was only a few months back when BTC had a death cross. Which was a fake out because soon after a Golden Cross triggered. And before both of those events BTC did a 500% gain in 2021. At the end of the day it seems the HODL strategy is the best strategy. Take a look at this chart and come to your own conclusion.
Be safe out there
~S

Double top in Bitcoin, Will it drop below it's support ?* Bitcoin appears with Double top in daily time frame with it's neckline as Support near $58300.
* If Bitcoin breaks it's support of $58300 we can expect a drop till $53500 ( Important support ).
* The RSI indicator is respecting the trendline by keeping the RSI above it.

Bearish divergence in Bitcoin* Bitcoin in Daily time frame is forming a Rising wedge pattern.
* If the price breaks the Rising wedge pattern we can expect a drop till it's important support around $58,000 or till the below major trendline.
* RSI bearish divergence also appeared on Bitcoin, Divergence appears when there is no longer the same momentum between price and the RSI indicator.

Australian Dollar at Risk as AUD/JPY Enters Downtrend?The Australian Dollar may be vulnerable to the Japanese Yen following a couple of bearish technical developments. This follows a rejection of the 86.253 - 85.909 resistance zone.
AUD/JPY recently confirmed a breakout under the 23.6% Fibonacci Retracement at 84.50 on the 4-hour chart. This also follows a bearish Death Cross between the 20- and 50-period Simple Moving Averages.
This has exposed the 38.2% level at 83.416. Still, prices remain above the 200-period line, which could reinstate the broader upside focus. On the other hand, breaking under it could open the door to extending losses towards the September low at 78.825.
Keep a close eye on the 82.028 - 81.662 inflection zone. The latter price is the 61.8% retracement.
Positive RSI divergence does show fading downside momentum, which can at times precede a turn higher.
Clearing 86.253 would open the door to resuming gains since August.
FX_IDC:AUDJPY

Golden Cross in ChainLink* Golden cross appeared in Chainlink daily time frame.
* Golden Cross occurs when the Short term Moving average ( 50 MA ) crosses above the long term Moving average ( 200 MA ), this indicates the long bull rally.

AAVE forms a bearish pattern* AAVE in daily time frame forms a Ascending channel pattern.
* Ascending channel appears when the price moves between two parallel ascending trendlines forming higher highs and higher lows.
* If AAVE breaks the lower trendline of the pattern we can expect a drop till $251 and to continue the uptrend the price needs to move within the pattern or break the upper trendline.

Luna in a Healthy uptrend* Luna is moving in a Channel pattern forming higher highs and higher lows, respecting the below trendline as it's support.
* After testing the below trendline (support) we can expect Luna to bounce back and form a high.

USD/CHF Ready to Bounce? Eyes on January TrendlineUSD/CHF has been in a near-term downtrend since late September, now finding itself on a rising support range from the beginning of this year.
A bounce off the trendline could pave the way for a push higher back towards a long-term falling resistance line from April 2019.
Still, a bearish Death Cross seems imminent between the 20- and 50-period Simple Moving Averages. These could hold as key resistance in the event of a bounce from here.
Breaking under the rising trendline from January exposes the 0.9019 - 0.9038 support zone, consisting of August lows. Below that sits the 0.8926 - 0.8952 zone, which is made up of May and June lows.
FX_IDC:USDCHF

Bullish continuation pattern in Tezos* Tezos in Daily time frame forms a Cup and Handle pattern.
* Cup and Handle is a bullish continuation pattern occurs during the uptrend. To continue the trend price needs to break the handle ( Falling channel like pattern).
* After a proper retest to the breakout level, we can see the continuation of uptrend in Tezos.

Will Shib continue it's uptrend ?* Shib in 1H time frame appears with Ascending triangle, with it's support as below trendline and facing resistance around $0.00004330
* In order to continue the trend Shib needs to break the above resistance.

Bitcoin surging towards ATH* After a breakout from the Rising Channel Bitcoin created a new ATH and drops back to $60K level to retest the breakout.
* Now the price is bouncing back to it's ATH after a proper retest.

Trend reversal pattern in Zcash* Zcash in Daily time frame appears with Double Bottom pattern
* Double bottom is a trend reversal pattern appears during the down trend and signals that the sellers, who were in control of the price action, are losing momentum.
* If Zcash breaks it's resistance of $176 we can expect bullish momentum in price

Will XRP continue the bull run ?* XRP in Weekly time frame forms a Symmetrical triangle pattern
* Symmetrical triangle appears pattern when the price consolidates between two trendlines slightly sloping towards eachother.
* The Below Ascending trendline works as support to the price and the above Descending trendline works as resistance. The price is squeezed till it breaks the pattern and continues the move.
* In order to continue the bull run XRP needs to break the above trendline.

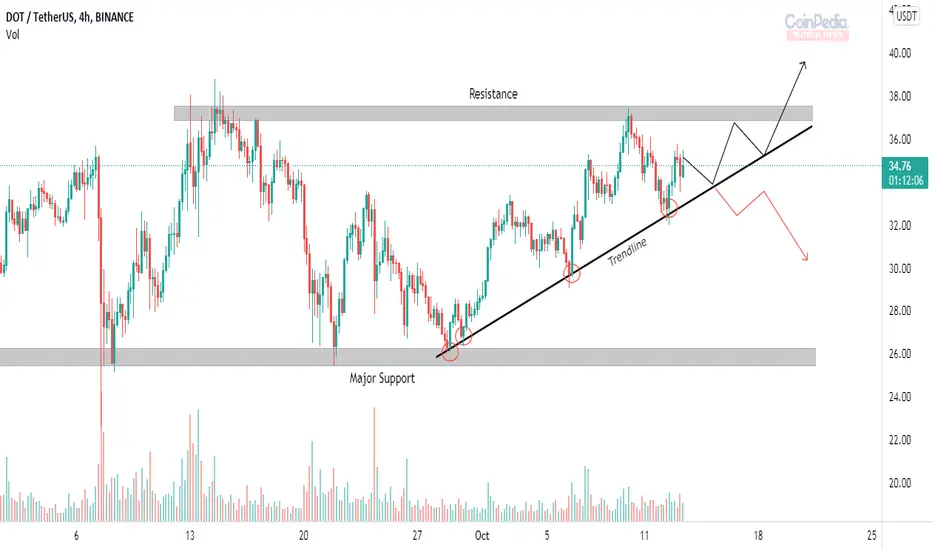
Polkadot analysis in 4H time frame* Polkadot is moving within a range between it's resistance around $38 and it's major support near $26.
* The below ascending trend-line is working as support for the price. In order to continue the uptrend DOT needs to break the above resistance.
* If the price breaks the below trend-line the price will drop till it's support zone.