SHORT - GOLD (XAU/USD): Decending Triangle on GOLD Good Morning, Traders.
As always, please note that this is not financial advice — always do your own research (DYOR).
This morning, we are observing the development of a descending triangle pattern on the 15-minute timeframe, forming at a critical support level. This technical formation is often indicative of bearish momentum.
Should the price action decisively break below this key support, it would signal a potential shorting opportunity. Such a breakdown could trigger accelerated selling pressure, offering the possibility of favourable risk-to-reward setups for short positions.
Traders are advised to closely monitor price behavior around the support line, watch for increased volume on the break, and ensure proper risk management before entering any positions.
Stay vigilant and trade smart.
Decendingtriagle

BTC/USD - Bearish Break & Retest SetupMarket Overview :
Bitcoin (BTC/USD) has broken below a key consolidation zone after trading in a range between $90,000 - $108,000 for several weeks. The price is now attempting a retest of the previous support, which has turned into a resistance (supply zone) before a potential continuation to the downside.
Chart Pattern & Technical Setup:
📉 Break & Retest Structure: The price has broken below the previous range and is now testing the $87,000 - $91,000 resistance zone.
📉 Lower High Formation: BTC is expected to create a lower high before continuing its downward trend.
📉 Bearish Wave Projection: The chart suggests a zigzag movement, forming successive lower highs and lower lows, targeting $67,399 as the next support level.
Trade Setup:
Bias: Bearish
Entry: Sell limit at $87,000 - $91,000 (Supply Zone)
Stop Loss: Above $95,000 (Invalidation Level)
Take Profit: $67,399 (Next Key Support)
Confluences Supporting Bearish Bias:
✅ Supply Zone Rejection: The resistance area is likely to attract sellers.
✅ Market Structure Shift: A break below the previous range indicates a trend reversal.
✅ Lower High Confirmation: A rejection at resistance will confirm the bearish outlook.
Risk Management:
Risk-Reward Ratio (RRR): 1:3+
Position Sizing: Adjust based on risk tolerance.
Alternative Scenario:
A break and close above $95,000 would invalidate the bearish setup, signaling a potential bullish continuation.
📌 Disclaimer: This analysis is for educational purposes only. Always manage risk properly before entering a trade.

XAU/USD Daily Chart Analysis! Detailed ExplainationMarket Overview:
Gold (XAU/USD) is currently trading around $2,910, showing a slight decline of -0.05% on the daily timeframe. The market has been in a strong uptrend, breaking previous structures and forming higher highs and higher lows. However, the current price action suggests a potential pullback before another bullish continuation.
Key Technical Observations:
1. Resistance & Strong Resistance Zone ($2,950 - $3,000+)
The price has reached a strong resistance zone near the $3,000 psychological level, where selling pressure is evident.
A weak high has been marked, indicating that buyers may attempt to break this level, but sellers could push the price down before any significant breakout.
If price successfully closes above this resistance, it could trigger further bullish momentum towards $3,100 or higher.
2. Support and Demand Zone ($2,750 - $2,800)
The demand zone between $2,750 and $2,800 has historically acted as a strong support level.
This zone aligns with previous price accumulation and a key structural support level.
A pullback to this area could present buying opportunities, as institutional buyers may step in.
3. Market Structure and Breaks of Structure (BOS) & Change of Character (ChoCH)
Multiple Change of Character (ChoCH) points have been noted, signaling shifts in momentum.
The Break of Structure (BOS) suggests a continuation of the prevailing bullish trend, with minor corrections along the way.
The most recent ChoCH indicates a potential short-term bearish retracement before a continuation to the upside.
4. Strong Low and Potential Support Levels ($2,500 - $2,600)
The strong low is marked below $2,500, which acts as a long-term support zone.
If the demand zone at $2,750 - $2,800 fails, the next major support area lies around $2,600.
However, given the overall bullish trend, a drop to these levels would likely be short-lived unless macroeconomic factors shift significantly.
Potential Price Scenarios:
🔵 Bullish Scenario (Primary Outlook)
Price may retrace towards the $2,750 - $2,800 demand zone.
If buyers defend this level, we can expect a bullish reversal towards $2,950 - $3,000 resistance.
A strong breakout above $3,000 would likely trigger further upside momentum towards $3,100+.
🔴 Bearish Scenario (Alternative Outlook)
If sellers take control and push price below the $2,750 support, further downside could follow.
In this case, the next major support levels would be $2,600 - $2,650, where buyers may re-enter.
A breakdown below $2,500 would signal a shift in long-term market structure, invalidating the bullish trend.
Trading Plan & Strategy:
✅ For Long Entries:
Look for bullish price action (e.g., pin bars, bullish engulfing candles) in the $2,750 - $2,800 demand zone.
Target $2,950 - $3,000 as the first take-profit level.
If price breaks above $3,000, hold positions for a move towards $3,100 or higher.
❌ For Short Entries:
If price struggles to break above $3,000, short positions can be considered with stop losses above resistance.
Targets for short trades: $2,800 (first TP), $2,650 (second TP).
Final Thoughts About Trend:
Gold remains in a strong bullish trend, but a short-term retracement could be expected before the next rally. Traders should focus on key levels like $2,750 - $2,800 support and $3,000 resistance to confirm the next move. Watch for confirmation signals before entering trades. 📊🚀

BTCUSD price is getting ready to drop to 100,000 to 97,000BTCUSDT is encountering significant opposition. In order to create a defense conglomerate, the price is being forced as far away from the 105–107K range as feasible. However, the worldwide bullish position cannot yet be overshadowed by this resistance.
On H1-H4, a symmetrical triangle and a descending channel are developing into a contentious scenario. Additionally, everything is dependent on which market segment views which figure. Although a rebound may accompany the initial reaction to the triangle support, given the resistance, we can presume that the price will attempt to decline and that the triangle's rebound will not be significant.
The price is prevented from falling by the support at 101.600 if we examine the descending channel.
Yes, technically, 101.600's support is now what matters most. Whether or not this level will hold the price is the key question.
At its core, the issue is controversial because it primarily hinges on America and how Trump and other politicians would employ rhetoric around cryptocurrency. It might be empty rhetoric, a bubble, or a sham to win an election. Or it might be a real tactic.
Resistance levels: 103453, 105765
Support levels: 100150, 98890
Focus on 101.6. I anticipate a short-term price consolidation and fall below the level, followed by a decline to 100–97K BUT! A false breakdown of 101.6 could result in a brief upward bounce before a further down to 100K because the chart shows a symmetrical triangle.
Analysis By: NexusTradesZone

WTI | Selloff Back to $68 w/USD/JPY CorrelationSince the last call on Oil we successfully hit the $77 target.
This next move is now looking to head back to $68 support based on the pivot moves within the current Descending Triangle pattern.
This is also another opportunity to take a back-to-back swing on FX:USDJPY
We got divergence on the forex pair acting like the 'price' and 'oil' acting like the indication
(Convergence/Divergence)
Oil moves first on the down move and usdjpy will follow through after it makes one more leg up.

LTC/USDT Descending Triangle Breakout with Retest OppurtunityKey Observations
1. The chart illustrates a Descending Triangle breakout, where the price has successfully moved above the descending trendline, confirming a bullish continuation.
2. The breakout has brought the price above the horizontal resistance zone at $115, which now acts as support.
3. A retest of the breakout zone ($115–$116) could provide an ideal entry opportunity for buyers.
Strategic Implications
Monitor the price action closely around the $115–$116 level for signs of a successful retest. If the support holds, it may lead to further upside, with the next target zone around $130–$140, aligning with previous highs. Use a stop-loss below $110 to manage risk effectively, as a breakdown below this level would invalidate the bullish setup. Look for volume confirmation during the retest to reinforce the strength of the breakout.

AAVE Looks Very Bullish!There's not much room/time left for AAVE to consolidate. AAVE has been making lower highs but holding support at the lows as well.
After the next potential selloff to the golden pocket or the range lows, I would expect AAVE to make a very big move once the downtrend line is broken decidedly and the price consolidates above.
BULLISH ONCE TRENDLINE BREAKS!
Every day the charts provide new information. You have to adjust or get REKT.
Love it or hate it, hit that thumbs up and share your thoughts below!
Don't trade with what you're not willing to lose. Calculate Your Risk/Reward!
This is not financial advice. This is for educational purposes only.

DOGE/USDT Decending TriangleDoge/usdt Create Decending Triangle on Binance 4h chart pattern
What is a Descending Triangle?
A descending triangle is a bearish chart pattern used in technical analysis that is created by drawing one trend line that connects a series of lower highs and a second horizontal trend line that connects a series of lows. Oftentimes, traders watch for a move below the lower support trend line because it suggests that the downward momentum is building and a breakdown is imminent. Once the breakdown occurs, traders enter into short positions and aggressively help push the price of the asset even lower.
What Does a Descending Triangle Tell You?
Descending triangles are a very popular chart pattern among traders because it clearly shows that the demand for an asset, derivative or commodity is weakening. When the price breaks below the lower support, it is a clear indication that downside momentum is likely to continue or become even stronger. Descending triangles give technical traders the opportunity to make substantial profits over a brief period of time. Descending triangles can form as a reversal pattern to an uptrend, but they are generally seen as bearish continuation patterns.

DOGEUSDT DESCENDING TRIANGLE PATTERNDOGEUSDT has formed a descending triangle pattern and looks bearish

BTC Decending TriangleBTC Decending Triangle If BTC Breakdown Below 19500 And Retest Level 19500 To Go Short Target 19200--18800 Next Target 18200--18000
If BTC Go Long Toh Breakout Decending Triangle Pettern If Breakout Triangle Go Long Target 20600--20800 Next Target Is 21200 And Next Major Resistense 21800-22000

BTC/USDT Range Possible Descending Triangle - May to June 2022Colored (Coloured) lines drawn from highs above. Trading range
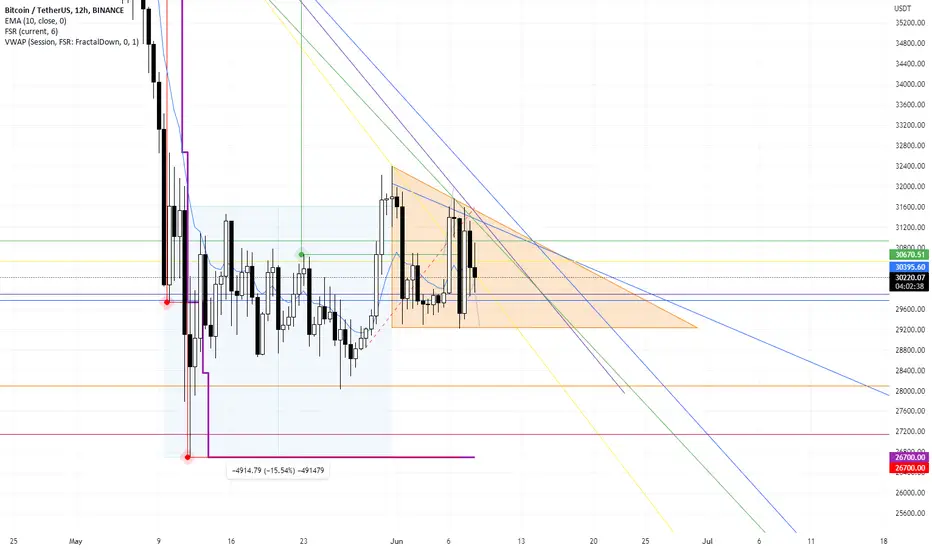
It can drop to $23K After a drop to 25.4K, The price was corrected to the level of 0.5 Fibonacci.
The price has moved sideways, in a tight range for a relatively long time. Now this range is broken and the price can continue to move.
Targets are displayed on the chart.

SHIB/ USDTVery interesting , now there are 2 clear options if you see a descending triangle that's means is a down trend the price will hit lower targets but if you see again candle pattern the its clear visible a FLAG Pattern , and FLAG is a up Trend that's why i share both scenario.
Note: While Trading Keep eye on Bitcoin behavior
Hit like more i receive like more i share ideas

Infy forming decending triangleIn a downtrend infy is forming a decending triangle.high chance that downtrend can resume after the breakdown.

Gold short term bearish, Long term bullish, right now - NeutralI can see some short term bearishness in SAXO:XAUUSD for the next few weeks.
A breakdown of the support @ 1910/1900 could result in a test of MAJOR SUPPORT @ 1830.
This leaves us between a nice range of strong support and resistance. Could easily end up playing out as a H&S or a Cup & Handle.
We would need to see Risk on Assets come down again to rebreak through what would then be string resistance around 1910.
Boom,
@theRaggy

$XRP Potential Swing Long (Fibonacci Retracement)I stumbled upon a recurring pattern on the XRP daily chart. It seems like every time $XRP has retraced back to the 0.5 Fib level before it bounces off it. Now as XRP could be breaking out of the descending triangle or you could call it a massive bull flag, we could potentially finally see XRP Move back up to newer highs in the upcoming months.

Massive decending triangle on Solana?Appear to have a large decending triangle forming on SOL. Unless it can break up through that downtrend line I see it going to highlighted area

LONG on CADCHFSince March of 2021 this pair has been in somewhat of consolidation. constantly hit support or resistance and reversing from it like clockwork.
Price is currently in the support area and has broken out of a descending triangle on the 1hr timeframe with a massive bullish candle showing on the daily timeframe.
I expect price to reach back up to the resistance area or very close to it before starting to reverse back down. We also have a golden cross on the MACD with volume.
My entry, sl and tp prices should be marked on the chart.
Thanks.

Long trade idea on CHF/JPYThis pair is in a very strong up trend
on the daily and has formed a pivot
zone on the 4 hr at 124.30 . Also looks like
a decending triangle forming. I will look for a
break of this triangle for a long trade. Initail target
would be top of triangle with a stop below the
124.30 pivot zone.

Tata Motors Descending_Triangle_1HrTata Motors is forming a descending triangle on a 1-hour chart.
Gap to fill: There are chances to fill a gap of about 65 points that occurs on 13 Oct.
Tata Motors taking support near 469 if this support breaks we can see weakness in this instrument.
Happy Trading.


ADA descending triangle offering a 5.5 RRHi all, looks like Cardano's been using one of the BlockBullders trowels to build itself a pattern for the last wee while. The Bullder think's it's just about bottomed given the decrease in selling volume and supportive trend it's tapped twice. There's a good RR if some patience is had.
Thanks
Blockbullder

Bitcoin is falling!As we see Bitcoin is in a descending triangle, we have many reasons (like fear and greed index, fed news, exchanges news) to expect downward movement for that, however, we should consider few issues:
.
- We have a strong support area there at 38k to 40k which price reacted to many times
- It's going to consolidate under 200 MA
- No momentum in the market!
.
So we have two scenarios:
1- the support area pushes BTC up for 44k and more
2- Breaks the support area and goes for 38k and less, this is the scenario which I believe more
God bless us ;)
