Long MANAUSD - Elliott impulsive waves phase 3 BULL-RUNWe are finally in the third impulsive Elliott wave, we had our bottom during the phase 2 correction towards $2.9. There is still time to get in on the MANA !
Entry Price: 3.81
Target Profit: 7.19 (+89.3%)
Stop Loss: 3 (-20.6%)
Risk / Ratio: 4.32
Personal Entry : 3
Decentraland

BITCOIN Daily TA : 12.26.21 : $BTCA pessimistic but still probable analysis of Bitcoin (I try to explain it very simply and understandably): Well friends, as you can see, 4 weeks ago the support price of the important 20-week Exponential Moving Average EMA20W lost and has stabilized below this range. It is interesting to know that this week the price hit this moving average by reaching to $ 51700 and showed a negative reaction to it, the optimistic scenario is the same as the previous analysis we talked about . The pessimistic analysis begins with the fact that if we consider the drop from 69K to 42K as a spike and a complete bearish wave, in the last 3 weeks the price is just preparing and building a base to drop more and start The next wave , if this analysis is confirmed, the descending targets are marked on the chart in order that if we want to consider an AB = CD pattern to fall again, the target will be $ 25,000. Note that this is one of the most pessimistic analyzes available, and I just thought it's my duty to share my analysis with you, and that if the price can break the EMA20W and stabilize above it (especially above 57K) this analysis will fail.
Follow our other analysis & Feel free to ask any questions you have, we are here to help.
⚠️ This Analysis will be updated ...
👤 Arman Shaban : @ArmanShabanTrading
📅 26.DEC.2021
⚠️(DYOR)
❤️ If you apperciate my work , Please like and comment , It Keeps me motivated to do better ❤️

BTC.D Daily TA : 12.26.21 : $BTC.DAs you can see in the bitcoin's dominance chart at weekly timeframe , we see that the candle has reached an important support level, And if the price reacts positively, bitcoin is likely to grow in the short term, and if that support is lost but the bitcoin price starts to rise, there is also the possibility of a small party altcoin. Note that we are only examining the possibilities and that decreasing or increasing the bitcoin's dominance can have different effects on the price, and we have only considered one or two cases. For more information about Bitcoin's dominance and its effects on the price and market, you can Google it and get good information .
Follow our other analysis & Feel free to ask any questions you have, we are here to help.
⚠️ This Analysis will be updated ...
👤 Arman Shaban : @ArmanShabanTrading
📅 26.DEC.2021
⚠️(DYOR)
❤️ If you apperciate my work , Please like and comment , It Keeps me motivated to do better ❤️

MANA new price level and preparing for defenseMANA on the chart looks good, we see gradual growth and slight fluctuations, the main trend is clearly upward. The metaverse is the future and it is worth being patient

The Big Picture to $5.50Merry Christmas. Before Thanksgiving, we were talking about the path to $5.50 and I even potentially made fun of the "get rich quick" mentality that more often than not leaves people missing an opportunity. Patience and intestinal fortitude will reward you in this industry (and research). $5.50 continues to be my first larger target before an ATH. This is not financial advice, just an idea. I think this view is good for newcomers to see how it doesn't happen overnight, FOMO is your enemy, and most importantly that nothing goes straight up and down. Zig-zag up and down and all around. The next couple of channels (yellow and green) will lead to the completion of a Cup and Handle, bringing the price target of MANA into the $5.50 range. Remember, when this rally finally takes off, the FOMO people can potentially pump it up higher, before it corrects, consolidating in the $5.50 range as it prepares for an ATH against the upper trend line of the ascending channel (Red). Know that it is healthy when it comes back from $6+ all the way down to the $4.40 range. Again, just ideas and not financial advice. Good luck and always be prepared for what BTC dropping to $42k would look like on a MANA chart.

Start of an Impulse? #MANA #MANAUSD #DecentralandStart of an Impulse? #MANA #MANAUSD #Decentraland
This could be the start of an impulse wave.
Now we need a higher High but after this,
it could run and run and run.
Greetings from Hanover
Stefan Bode

manausdt Mana broke downtrend resistance in 6h TF
and its consolidation before huge leg up
this is a metaverse leader and will do crazy pump
but for now, BTC ranging so everything ranging
try to have some mana in this price.
targets on the chart and last tp for midterm
50% Tp1
30% tp2
20% final TP

Decentraland Crypto and its popular token, ManaDecentraland Crypto and its popular token, Mana
He has a good fanda, it's a metaverse and now he has a profit potential of up to + 60% .
teaching points :
- Price in the upper half of the Bollinger Band
- CCI indicator near +100
- Intersection of Mac line and signal and MacD line above signal
- MacD green histograms
- The downtrend line on the RSI indicator is breaking
- Price placement in the 51-day ascending channel
- Good price response to the uptrend channel floor
It is currently at a high price for its 51-day resistance, and if it can stabilize on it, it can take a long position. The targets ahead are marked.
The first target is 15% +
The second target is 59% +
As always: don't forget capital management + don't forget to manage risk to Reward.
Good luck .

MANA a project for the patientchart of MANA after the rapid rise looks good, price level defended and we continue a more stable chart, the most important thing is that the increase was not artificial, but healthy

CARDANO Daily TA : 12.24.21 : $ADA☑️ TP1 REACHED 🚀
☑️ Results so far : +23% 🔥
Last Analysis :
Examining the Cardano chart in daily timeframe , we see that the price has managed to break its first downward trend and is currently trading in the range of $1.35 . according to previous analysis, if you are considering appealing price levels for personal review , You have earned more than 13% so far . To continue the uptrend, closing above $ 1.42 is very important .
The next targets are $ 1.414, $ 1.558, $ 1.72, respectively ...
After that, we have to wait for the long-term downward trend to break , and long-term targets will be announced shortly after the break .
Follow our other analysis & Feel free to ask any questions you have, we are here to help.
⚠️ This Analysis will be updated ...
👤 Arman Shaban : @ArmanShabanTrading
📅 24.DEC.2021
⚠️(DYOR)
❤️ If you apperciate my work , Please like and comment , It Keeps me motivated to do better ❤️

ANTUSDT Daily TA : 12.24.21 : $ANT☑️ TP1 Reached 🔥
☑️ TP2 Reached 🔥🔥
☑️ TP3 Reached 🔥🔥🔥
☑️ Results so far : +110% ✅
Follow our other analysis & Feel free to ask any questions you have, we are here to help.
⚠️ This Analysis will be updated ...
👤 Arman Shaban : @ArmanShabanTrading
📅 24.DEC.2021
⚠️(DYOR)
❤️ If you apperciate my work , Please like and comment , It Keeps me motivated to do better ❤️

MANA strong breakout and attempt to maintain price levelMANA has been showing strong price positions and gradual growth for several days, such a healthy situation has translated into continued growth, the next few days will show if we will defend this level

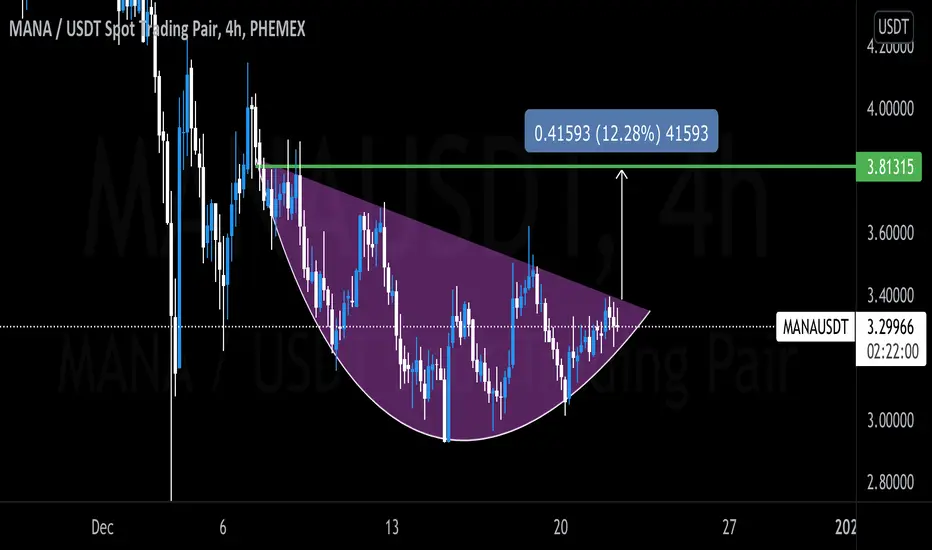
Mana bowl bottom breakout?$mana #Decentraland H4 break out of bowl rounded pattern and it will have a strong pull to 3.8.
I like to see these rounded bottoms slowly form because the base for support is obvious and entry/exits are easy to identify.
GALAUSDT Daily TA : 12.23.21 : $GALAAs we can see, the price is in an important range and recommended to keep an eye on it ... 😉
Follow our other analysis & Feel free to ask any questions you have, we are here to help.
⚠️ This Analysis will be updated ...
👤 Arman Shaban : @ArmanShabanTrading
📅 23.DEC.2021
⚠️(DYOR)
❤️ If you apperciate my work , Please like and comment , It Keeps me motivated to do better ❤️

MANA testing of support linesMANA is currently in a sideways trend with slight price fluctuations, the testing of support continues and no one knows how long it will last, we will see if there will be any dynamic movements by the end of this year

Another bull run ?AXS is potentially nice for a new bull run.
I'm investing in a new MetaVerse project called Meta Cars Land, check it if you're interested: metacarsland.com

2 of 3 bullishCurrently, I see the short-term ascending triangle (green) leading to the next step in a symmetrical triangle (red)...or just what was needed to create a H&S scenario (blue). A dip to $3 would confirm the H&S pattern, leading to a drop to mid-$2.40's. Hopefully, it will stay above $3.20 at least until it breaks $3.60, invalidating the H&S. It really depends on BTC. If BTC tests 42-44K again, MANA and everything else will tank...I think, because these are just ideas and not financial advice.

$DOGE Daily TA : Bull or Bear ?As we can see that the price is starting an upward trend, which is a condition for the continuation of this trend to break the important resistance of the range of 20 cents and stabilize above that Zone .If this resistance breaks, the next short-term targets will be 22 cents, 27 cents, 29 cents and 34 cents. The important support range is 15 to 17 cents.
Follow our other analysis & Feel free to ask any questions you have, we are here to help.
⚠️ This Analysis will be updated ...
👤 Arman Shaban : @ArmanShabanTrading
📅 22.DEC.2021
⚠️(DYOR)
❤️ If you apperciate my work , Please like and comment , It Keeps me motivated to do better ❤️

$ADA Daily TA : Bullish , isn't it ?Examining the Cardano chart in daily timeframe , we see that the price has managed to break its first downward trend and is currently trading in the range of $1.35 . according to previous analysis, if you are considering appealing price levels for personal review , You have earned more than 13% so far . To continue the uptrend, closing above $ 1.42 is very important .
The next targets are $ 1.414, $ 1.558, $ 1.72, respectively ...
After that, we have to wait for the long-term downward trend to break , and long-term targets will be announced shortly after the break .
Follow our other analysis & Feel free to ask any questions you have, we are here to help.
⚠️ This Analysis will be updated ...
👤 Arman Shaban : @ArmanShabanTrading
📅 22.DEC.2021
⚠️(DYOR)
❤️ If you apperciate my work , Please like and comment , It Keeps me motivated to do better ❤️

MANA incremental increaseMANA chart is calm but we see a gradual increase, it is not big but healthy and shows that we have strong support at these levels

$BTC Multi Time Frame Analysis (6H)Examining the Bitcoin chart in 6-hour timeframe, we see that the price has reached the ceiling of dynamic resistance and its volumetric resistance, and if this resistance is broken and the price stabilized above it, the targets will be $ 51600, $ 53000 and $ 57000, respectively. (This is an optimistic analysis of bitcoin, and if it comes true, its next targets has shown on the weekly chart)
Daily Analysis :
Weekly Analysis :
Follow our other analysis & Feel free to ask any questions you have, we are here to help.
⚠️ This Analysis will be updated ...
👤 Arman Shaban : @ArmanShabanTrading
📅 21.DEC.2021
⚠️(DYOR)
❤️ If you apperciate my work , Please like and comment , It Keeps me motivated to do better ❤️

BTC Multi Time Frame Analysis (Weekly)Well, let's start with the weekly bitcoin time frame analysis ... we see that today the price was successful to push itself above the 200-day moving average, and the closing of the high price of this moving average is very important for us and we must wait for the high price to stabilize. Because near these important zones , strange things may happen by whales or liquidity providers.
Follow our other analysis & Feel free to ask any questions you have, we are here to help.
⚠️ This Analysis will be updated ...
👤 Arman Shaban : @ArmanShabanTrading
📅 21.DEC.2021
⚠️(DYOR)
❤️ If you apperciate my work , Please like and comment , It Keeps me motivated to do better ❤️

MANA, PULLBACK CONFIRMED...!Good support area for Mana. Looking for a new pump for altcoins due to the Usdt.d downtrend...
Short-term target: 4.20
