Still Room To FallI've been looking across a lot of candlestick time frames and all signals are still showing signs of decline for Uber. I am up 40% on my position, will be holding another day. Will be holding until I believe we are near a low. I do not see this stock going up tomorrow.
Decline

XAUUSD - Going SouthI’m liquidating my short positions by Friday, Sept 25th. For next 2 weeks, I expect OANDA:XAUUSD have a further decline to 1,795-1,805. Think I need to open short positions around 1,873.
Cheers..

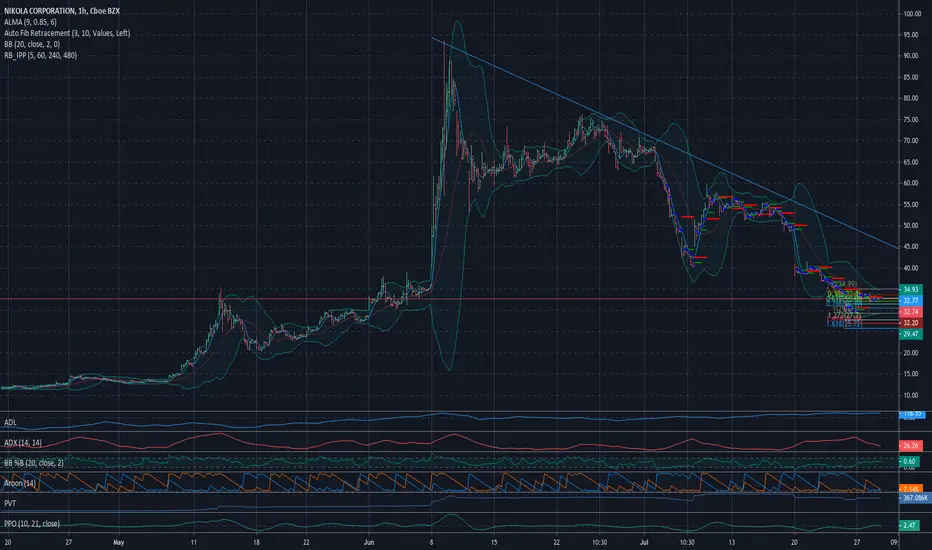
Decline Continuing: < $25 TargetRight now, I think Nikola's sentiment is still negative correlations and the 2023 plant isn't big enough news to dramatically effect its financials. I'm still keeping a close watch on it for potential retracement curves, but think support levels and brand equity still have ways to go. I expect with the current decline and previous correlation waves, this should dip to at least $25 if not lower quite soon. Currently, I'm in the short position. That being said, everything I say is on an opinion based basis. Please proceed with caution and do your own due diligence. Invest at your own risk.
Earnings Expected to Decline!!! (WLL)"-This oil and gas company is expected to post quarterly loss of $1.48 per share in its upcoming report, which represents a year-over-year change of -428.6%.
-Revenues are expected to be $153.65 million, down 64% from the year-ago quarter."


[$BTC] La sortie du biseau ascendant - Signal Baissier à CT Bonjour à tous,
J'espère que vous allez bien !
Comme évoqué dans video d'hier ( ), nous arrivions à une zone de forte résistance et les acheteurs n'ont pas tenu la pression , et on a assisté à une belle baisse (entre 5,83% pour le $BTC, 7,63% pour l'$ETH au moment où je vous parle)
Le $BTC est sorti du biseau ascendant, ce qui crée une mouvement baissier, à voir pour la continuité du mouvement.
En effet, si on regarde la Lagging Span, elle est en direction du bas du biseau mais pas encore traversé, à voir si on rebondi ( retest du prix ? sur le bas du canal pour confirmer le signal baissier).
Je revois mal une réintégration du biseau au vue des l'ensemble du mouvement du prix depuis un mois: nous avons réalisé les 5 vagues d'impulsion se terminant par un biseau ascendant.
Coté $ETH, on est arrivé pil poil au bas du biseau...
Maintenant c'est simple, soit on reste dedans , soit on casse et c'est parti pour les étapes de retest des différents supports !
Si vous avez shorté, bravo, j'espère que vous avez pris vos profits ou alléger si vous pensez à la une continuité baissière.
Stay safe :)
PEACE !

SPX -40% upcomingShort on SPX by the time it breaks the uptrend line all indicators pointing to recession

Possible bear flag on Ethereum chartEthereum was unable to break the current short-term downtrend.
A possible bear flag is forming.

AAPL Lower Volume RunAAPL had a steady decline in volume as it ran up to test the recent new all-time high. This may create a short-term sideways price action until more volume buyers or High Frequency Trader action triggers more volume to the upside.

MU Completing Long-Term BottomMU weekly chart shows a bottom completion underway for MU as it recovers from a 50% decline last year. The stock is showing some underlying momentum from large lot hidden activity.

I Think this year has a recessionWe had wave A. and then completed by wave b exact on 1.618 now. if this price shows a resistance, we can sell short for a sharp decline. for a better trade we should see Gann rules...

BE DowntrendBloom has been on a massive / fast paced run since October, however a clear downtrend is still present, and the success (breaking the downtrend) or failure of this bull flag, will determine if the stock rises or falls. An island top is also present with a clear price gap.

Bitcoin approaching 3rd retest to $7800Share your opinions, and don't forget to like and follow.
ABCD triangle on Coinbase:BTCUSD weekly chart first and second retest occurred within 105 days of each other, if history repeats itself Bitcoin appears to be 70 days away from a further decline to $7800
However, Coinbase:BTCUSD could make a break to the upside testing HUGE Resistance at $9,500


Oil range bound and possible decline Crude oil looks range bound at the current moment with a break of the wedge up or down indicating a nice sell or buy opportunity.
I remain bearish and am selling at the top of the wedge. Expecting to see below 50 by year end

A new decline for Aud/UsdA new decline is expected for Aud/Usd, in fact in the last sessions the price stabilized between 78.6% and 100% of the Fibonacci retracement. Speaking about the price it was between the support at 0.675 and the resistance at 0.705. Throughout the summer it should continue to lateralize in this channel as, fundamentally, both the Australian central bank and the FED will not distort their monetary policies.
At this time, however, investors and analysts are expecting a slight change from Powell. He should cut rates in the July meeting: the market has already discounted this news, causing a retracement of dollar against the other majors. For now we expect a maintenance of this level, with the dollar that should find the necessary strength to reach the main short-term supports against other currencies. Technically, on this pair the price should go back to testing the static support at 0.675. This before the monthly closing in June.

Month-End Continuation & MoreSame idea as in previous chart.
This is zoomed in to show the main points of resistance. 2 areas of concern with rising wedge in these recent times and stretched RSI. Very likely turnaround point in the next week or so. If it breaks past the fib line, then there will assuredly be snubbing right at the resistance line set by the previous peaks.
The overall trend aims downward still just with greater range for volatility. The broad chart shows areas of potential bounce from the long term trends set from the previous 10-20 years. Intruding beneath these points will violate extremely long term sets of support. 2 are depicted here from the 'line 1' and 'line 2'.
I'm making a "why not" prediction as far as the timing with the green line I'd crudely drawn in our future. Seems as though that historically, the steeper climbs give steeper falls, and the more gradual inclines will mirror a gradual descent. We are in an era of just the opposite. Short periods of time with rapid ascent. So, I'd imagine just the same with the coming down from our highest high at nearly 27,000 pts for the DJI.
Though I have no crystal ball, and I could be painfully wrong, this seems passable to me. Consumers still have the power to extend themselves for longer than we can predict, and the mere culture of my country can exhaust every bit of leverage capacity in ways not seen before. It very well could be that we climb out of these slows and right up past the highs to reclaim new territory and keep this sick machine turning for another half-decade, and I would be equally unsurprised, but I have no doubt that what we are doing now has incredible consequences.

Short-term Short for BTCA short-term decline pattern is partially formed with lower high of price and higher high of RSI. Still need comfirmation from Composite Index and Aroon indicator.
If the price do not go straight up continuously, say, up to 4200, the decline is due to happen.
5% decline is 3700 and 10% is around 3615.

Tencent: short-term short, long-term longTencent: short-term short, long-term long
Based on what have I observed for the past few months, tencent's price is on a short-term bearish trend caused both by its under-expected earning on online games, China's regulation on online game industry overall, as well as the elephant in the room, trade war.
Short term wise, RSI negative reversals are coming on by on. Currently the price may go down to 291, which is the 0.618 retracement level since December, 2016, a two year term fibonacci retracement. But the RSI reversal indicates that it may go even lower to 274.
But long term speaking, AD Line is trending upwards even the price keep going lower since March 2018, for the past 5 months. That is to say, 274-291 could be a crucial range for us to predict what may happen next.

BCH/USD ShortBCH is forming an ascending broadening wedge and can break down anytime
To catch this trade we have 2 possibilities
1) We get confirmation that the pattern is a valid one once support trend is broken and we can place a short order
2) We retrace to one of the horizontal support levels and get a rejection, this would imply a partial decline and we can place a short order
TP as mentioned in the graph

BCH/USD LongBCH is forming a descending broadening wedge
We have to wait for a close above resistance trend line to place a buy order
Though i expect a rejection here followed by the formation of a partial decline which would be even more interesting to buy since partial declines predict the breakout direction (upward) and works 79% of the time
TP as shown in the graph

BTC/USD LONGI see descending broadening wedge on BTC and it might be forming the partial decline which would trigger a long position
We have to wait for reversal candle in the buy zone
TP as mentioned in the graph
