EURJPY will be falling from the sky at the price 125,000!!!!Analyzing Elliot waves, trends, confluences of harmonic patterns, areas of strong fibonacci retracements, in addition to the zones of strong resistance, pivot zones, as a bonus, the fibonacci fan indicates that retreat at that point.
SUPER ENTRY POINT! DO NOT LET IT LOSE!
Deep Crab

ES1! Bearish Deep CrabBearish Deep Crab(red) with Potential Reversal Zone(PRZ).. long-term 2.618 fib extension(3077) from 666 low should act as support.. so staying long here and looking to cover and go short within Blue range.

EURUSD OVERVIEWEurusd looking pretty much read for a drop, price approaching D legs of the bearish shark and deep crab which alighs perfectly with a supply base from history and as well liquidity pool being taken out. Here's my point of view, let me know what you think in the comment session.

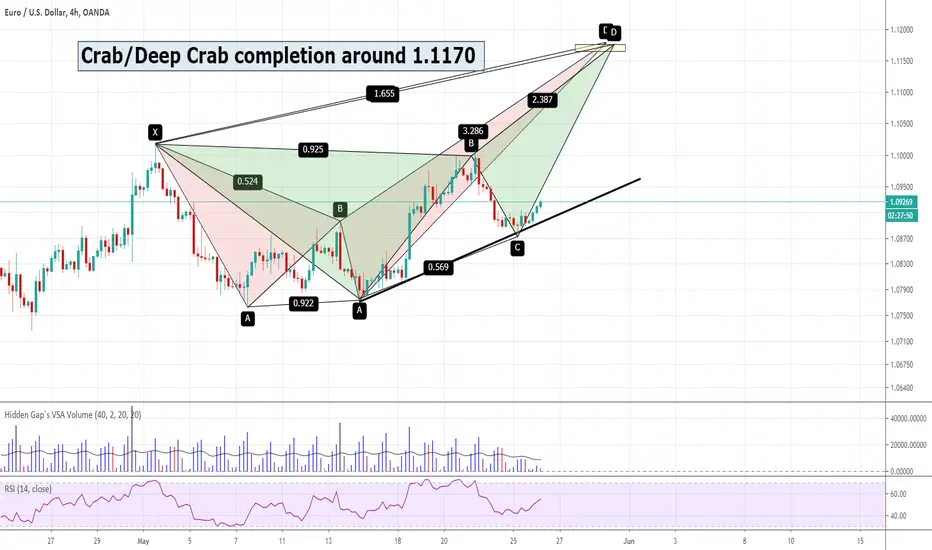
Crab/Deep Crab completion around 1.1170I see a deep crab and crab formation on EURUSD.
This suggest that EURUSD could go higher this week after hitting target 1 on last week's bat pattern.
This move can bring EURUSD to 1.1160-1.1170.
We can be patient and wait to short or go long on this C-D move.
According to crab pattern rules, SL has to go above XA 2.0
Targets will be AD 382 and 618.
EURAUD OverviewPrice currently in a downtrend on the lower tf and approaching an OB, alongside a shark pattern was spotted which perfectly congruent with the institutional candle just right below liquidity pool created. going to the 30 mins tf, a deep crab was also stotted which also aligns perfectly with the PRZ. check comment below for the lower tf analysis.

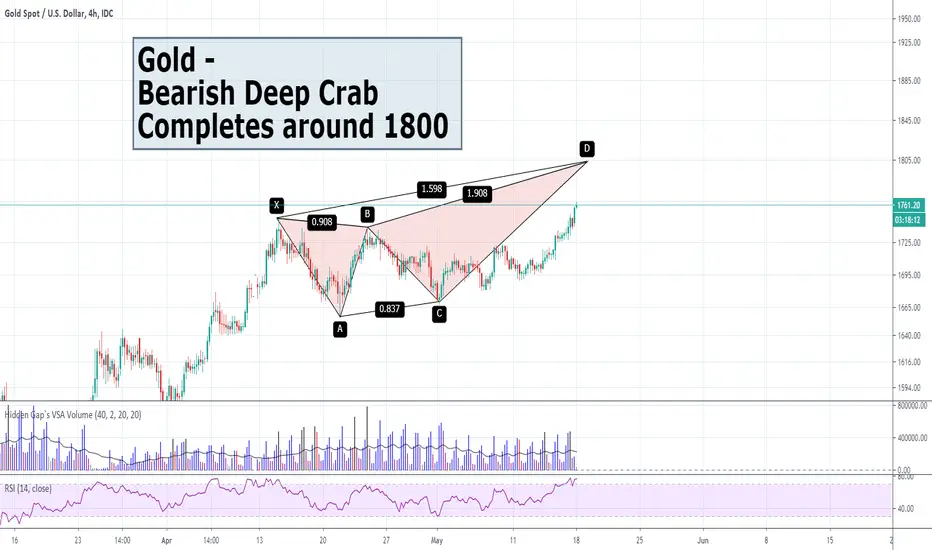
Gold - Bearish Deep Crab completes around 1800Gold looks poised to rise further to complete a deep crab pattern around 1800.
When the pattern completes, we need to wait for reversal candlestick patterns or a break of support trend lines before getting on board.
For deep crab patterns, SL has to go above XA 2.0.
Profit targets will be 382 and 618 retracement of AD leg.
Good luck and good trading everyone!
Trade Ideas Educator: NZDUSD CrabThe bullish crab pattern has gone past the PRZ level. Right now there is an up arrow all that is needed is a bullish candle confirmation for a buying opportunity.
Personally, since it has past the PRZ area, I would rather to wait for candle confirmation at the HOP level.

GBPUSD-Weekly Market Analysis-May20,Wk3In this sharp drop in UK Pound, you can either wait for a retest back into the red box to short or consolidation at the HOP level for a buying opportunity on this deep crab setup.
I will need the pink arrow pointing up to appear in order to do that, in addition, a bullish reversal at the HOP level.


FDN (DJ Internet Index) Double Bearish Patterns evolving.....In the Covid-19 fell March/April selloff this index fell approx 32%.
It has regained just about 88% of this range and created a Bearish Bat Pattern.
One can overlay this with a Deep Crab Pattern which started on March 10th and signalled today.
The Deep Crab Pattern typically can have an extention which exceeds 1.618 and can reach as far
as 1.94x so this would target $156.57 area max.
So two bearish formations could lead to rapid sell off if some of the main internet sector leaders fail or
the general market hits an air pocket.
This is a 180 minute chart so price action could evolve quite rapidly
S.


DEEP CRAB - DAX30 - 15mPossibility of short term corrective swing from possible PRZ at the completion of Deep Crab on 15 minute chart.
PRZ = 10584.7 - 10600.7
1.618XA = 10596.2
2.618BC = 10584.7
1.272ABC = 10600.7

GOLD: BAMM-tradePotential emerging deep crab pattern setting up on the chart. Hidden bullish divergence can be spotted with the RSI. On the shorter timeframes, the RSI is showing regular bullish divergences.
We have some demand coming in around 1670, which is a 88.6% ret. of last week candle, and 127.2% ext. of yesterdays candle. Support is located at 1660. Below this level the deep crab pattern is invalidated.
Good luck to all trading gold !!

DEEP CRAB Developing - GBPCADPRZ = 1.69216 - 1.68527
1.618XA = 1.68527
3.618BC = 1.68605
1.618ABC = 1.69216
Happy Trading
GG

DEEP CRAB - NZDUSD - In DevelopmentNZD USD 1H TF
Pattern in Development
=======================
Deep Crab is developing on 1H TF. Watch price action in projected PRZ. Possible Short.
PRZ = 0.62041 - 0.62096
1.618XA = 0.62041
2.618BC = 0.62096
1.272ABC = 0.62021
Happy Trading!
GG

EURUSD - 15m - A scalp bounce of 1.0800 handle and Deep Crab PRZLooks like a mini deep crab like pattern on 15m which could give more support to 1.0800 handle bounce and scalp opportunity for 30-50 pips.
Expecting price to continue lower in the intermediate term, though. So, personally may not be inclined to take this particular trade.

NZDUSD H1 trend continuationJust spotted multiple confluences for the bullish trend continuation on this pair. Price filling up an Imbalance and completion if these bullish harmonic patterns as specified on the chart.

GBPUSD OVERVIEWPrice approaching an OB (h4). Coming down to the 30 minutes time frame, a deep crab pattern is projected aligning perfectly with the 50% of h4 OB. Expecting price to drop from that zone filling up Imbalance, creating a higher low and continue the initial uptrend.

Trade Ideas Position: GBPUSD CrabA bullish deep crab pattern setup and went into consolidation after the HOP level.
Would you see this as a fail deep crab?
The deep crab pattern is still valid, watch closely.
The HSI arrow shows a potential entry for a check back, no doubt the candle has a lower price, but it didn't break and close below the candle that has HSI candle.

Pound/ Dollar ***This is an online journal entry.***. As previous entries on my profile i am still learning how to be a Harmonic Trader. I am not a big fan of the crab patterns as they extend quite a bit past the XA leg. Originaly when i started trading patterns I admit i ignored the importance of the AB=CD. But, after reading the Books written by Scott Carney the back bone of all the patterns is the AB=CD. So, now I look for the AB=CD patterns first and then add the "X" leg after I caluculate the AB=CD pattern.
Here, we have a Deep Crab Pattern on GU. Today is Terminal Bar Day. So, Next week (around wednesday or thursday) if price starts to move sideways next week and does not blow through the PRZ then we have a nice trade.
As with most Harmonic Patterns the TP Targets are based off the CD leg and its the 382 and 50.
***CAUTION*** THIS IS A COUNTER TREND TRADE SO TARGETING A .382 IS TARGET 1 AND (STRICTLY PERSONAL PREFERENCE) 618 IS T2. BREAKEVEN IS WHEN PRICE TOUCHES THE 382.

Deep crab pattern LINK/BTCWatch price action at completion of the pattern. if reversal pattern forms at completion . SHORT

Possible Deep Crab LINK/BTCWatch price action at completion of the pattern. if reversal pattern forms at completion . SHORT!

Trade Ideas Position: GBPUSD BatA bearish bat set up for a trend trading trade. Trade has already engaged, a break and close below the trendline will give strength to the downwards movement. The level completes with a bearish deep crab pattern as well and having a market consolidation.
