AUDCAD T2 Achieved: Now Short at Bearish Deep CrabAUDCAD has achieved T2 of the bullish crab idea that I recently published (see below) and has now completed a bearish deep crab pattern. The PA has respected the 1.618 projection of xa and it is time to look for a short entry.
Confluence in the PRZ:
1. Bearish Deep Crab Completion
2. Weekly Pivot
3. September, 2015 Pivot
4. .618CD (Bullish Crab Target)
5. 1.5ab=cd; upper limit
6. 1.41ab=cd; lower limit
Target set at confluence between .618cd and the new weekly pivot.
Bullish Crab Idea:
Deep Crab
MSFT Short: Harmonic Confluence in Triple 3 CorrectionMSFT is consolidating after bearish price action in what appears to be a sideways combination corrective pattern. Regardless of EW count, there are multiple congruent harmonic patterns that if completed will be met with significant trendline resistance, helping to drive price down. List of confluence in PRZ is listed below.
PRZ Confluence:
1. Two Bearish Butterflies
2. Bearish Crab
3. 1.13ab=cd (Reciprocal of .886 c point, Green)
4. 2ab=cd (Blue)
5. Bearish Deep Crab
6. .707 & .786 Wave 3 Levels
7. Two Structural S/R Levels
8. Trend line Resistance
TRADE: GBPUSD: BUY@1.52522 Completed Bullish Deep Crab + ChannelThis pair has been trading in a descending channel for the past few days and still has some more downside to go. But for now, there is a COMPLETED bullish deep crab pattern with it's PRZ down by the bottom of the channel. Within this trading channel, I have marked out its' ABCDE points and this crab is near the C point of the channel. Buying at 1.52522 would be in the PRZ of this crab and confluence with the bottom of the channel. Projecting that this point would only be Point C, the odds are good that prices will head back up into the top of the channel and form Point D and then descend back down again.
MY TRADE PLAN
I will take a LONG position ONLY if prices do get to the bottom of the channel whcih would be testing the PRZ of this deep crab.
*DISCLAIMER:
Please keep in mind that I am not giving any trading signals or trade calls here. Only providing my own trade thoughts for your benefit and insight as to my trading technique and style. Please don't ask if you should or should not take the trade or ask for stop loss and take profit levels. Any SL or TP given on my trades are my own I have used for my trade and are not recommendations for you to use. If you are not sure, then you do not have a trading plan for yourself in place. I suggest you make one before you continue to do any trading!
If you like my posts and find them helpful, please take a second to hit that LIKE button and follow me so I will know my posts are useful to you. Doing so will encourage me to post more! As always, all constructive comments are welcome. Agree or disagree.
UPDATE #1: EURUSD: All Roads Lead to Wave 3. Added Deep CrabIn my last post on this pair (see Related Ideas: " ANALYSIS: EURUSD: All Roads Lead To A Wave 3"), I identified a bullish Gartley and a bearish butterfly patterns. In this update, I have removed the bullish Gartley as I do not think it is relevant anymore although it is STILL valid. But as per my possible updated wave count, I don't see prices heading any lower to complete that Gartley. That's why I have removed it. So what you see here is that I have added a POTENTIAL Bearish Deep Crab pattern that will end nearby the bearish butterfly completion as well.
Be careful not to get over-enthusiastic on any trade because this pair is in consolidation mode and therefore prices will swing back and forth. This is what my possible wave count shows. Before either of these 2 patterns will complete, we should see this swinging PA in the form of a smaller contracting triangle before breaking out to the upside to head towards the upper trend line of the larger contracting triangle and the pattern completions.
What's important to keep in mind always is the bigger picture. All this PA is happening within the larger contracting triangle pattern consolidation on the DAILY TF.
Currently, I am LONG and have been holding LONG positions on this pair for weeks now. Although this pair is showing signs of moving upwards within the contracting triangle consolidation (DAILY TF), I am not adding anymore LONGS as I don't need to. But having said that, this is a good place to get LONG if you want to because prices are near the bottom of the larger contracting triangle and showing signs of moving upwards. Also, I do not see any breakout to the downside happening. That's NOT to say it can't happen. Anything can happen.
*DISCLAIMER:
Please keep in mind that I am not giving any trading signals or trade calls here. Only providing my own trade thoughts for your benefit and insight as to my trading technique and style. Please don't ask if you should or should not take the trade. If you are not sure, then you do not have a trading plan for yourself in place. I suggest you make one before you continue to do any trading!
If you like my posts and find them helpful, please take a second to hit that LIKE button and follow me so I will know my posts are useful to you. Doing so will encourage me to post more! As always, all comments are welcome.
USDCHF: Not 1 But TWO Potential Bullish Cyphers + Deep CrabYes, it's pick-your-cypher time. This pair has been on a steady upwards move for a while now and it's time for some relief in the form of a retrace. So these two cyphers may provide that relief before it resumes it's upwards march.
If that isn't enough patterns to sway you to SHORT this pair, throw in a POTENTIAL bullish deep crab that ends arond the same level as one of the cyphers and you start to get the makings of a nice zone to again go LONG if/when prices get there. Oh, and there is a minor SR structure zone around that area as well.
Good pips to be made if you want to follow the CD legs down. But keep the bigger picture in mind when going SHORT on this pair, I'm still BULLISH until further notice.
MY TRADING PLAN
I am already in SHORT for a retrace back down. I will look to get LONG again upon the completion of the lower cypher (pink) and deep crab. I'll exit my SHORTS before then when prices reach the BAMM line of the BAT on the DAILY TF as that is also a MAJOR SR Structure. There's a 140+ pips to be made just with that move. I don't need to take the risk that the patterns won't get filled and that prices will hit structure and reverse back up to continue it's up trend. Remember, this pair is in a STRONG uptrend still so any down move is another chance to get LONG.
AUDUSD Long - Bullish Deep Crab and Monthly Trendline Support D1AUDUSD is at a significant zone as the Daily candles have just wicked on to the Monthly support line. Now a trendline does not always hold or fall on a first touch. But in support of a swift reversal, we have a possible harmonic pattern completion - a 'Bullish Deep Crab,' right around the price-contact-point of the monthly trendline support.
So this presents a nice ratio confluence zone as well as a strong trendline support, in favor of a possible reversal of the currently bearish trend.
This is a counter bias trade, hence must have a tight stoploss. The positions are to be managed aggressively. when price reaches the first target which is trendline resistance (descending target), if the trade is in profit, SL to be set at breakeven, else the trade is to be closed at whatever loss.
CA potential Crab and Deep Crab PatternsSL at 188,6% Fibo of XA legs
TP1 at 38,2% Fibo of Crabs CD leg confirmed by previous structures
TP2 Area at around 61,8% Fibo confirmed by previous structures
If the Hidden Divergence is complete we may see a continuation of this downtrend
Right now the Bat Pattern is still valid
It's early, markets change, but this is on my watchlist ;)
USDCHF - POTENTIAL Bull Deep Crab Nearing CompletionThis bullish deep crab pattern is near to complete. Be on the watch for it.. When it does, I will look to open LONG positions on this pair. In addition, the RSI is now already in oversold condition and upon the crab completing, should still be so.
Also, bear in mind my long-term outlook on this pair. See Related Ideas for that analysis.
UPDATE: ALERT! GBPUSD Bullish Deep Crab ***INVALID***UPDATE #2: Prices have now reversed and closed past my PRZ. Therefore, I have closed this trade and will now sit back and see what happens next. I have posted and alternate scenario for what I think will happen if this bearish crab were not to hold. I will now look to that scenario and see what develops after the weekend.
UPDATE: the NFP did cause prices to dip below the PRZ BUT failed to close below it. So the trade and the pattern is still valid. If you got stopped out and did not get back in the trade when prices failed to close below the PRZ, unless you got back in close to the PRZ, I would not suggest to chase the trade. You can put a buy limit order at the D point and wait and see if prices move back down enough to get you in but if prices continue higher towards Target 1, I don't suggest to chase it. Wait till prices hit target 1 and wait for a retrace before attempting to buy for target 2.
As I mentioned in my earlier post on this deep crab completion, I was waiting for prices to penetrate deeper into the PRZ before taking a trade because it is common for that to happen with extension patterns like crab, butterflys and sharks. I was looking for a candlestick reversal formation to give me a sign to take a trade and to reduce my risk on this trade. I got just that with an inside candle and a break of that inside candle to the upside.
I took the trade @1.56000 on the break of the inside candle on the 1-hour chart. In addition, a pin bar is forming on the 4-hour chart but of course, that bar has not yet closed as a pin yet as of this posting. If you have not yet taken this trade, I would wait until the pin bar on the 4-hour time frame closes as a pin and take the trade from there. If you are an aggressive trader, you can take the trade now while prices are still within the PRZ.
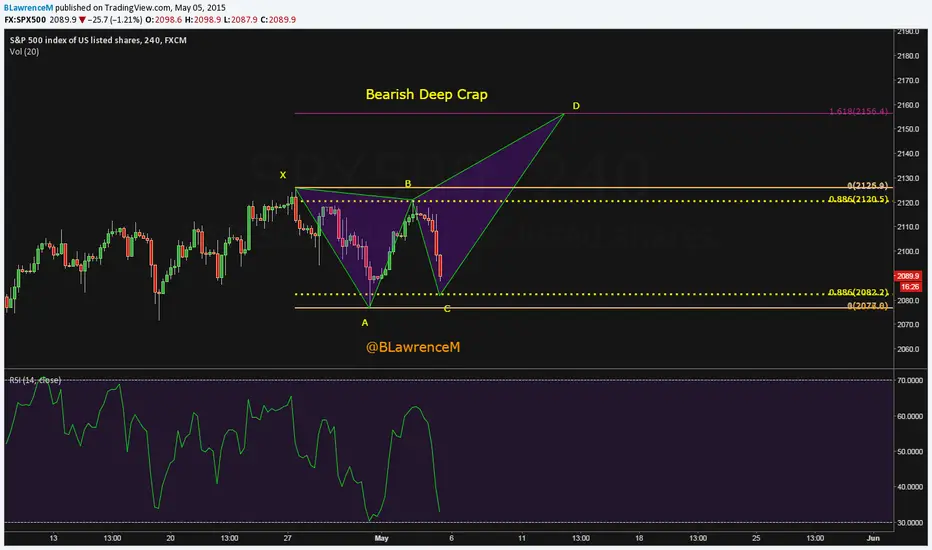
Running Out of Time - The Bullish Argument for the SPA Bearish Deep Crap
Could be in spe. BUT so far highly speculative.
Conditions: A flush tomorrow for the 88,6 retrace of the X to A-leg (2082 handle) no more no less.
This could suck in bears and create a bear trap. It has to be the 88.6 retrace... (A must)
Then we have to see a hard reversal for creating a short squeeze that could propel the D leg up for a BLOW off top
Clues to support this possibility:
We have B-leg retracing 88.6 of the X to A-leg.
If we get the C-leg retracing 88,6 of the X to A-leg ... the setup for the 1.618 extension is then ready to pan out.
RSI is a its low so could turn up after a flush
Fear not ...believe in what you see
@BLawrenceM
Music at work:
www.youtube.com
open.spotify.com