Grab 110 PIPS on this Deep CrabLike and Follow to support more analysis.
For accurate entries like this, send me a DM
Deep Crab


NZDUSD - Bearish Deep CrabCompared to his siblings, NZDJPY, NZDUSD has a better setup. Both having bearish bat pattern o the daily chart, both having bearish engulfing with a pink arrow on the 1-hourly chart but only NZDUSD has a bearish deep crab setup. Pending Order place for his trade and let's see how this trade turns out.

FCPO - Entering Supply Zone AgainFCPO now is entering the supply zone once again after climbed more 1000 points after rebounded on May 2020. This zone has been visited 3 times in late 2016, beginning of 2020 and here in present.
A V-Shape accompanied with a bearish harmonic deep crab may witness the upward trend could be stalling. Price action plays the crucial role to determine the price will be rejecting in the supply area.
A short opportunity if price reject in the potential reversal zone (Light Blue Box), may give a potential 1st target to visit 2596 area with a stop of 3233
Eagerly awaiting for this potential event.

DAX 30 - BEARISH BAT & DEEP CRAB Patterns - 15mThis idea builds on previous idea, where BAT pattern was identified.
On a second pass at an idea, noticed that within BAT there was a DEEP CRAB pattern.
So posting two together here.
Good trading,
Gekko

AUDUSD 15mTrade No. #04
''SELL MARKET ORDER''
Reasons for entering:
bearish deep crab/butterfly
bearish divergence
evening star/abandoned baby
Target: 0.733
Stop: 0.737

FCPO - Bearish Deep CrabFCPO price broke out of ranging between 2475 - 2294 & formed a bearish harmonic pattern in the TF H1. By observing the higher TF chart, the current price which is overvalued indicated by the relative strength oscillator. Potential short term reversal might happen soon.
In order for the price to respect the pattern, the stop level shall be test & might overstretch it before going back into the permitted entry zone (Blue Box). Pay attention to the price action for trade execution.
Stops : 2567 (slightly higher would be better)
PRZ : 2554 - 2506 (Blue Box)
TP1 : 2454
TP2 : 2393

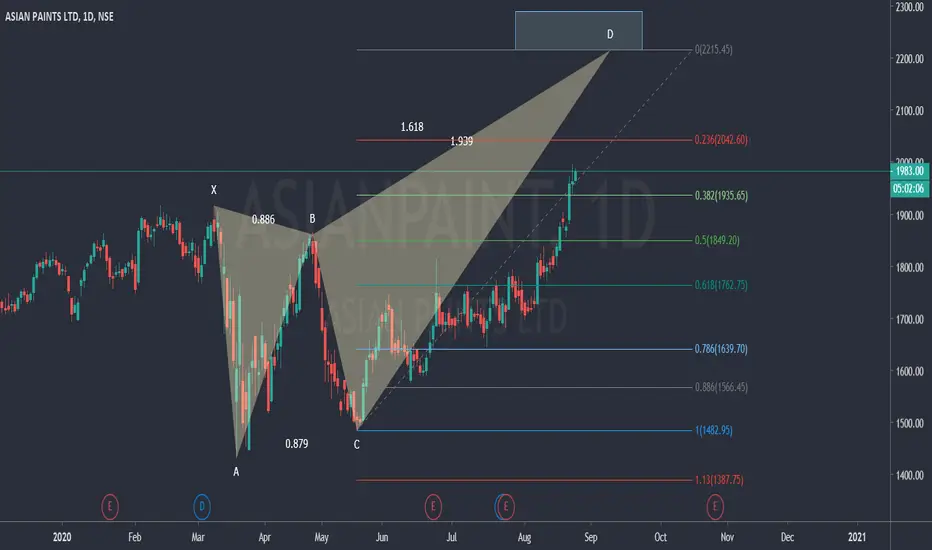
Bearish Deep Crab under formation in ASIANPAINT in Daily.Hello,
Bearish Deep Crab under formation in ASIANPAINT in Daily time frame.
Noted: This chart is only for study and reference purpose only.
Perfect automated detection of DeepCrab pattern - LongEntry 0.91600, T/P 0.92500, S/L 0.90700.
Day trade.

GBPUSD - 1902 Deep CrabGBPUSD completed a 1902 Deep crab, it looks poised to fall.
It also hit a critical channel resistance.
SL should go above XA 2.0 + 1ATR.
TP will be 38.2 and 61.8 of AD leg.
Good luck and good trading!

NAS Crab Is Trying to Rise to Next Golden Level the detail is shown on the above Idea.
this Idea is in Continuation of my Confirmed Previous Idea.
in the previous Idea, Nas bearish is done to lower the golden level and after retracement of golden level Nas is Flying to the upper golden level.
Dear Friends Leave us a comment or like to keep my content for free and alive.
God Bless you and your Parent.


Perfect automated detection of DeepCrab patterns - shortAlthough it tried to reach the high price of 1.330 several times from September 2018, it did not break out and fell thereafter.
This time too, it will be Short if it falls below 1.31 (T/P around 1.28, S/L 1.33).
Conversely, if it breaks above 1.34, it changes to Long.

#XRP/USD deep bearish crabBITFINEX:XRPUSD is making a deep bearish crab. Maybe a last push before a dump. Let's see.


GBPUSD.... Looking for a Bearish Wolfe Wave ReversalNice Wolfe Wave setup .... break of point 3 should confirm. (approx 1,2670)
This could go higher (1.28+) so watch closely
Target is 1.2450 by early August
On a shorter term basis a bearish deep crab pattern has developed
S.

Potential Deep Crab on the pound @ 1.2780GBPUSD looks to be continuing its ascend towards new monthly highs.
A small bullish has just completed on the 15min chart with potential stretch targets around 1.2780.
A big bearish deep crab will complete around this price.
Short term, I will be looking for potential buys at good support.
Mid to long term, I will be looking to short when the big crab completes.
Good luck and good trading!

AUDCAD - Bearish Deep Crab Type2Range Bar chart is what I've been looking for some time, you have to know how to filter which setup could be traded.
Let's see how this trade setup is going.


AMZN completion of Bearish Deep CrabPRZ in blue.. AMZN sold off at end as completion of 2.0 ABA second PRZ calc.. with no higher high AMZN is in take profits mode to first target 38 fib in green..

GBPJPY - Bullish Deep CrabA counter-trend trading opportunity on GBPJPY for a buying opportunity. I'd engage this trade. The first target fall withing the sell zone of this timeframe.
Let's see how this trade rolls out.
