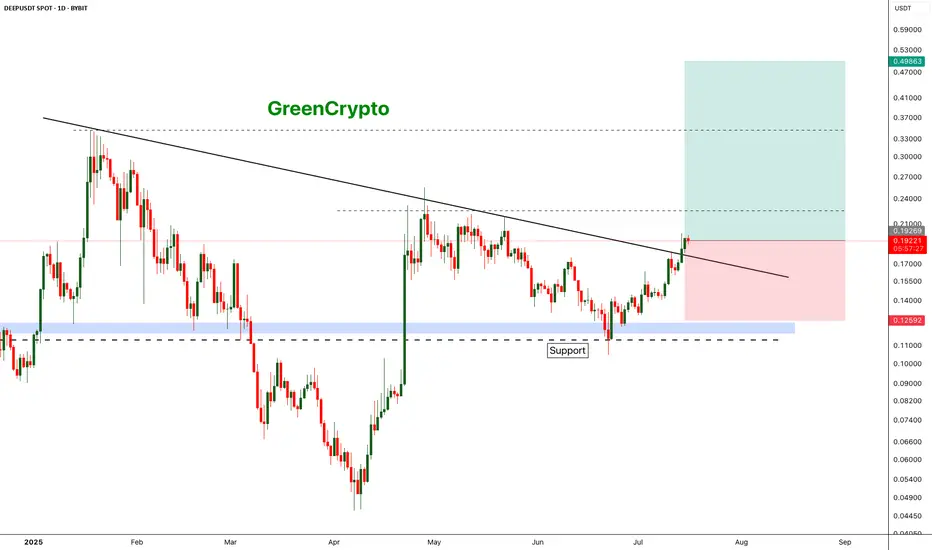
DEEP is deep Bullish DEEP has broken out from the resistance trend line and headed towards the next resistance around 0.22
We have good opportunity for a long trade here
Entry Price: 0.19219
Stop Loss: 0.12592
TP1: 0.22558
TP2: 0.27615
TP3: 0.34703
TP4: 0.49342
Don't forget to keep stop loss
Cheers
GreenCrypto
DEEPUSDT
Breakout Alert: $DEEP Aiming for 80%+ If Resistance Flips$DEEP/USDT just broke out of a clean downtrend line and is now approaching a strong resistance zone around $0.22.
Momentum looks solid, and the breakout is backed by strong bullish candles.
If price can flip this zone into support, we might see a potential 80%+ move toward the $0.34–$0.35 region.
DYOR, NFA

DEEPUSDT Set to Skyrocket? Bullish Breakout from Falling Wedge
🧠 In-Depth Technical Analysis – 1D Timeframe
DEEPUSDT has just flashed one of the most powerful bullish signals in technical analysis — a confirmed breakout from a Falling Wedge pattern. This wedge has been forming over 4+ months (February to June 2025), suggesting long-term accumulation before a potential explosive rally.
A falling wedge is a classic bullish reversal pattern, where selling pressure diminishes over time, leading to a breakout fueled by renewed buying momentum — and that’s exactly what’s unfolding now.
📈 Bullish Scenario – Step-by-Step Upside Targets:
1. Confirmed Breakout
The descending trendline has been broken with a strong bullish candle and rising volume, indicating a possible trend reversal and start of a new bullish phase.
2. Fibonacci Extension Levels as Price Targets:
🎯 0.17260 – Initial resistance, serves as a key breakout retest zone.
💛 0.20910 (0.5 Fib) – First mid-range psychological target.
💛 0.23354 (0.618 Fib) – Crucial level to confirm bullish continuation.
⭐ 0.30209 – 0.31263 (1.0 Fib) – Primary take-profit target.
🔵 0.44059 (1.618 Fib) – Extended target if momentum remains strong.
🔴 0.64765 – 0.85470 (2.618 – 3.618 Fib) – Long-term targets in case of a parabolic altseason-like move.
3. Positive Market Structure:
Higher lows are forming, indicating a potential early-stage trend reversal. This structure is often seen at the beginning of major altcoin rallies.
⚠️ Bearish Scenario – Risks to Monitor:
1. Fakeout Risk:
If the price falls back below the wedge and loses the 0.14511 level, the breakout may turn into a bull trap.
2. Rejection at Key Fibonacci Levels:
Failure to break and hold above the 0.209 – 0.233 zone could trigger profit-taking and a retracement to 0.12000 or even 0.10000.
3. Failed Retest of Breakout:
If the price cannot successfully retest the wedge breakout zone, the bullish thesis may get invalidated.
🧩 Pattern Summary:
Pattern: Falling Wedge (Bullish Reversal)
Status: Breakout Confirmed
Potential Upside: Up to 0.85 USDT (Fib 3.618)
Key Support: 0.14511 & 0.12000
Bullish Confirmation Levels: Holding above 0.173 and breaking 0.233
#DEEPUSDT #CryptoBreakout #FallingWedge #BullishReversal #TechnicalAnalysis #AltcoinSetup #CryptoTrading #CryptoSignal #VolumeBreakout #AltseasonReady #DeepCryptoAnalysis

DEEP 2H AnalysisHey traders! 👋
I’m watching a potential Wave 3 impulsive move forming on DEEP/USDT that could present a strong bullish opportunity. Let’s break it down 👇
🔹 Structure Overview:
We’ve completed a five-wave impulse upward (Wave 1 ✅), followed by an irregular corrective Wave 2 (ABC correction). This setup opens the door for a classic Elliott Wave 3, which tends to be the strongest leg in the sequence.
🟩 Entry Zone: 0.195 – 0.205
🎯 TP: 0.256
🛑 SL: 0.182
⚖️ Risk/Reward Ratio: 1:3
📌 Remember:
Take care of your risk and money management. Always size your positions according to your plan.
💬 What do you think? Does this count look solid to you, or are you seeing a different wave scenario? Drop your thoughts below ⬇️

Breaking: DeepBook Protocol ($DEEP) Surged 28% Amid Bullish FlagThe price DeepBook Protocol ( AMEX:DEEP ) token saw a notable uptick of 28% today amidst breaking out of a bullish flag pattern.
Built on the Sui blockchain, AMEX:DEEP coin has been on a bullish streak for the past 7 days with an uptick of 213.26% in 24 hours trading volume today. Similarly, the asset's market cap has risen 21.41% to reclaim the $700 million market cap.
As of the time of writing, AMEX:DEEP coin is up 6.23% trading within a bullish flag pattern. This altcoin has already broken the ceiling of the flag gearing for 80% surge.
About DeepBook Protocol
DeepBook is a decentralized central limit order book (CLOB) built on Sui. DeepBook leverages Sui's parallel execution and low transaction fees to bring a highly performant, low-latency exchange on chain. DeepBook’s main competitive edge is that it is fully on-chain.
DeepBook Protocol Price Data
The DeepBook Protocol price today is $0.234722 USD with a 24-hour trading volume of $465,843,629 USD. DeepBook Protocol is up 24.02% in the last 24 hours. The current CoinMarketCap ranking is #94, with a market cap of $717,779,555 USD. It has a circulating supply of 3,058,000,000 DEEP coins and a max. supply of 10,000,000,000 DEEP coins.

Trading opportunity for DEEPUSDTBased on technical factors there is a Buy position in :
📊 DEEPUSDT
🔵 Buy Now
🪫Stop loss 0.065
🔋Target 0.116
📏 R/R 2
💸RISK : 1%
We hope it is profitable for you ❤️
Please support our activity with your likes👍 and comments📝

$DEEP - SUI EcosystemSorry I accidently posted this chart as "private"
buying this in the green box is a safe bet, just putting it out there for the records guys!
We got the sweep of the lows!
Targets = obviously price discovery, totally depending upon SUI's strength!
PS. I've missed it at $0.04 (limits were set but never hit during November-Dec, 2024 = where the symmetrical triangle is at) and couldn't get the full bids in that green box either!!!

Long I use two time frames and momentum indicators to identify the timing of the entry.
Daily stochastic had reset and started to move to the upside. Stochastic in the higher time frame is a signal for me it is time to start looking for an entry in a direction of the indicator in the lower time frame.
I use MACD in the lower time frame. 4H MACD have crossed, is sloping upwards and now entering the bull zone. It is a good place for me to enter long.
I don’t trade with leverage. I buy spot.
The way I take profit is when 4H/Daily MACD or RSI is going to form a clear negative divergence.

DEEP in the Game: Perfect Long Setup UnfoldingDEEP has recently shown an impressive move, surging by +65% in just one day. This is a strong sign of momentum, but now we are at an interesting stage, with price ranging within certain key levels.
Key Price Levels:
1.) Resistance at $0.276255 (Weekly Level & Fib 0.618):
DEEP has been reacting precisely to Fibonacci levels and key price zones. After reaching the 0.618 Fib retracement, it encountered strong resistance near the weekly level at $0.276255. Since then, the price has been in a pullback phase
2.) Head and Shoulders Pattern:
After the impulsive move, DEEP formed a head and shoulders pattern, which was broken to the downside. The classic pattern completion confirms a bearish bias, but the subsequent retest of the broken neckline leads us to the current range
3.) Support at $0.209732 (Fib & Liquidity Zone):
The Fib retracement 0.786 of this 5-wave impulse aligns with $0.209732, where we also see liquidity stacking up. This is an ideal support area where we might see a bounce, given the confluence of the head and shoulders target aligning here
The Fib retracement 0.618 from the larger wave is close at $0.208073, giving us even more confirmation of the importance of this region
4.) Fib Speed Fan:
Additionally, the Fib speed fan places the 0.818 level right at this support zone. This adds another layer of confidence to the idea that this could be a strong entry point for the long setup
Trade Setup:
The combination of these factors creates an ideal long setup:
Entry Range: The key levels we are looking at for entering are between $0.21 and $0.208.
Major Confluences: We have the Fib retracement 0.618 from the larger wave, head and shoulders target and Fib speed fan support all aligning here. This is not just coincidence, it's a perfect storm of technical support!
Stop Loss (SL):
Place the SL below the 0.786 level for now. This would provide a good margin to avoid unnecessary market noise, with the option to ladder your stop loss towards this 0.786 level depending on price action
Target Range:
A 2:1 risk-to-reward ratio or higher. This price point aligns with a previous key level of resistance and is an excellent target based on this setup
Confirmation:
Before executing, always look for confirmation:
Volume: Ensure there's enough volume to support the move
Candlestick Pattern: Look for a solid reversal candle at the support zone (e.g. bullish engulfing, hammer, etc.)
Order Flow: Ensure that the order flow is in favour of the long position, signaling that buyers are stepping in
Remember, trading is all about patience and confirmation. Keep an eye on volume, candlestick patterns and overall order flow before jumping in.
Let’s see how DEEP plays out.

DeepBook/USDT in Uptrend: Ascending Channel Holds KeyThe DEEP/USDT chart is trading in a clear ascending channel, consistently forming higher highs and higher lows.
This pattern reflects sustained bullish momentum and suggests the uptrend is likely to persist in the medium term.

"DEEP Breakout Alert: Ride the Bullish Wave!$DEEP/USDT Long Setup
Pattern: DEEP has broken out of a descending triangle, signaling a potential bullish move. The breakout is backed by strong upward momentum, with a retest of the breakout level providing a good entry opportunity.
Entry Range: Current price ($0.0842). Entries can be considered between $0.0800 and $0.0850.
Targets:
T1: $0.1700
T2: $0.2600
T3: $0.3390
Stop Loss (SL): Place a stop loss below the breakout level and support zone at $0.0676.
DYOR, NFA
