TradeCityPro | JUP Eyes Breakout as Altseason Momentum Builds👋 Welcome to TradeCity Pro!
In this analysis, I want to review the JUP coin for you. It’s one of the projects in the Solana ecosystem, currently ranked 59 on CoinMarketCap with a market cap of $1.65 billion.
📅 Daily Timeframe
On the daily timeframe, this coin is currently sitting below a very important resistance zone at 0.6312. This is a strong resistance area and serves as the main trigger for a trend reversal in this coin.
✔️ The main support floor for JUP is located at 0.3409, a level price has tested twice before. Now it has returned to 0.6312, and we can see increased market volume at this level, which indicates tension between buyers and sellers.
✨ A breakout of 0.6312 would be a good trigger for a long position, and I plan to open a long if this level breaks. This could potentially be a long-term position with a high risk-to-reward ratio.
🔔 The next major resistance zones are at 0.7858 and 1.1435, which we can use as targets for this position.
🔽 If the price gets rejected from the top and moves down, breaking 0.4186 and 0.3409, we can look to open a short position.
🧩 The break of 0.3409 would confirm the start of a downtrend, and it's one of the key zones where I’ll definitely look to hold a short position if it breaks.
📝 Final Thoughts
This analysis reflects our opinions and is not financial advice.
Share your thoughts in the comments, and don’t forget to share this analysis with your friends! ❤️
DEFI

SYRUPUSDT 4H Chart Analysis | Trendline Breakout & Next MovesSYRUPUSDT 4H Chart Analysis | Trendline Breakout & Next Moves
🔍 Let’s break down the latest action on the SYRUP/USDT 4H chart and pinpoint what comes next as trend and momentum cues line up for traders.
⏳ 4-Hour Overview
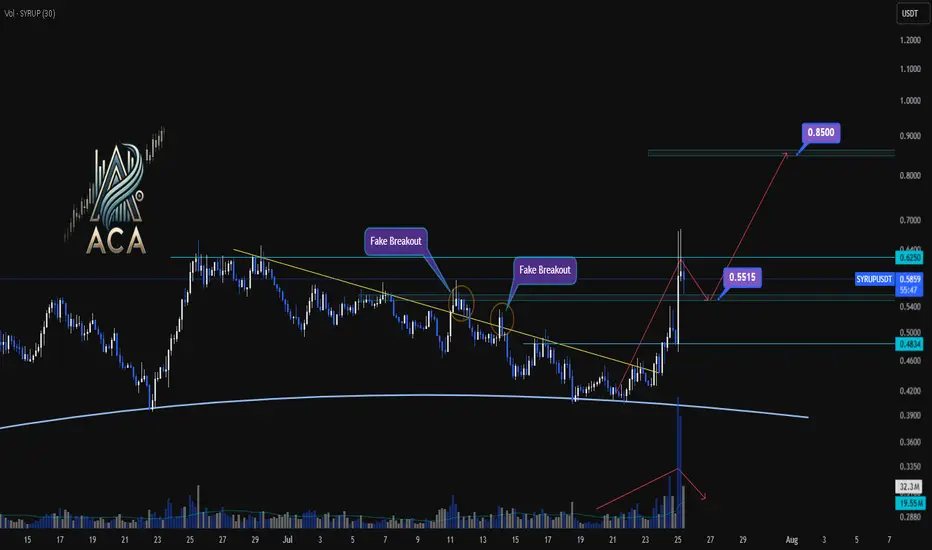
- The recent breakout above the key trendline was backed by a surge in volume, providing clear momentum confirmation and pushing price toward resistance.
- Price has already reached 1.5R of the initial breakout target, a strong sign the trend is in motion.
- Upon touching the $0.6250 resistance, momentum cooled, with volatility decreasing — a classic consolidation phase after a high-energy move.
🔻 Correction & Structure
- With volume subsiding and momentum slowing post-$0.6250, we’re now expecting a corrective move down toward $0.5515.
- This retracement zone will be critical to watch for higher low formation – a bullish structural signal if supported by volume confirmation.
🔺 Long Setup:
- Should SYRUP reclaim and break above $0.6250 after setting a higher low at $0.5515, and with renewed volume, we could see another strong leg higher.
- The next major resistance sits around $0.85 — this aligns as a logical upside target based on the range extension.
📊 Key Highlights:
- Trendline breakout with sharp volume spike = momentum confirmation.
- 1.5R reached before first deep pullback; structure remains bullish above $0.5515.
- Watch for a higher low and subsequent break of $0.6250 with volume to confirm the next move to $0.85.
🚨 Conclusion:
SYRUP’s chart is at a pivotal juncture: a constructive pullback to $0.5515 could set up the next wave higher if supported by volume. A confirmed breakout above $0.6250 targets $0.85 — stay patient and wait for volume signals at key levels.
ENA/USDT Chart Analysis | Volatility Signals & Bullish TriggersENA/USDT Chart Analysis | Volatility Signals & Bullish Triggers
🔍 Let’s dive into the ENA/USDT perpetual contract and analyze recent price action, focusing on momentum shifts and key breakout scenarios.
⏳ Daily Overview
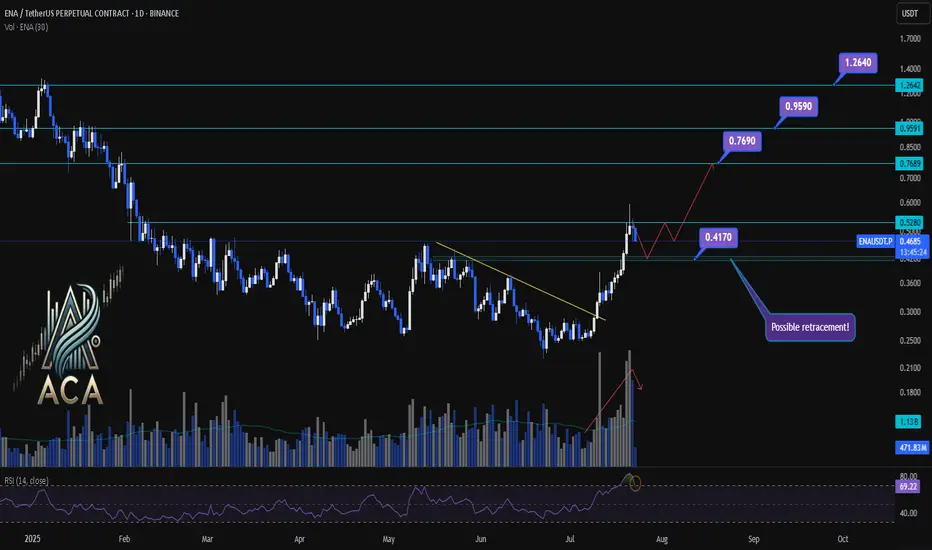
The daily chart shows that ENA recently reentered the overbought zone on the RSI, which can serve as a potential trigger for traders watching momentum shifts. Earlier, price action broke decisively above a long-standing descending trendline, resulting in a rapid, nearly 100% surge, a classic RR2 move off the trendline. This breakout coincided with a visible uptick in trading volume, confirming strong demand behind the move.
Now, during the ensuing rest or correction phase, trading volume is decreasing—often a constructive sign suggesting either profit-taking or a healthy pullback rather than panic selling.
🔺 Bullish Trigger & Setup:
- RSI Signal: Reentry into the RSI overbought zone is a potential long trigger, especially if confirmed by price action.
- Confirmation Level: A daily close with strong volume above $0.528 would add conviction to a bullish setup.
- Trendline Reference: The break above the recent trendline fueled the rapid advance, showing the importance of watching such key resistance levels.
📊 Key Targets (on further bullish confirmation):
- $0.769 — First upside resistance.
- $0.959 — Next bullish target.
- $1.264 — Extension target if momentum continues and broader market sentiment remains supportive.
🚨 Conclusion:
Eyes are on the $0.528 level—closing above it with volume, especially while RSI holds in the overbought zone, could provide the next strong entry signal. Current declining volume during pullbacks suggests this is likely a profit-taking phase or standard correction, not bearish capitulation. Keep monitoring RSI, volume profile, and price closes for the next actionable opportunity.
TradeCityPro | AAVE Holds Gains as Altseason Optimism Builds👋 Welcome to TradeCity Pro!
In this analysis, I’m going to review the AAVE coin for you. It’s one of the major DeFi coins active in the lending sector and currently ranks number 1 in terms of TVL.
✔️ The token itself has a market cap of $4.58 billion and is ranked 29 on CoinMarketCap.
📅 Daily Timeframe
On the daily timeframe, since our last analysis, the price has increased by over 100%, and the trigger for long or buy positions was activated.
🔄 There was a descending trendline on this coin, and the trigger for its breakout was 148.17. After breaking that level, we could open a long position.
🚀 However, the main trigger was 194.97, and the primary uptrend started with the break of that level, continuing up to a high of 328.9.
📊 The issue with this current uptrend is that, as you can see in the second leg, there is clear weakness, which is not a good sign for the continuation of this trend.
📈 The current top at 328.9 is not far from the previous high, forming a double top-like structure, leading to a strong bearish divergence in the RSI.
💥 If RSI confirms a breakdown below 50, this divergence will become active and a correction toward 222.10 may occur. A break of that level would be the first signal of a potential trend reversal for AAVE.
⭐ On the other hand, if price wants to continue upward, we have a very important resistance at 383.59.
🔍 Breaking this resistance would initiate an uptrend in higher cycles and could even lead to a new ATH for this coin.
💼 I plan to open a long position if the 328.9 resistance is broken, and for spot purchases, I will wait for a breakout of 383.59.As long as the price remains above 279.45, I am not considering any short positions.
📝 Final Thoughts
This analysis reflects our opinions and is not financial advice.
Share your thoughts in the comments, and don’t forget to share this analysis with your friends! ❤️

Syrup looks ready to start moving towards new ATH'sCRYPTOCAP:SYRUP has started to break out of its downtrend after revisiting the June lows. It has outperformed most of the market since April, with this month's pullback being an exception. I expect an aggressive move up into new highs. The fibs around $1 look like a good target for the short term, this would also be ~1b mc.

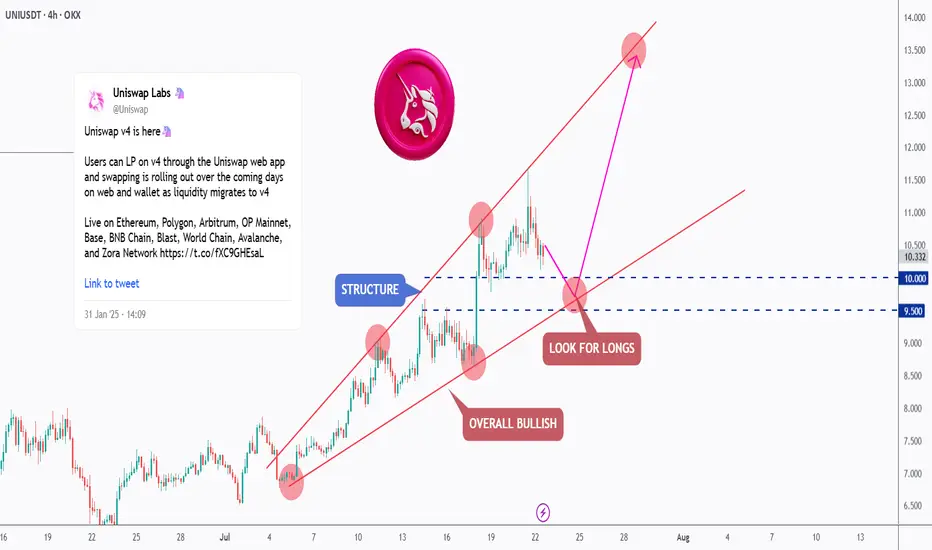
[Deep Dive] UNI – Edition 1: Retest. Reload. Rally?Uniswap (UNI) has been trading within a well-respected rising channel, showing consistent bullish structure across the 4H timeframe.
After a strong rally from the $7.50 region, price is now undergoing a healthy correction — retesting the lower boundary of the channel, which intersects with the $9.50–$10.00 demand zone.
📐 Technical Outlook
The market has printed a series of higher highs and higher lows, confirming the bullish momentum. The recent correction is testing a key support structure — previously a resistance zone — and this confluence aligns perfectly with the channel’s lower bound.
As long as this zone holds, UNI is well-positioned for a continuation toward the $13–$14 region, in line with the pink projected path.
🔥 Fundamental Boost
Uniswap has recently launched its V4 upgrade, introducing "hooks" — customizable smart contracts that allow developers to build more complex DeFi logic directly within liquidity pools. This upgrade not only enhances flexibility and capital efficiency, but also reduces gas costs — making Uniswap an even more dominant player in the DEX ecosystem.
Additionally, with Ethereum L2 adoption growing and Uniswap expanding across multiple chains (Arbitrum, Base, and Optimism), protocol usage and fees are on the rise again.
The UNI token may soon benefit from the proposed fee switch, which would redirect a portion of protocol fees to token holders — potentially adding new value accrual mechanics.
🟢 Conclusion
The technicals and fundamentals are aligning. UNI is in a bullish structure, trading at a key area of interest, and the latest upgrades may unlock new growth for the ecosystem.
Traders and investors alike should keep a close eye on this zone for long opportunities, as the next impulse could be just around the corner.
💬 What do you think — is UNI ready to break toward new highs, or will the demand zone fail? Let me know in the comments 👇
🔔 Disclaimer: This analysis is for educational and informational purposes only. It does not constitute financial advice or a recommendation to buy or sell any asset. Always do your own research and manage your risk accordingly.
📚 Always follow your trading plan => including entry, risk management, and trade execution.
Good luck!
All strategies are good, if managed properly.
~ Richard Nasr
TradeCityPro | SUI Eyes Breakout with Bullish Momentum Rising👋 Welcome to TradeCity Pro!
In this analysis, I want to review the SUI coin for you. It’s one of the Layer1 projects in the crypto space, currently ranked 13 on CoinMarketCap with a market cap of $13.66 billion.
📅 Daily Timeframe
On the daily timeframe, a lot has changed for SUI since the previous analysis. After breaking the descending trendline, it has started a new bullish trend.
✔️ In the first bullish leg after breaking the trendline, the price reached the 4.0866 zone, and now after a correction, it’s moving upward again.
📈 The 4.0866 level is a very important resistance. In fact, we can draw a resistance range between 3.6402 and 4.0866, as the price tends to behave erratically within this zone.
⭐ Currently, the price has re-entered this range and if 4.0866 is broken, the bullish wave could continue. The first target for this wave could be 5.2689.
🔼 So, if 4.0866 is broken, I highly recommend opening a long position, because if the price truly breaks this level (and it’s not a fake breakout), then the minimum target would be 5.2689.
📊 If the buying volume continues to increase as it is now, and the RSI breaks above 76.64, the chances of breaking 5.2689 will also rise, and the price may even set a new ATH.
👀 I already have an open position on this coin based on lower timeframe triggers, and I’m currently waiting to see the reaction to 4.0866. Based on my entry, if the price moves toward 5.2689, the risk-to-reward ratio will be very high. That’s why I’ve kept part of my position open to potentially capture that move.
🛒 For spot buying, we can also use a futures strategy — meaning if 4.0866 breaks, we open a futures position targeting 5.2689, and then use the profit from that position to buy SUI in spot, gradually building our spot portfolio.
✨ If you are looking at this coin only for spot, the main trigger is the breakout of 5.2689. But be careful — if the price moves aggressively, it might not give you a proper entry trigger, and entering from that area might be difficult.
📝 Final Thoughts
This analysis reflects our opinions and is not financial advice.
Share your thoughts in the comments, and don’t forget to share this analysis with your friends! ❤️

SOLUSDT 1D Chart Analysis | Accumulation Breakout Signals....SOLUSDT 1D Chart Analysis | Accumulation Breakout Signals Fresh Momentum
🔍 Let’s drill into the SOL/USDT daily chart, focusing on the recent breakout above the accumulation range, key support and resistance levels, RSI momentum, and volume confirmation for a robust bullish scenario.
⏳ Daily Overview
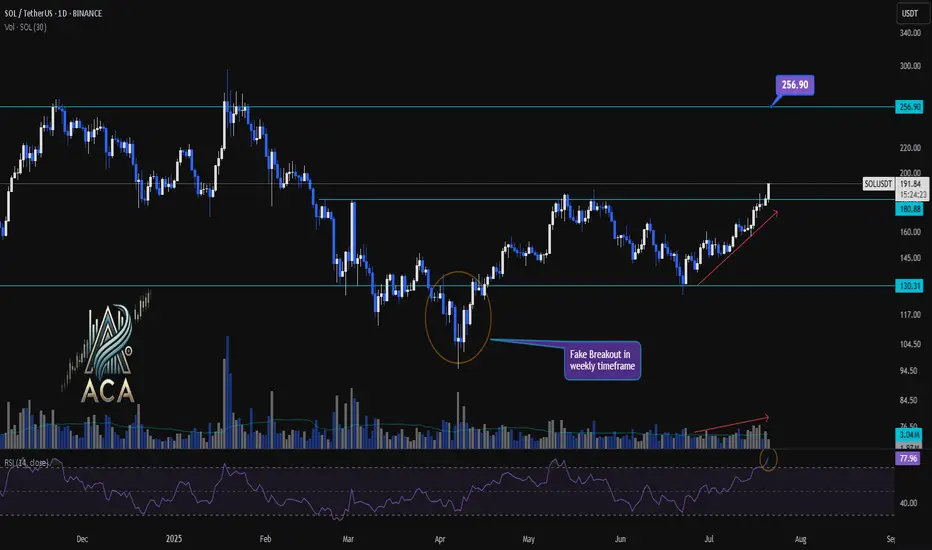
SOLUSDT has decisively broken out above a prolonged accumulation box, marking a significant shift in market structure. A daily close beyond this range now serves as a strong indicator for renewed bullish momentum. RSI is currently above 77, signaling that buyers are commanding momentum. Notably, volume has surged in tandem with price, confirming trader participation behind this breakout move.
📈 Technical Convergence and Trend Structure
- Accumulation Zone Break: After consolidating within a clear box for weeks, SOLUSDT closed above the upper boundary (around $180.88–$191.05), signaling a possible trend reversal or continuation.
- Daily Close Signal: A daily close outside the accumulation box offers high conviction for bullish continuation. This close acts as a potential entry signal for trend-followers.
- RSI Momentum: The RSI sits above 77—deep in the overbought territory. A close here not only confirms buyer strength but often precedes sustained uptrends when accompanied by price breakouts.
- Volume Surge: Volume has increased with the breakout, providing confirmation the move isn’t a false start, but likely fueled by real demand.
- Weekly Fake Breakout: There was a notable false breakout in the weekly timeframe, quickly reclaimed by bulls. This flip suggests buyers fended off downside attempts and now drive higher prices.
🔺 Bullish Setup & Targets
- First Target: $256.90 — marking the next major resistance on the chart and a logical upside objective for traders.
- Key Trigger: A confirmed daily (or weekly) close above the accumulation range with strong volume is essential for validating the upward trajectory.
📊 Key Highlights
- The breakdown of the accumulation box—now turned support—marks a pivotal structural change.
- RSI and price are making new local highs, solidifying the case for continued bullish momentum.
- Volume is climbing in sync with the move, offering real confirmation versus a potential fakeout.
- Recent fake breakout on the weekly chart, immediately negated, emphasizes that buyers are regaining—and likely maintaining—control.
🚨 Conclusion
SOLUSDT appears set for higher prices following the confirmed breakout above the accumulation range. Signs of trend health include an overbought RSI, volume confirmation, and the swift invalidation of a recent weekly fake breakout. As long as daily closes stay above the breakout level, the path remains clear for a rally toward $256.90. A strong daily close and continued volume will be your best signals for bullish continuation.
TradeCityPro | LDO Breaks Out Amid Altseason Hype Shift👋 Welcome to TradeCity Pro!
In this analysis, I’m going to review the LDO coin for you. It’s one of the well-known DeFi projects in crypto with the highest TVL in this category, and the LDO coin ranks 82 on CoinMarketCap with a market cap of $1.08 billion.
📅 Daily timeframe
On the daily timeframe, LDO has been in a range box for several months and is now starting to break out of it.
💥 After being supported at the 0.683 bottom, a large amount of buying volume entered, and a sharp bullish move occurred from this bottom to the top of the box. The RSI has also entered the Overbuy zone.
🔔 The overextended level on the RSI oscillator is 79.66, which has even been broken during this leg. Right now, I think the probability of a correction is quite high.
🔍 Yesterday's candle made a deep penetration into the top of the box, and currently, the price is sitting above the box. Since RSI is in the overextended zone, a pullback or short-term rest is likely.
🚀 However, considering the current uptrend, I believe this bullish leg might be ending, and we could see a few corrective candles. But after the correction ends, a new bullish leg might begin, pushing the price toward the resistance levels at 1.480 and 2.382.
🛒 For a long position or a spot buy, we can enter during this new bullish leg once the top breaks and a confirmation of a new wave starting is in place.
📝 Final Thoughts
This analysis reflects our opinions and is not financial advice.
Share your thoughts in the comments, and don’t forget to share this analysis with your friends! ❤️

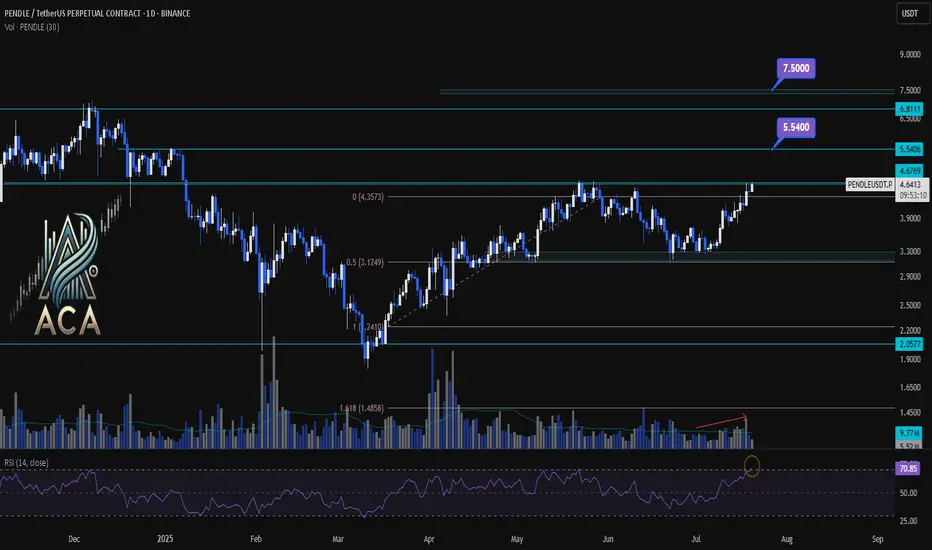
PENDLEUSDT 1D Chart Analysis|Bullish Breakout Eyes Higher TargetPENDLEUSDT 1D Chart Analysis | Bullish Breakout Eyes Higher Targets
🔍 Let’s break down the PENDLE/USDT daily chart, focusing on breakouts above key resistance, Fibonacci retracement dynamics, RSI momentum, and volume confirmation for a comprehensive bullish setup.
⏳ Daily Overview
PENDLE has staged a powerful recovery after pulling back to the 0.5 Fibonacci retracement level (around $3.12). Price is now testing the critical $4.68 resistance—the ceiling from the last corrective wave. RSI has jumped above 71, entering the overbought zone, a classic precursor to strong momentum moves. Volume is rising as bulls attempt a breakout, confirming participation behind the price action.
📈 Technical Convergence and Trend Structure
- Fibonacci Structure: The correction held the 0.5 retracement, a textbook bullish reversal zone in rising trends.
- Resistance Breakout: Price is challenging the $4.68 resistance. A daily close above, especially with high volume, would confirm the breakout and trigger bullish continuation.
- RSI Indicator: RSI has cleared the 70 mark, reinforcing strong momentum. Overbought RSI often supports further rallies when backed by breakout moves and rising volume.
- Volume Confirmation: Volume surged as PENDLE reclaimed lost ground and is now accelerating into the resistance test, suggesting trend conviction and confirming the move.
🔺 Bullish Setup & Targets
- First target: $5.54 — the next resistance based on historical supply and Fibonacci extension.
- If macro conditions like interest rate cuts align, the next potential target: $7.50 — the major extension target where price discovery is likely.
- Key trigger: A strong daily (or weekly) close above $4.68, combined with breakout volume, is likely to ignite the next leg up.
📊 Key Highlights
- Correction held at the 0.5 Fibo, signaling trend health and resetting momentum.
- A bullish daily structure aligned with a weekly breakout confluence.
- RSI and price action both making new local highs — strong uptrend indication.
- Volume confirming the move—a real breakout is underway, not a false start.
🚨 Conclusion
PENDLE/USDT looks primed for continuation higher. The blend of a successful 0.5 retracement retest, breakout attempt above $4.68, robust RSI, and volume surge all point to bullish follow-through. Watch for a confirmed close above resistance as the catalyst for further upside, with $5.54 and $7.50 the next logical targets if momentum persists.
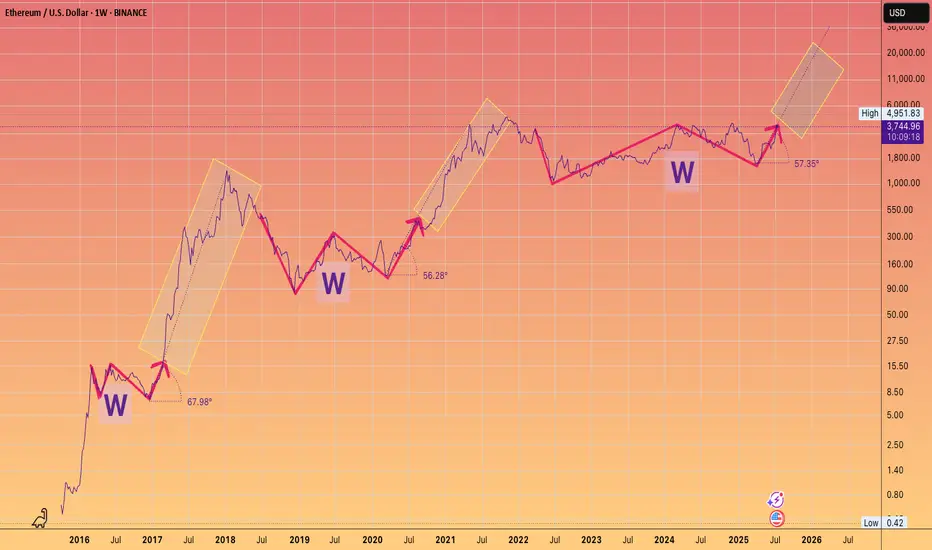
3 Wins to Glory.You guys know my long term Targets for ETH.
What I wanted to highlight is the angle of the Banana zone has been remarkably consistent on the Log chart.
Granted we only have 2 - 2.5 data points
But note how even in 2025 the run is adhering to the approx 60 degree angle of attack, after breaking out of their respective W's.
something to monitor.
ETHFI Coil Tightens Above Key SupportThis is ETHFI on the daily.
It’s currently consolidating above four major support levels:
• The black line at $1.097
• The 200-day MA
• The 50-day MA
• Bollinger Band center
A golden cross is approaching, and if price pushes higher, it could confirm soon. RSI is holding strong above both the 50 level and the signal line, suggesting bullish momentum is intact.
There’s also a bullish triangle forming between the series of lower highs and the $1.097 black line. Volume is decreasing, just as expected before a breakout. While breakouts can technically go either way, my bias remains bullish here.
From a fundamental standpoint, ETHFI benefits from the rising trend of restaking staked ETH, now regulated and attracting serious institutional interest.
Holding this support and completing the golden cross could be a volatile process, especially with ETHFI’s small $424M market cap and big macro events this week (like CPI and potential tariff news) on the radar.
Always take profits and manage risk.
Interaction is welcome.

DeFi Moonshot! Moon mission to $573 Billion dollars!DEFI fuelled by Ethereum, built on proven protocols and stablecoin legislation is ready to keep cranking higher for the rest of the year. And instead of a Defi summer of emergence (2020), a multi season of adoption that takes it to half a trillion dollars, hitting these targets of a #HVF
@TheCryptoSniper
The components set to benefit are:
Uniswap #UNI ~ $12.3 Billion
Lido DAO #LDO ~ $9.1 Billion
Aave #AAVE ~ $7.5 Billion
MakerDAO #MKR ~ $4.6 Billion
GMX #GMX ~ $2.5 Billion
Curve #CRV ~ $1.9 Billion
Synthetix #SNX ~ $1.1 Billion
Pulsex #PLSX ~ $0.46 Billion
Key points:
The #TotalDefi index is currently at $117B aligning closely with the $123.6B of TVL
As we see hundreds of billions of dollars get digitized watch this index climb onwards and upwards... With $1 Trillion dollars and obvious milestone that is surely set to be met ... one day.
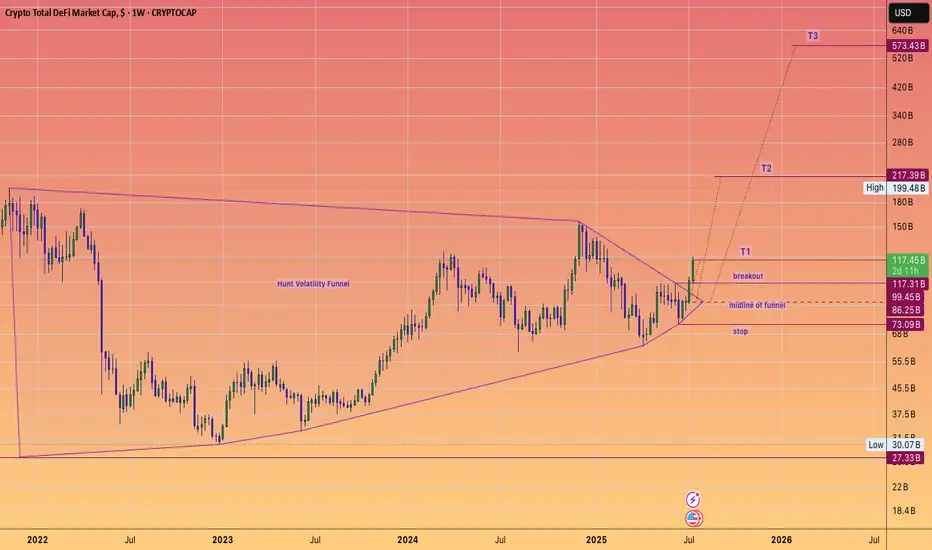
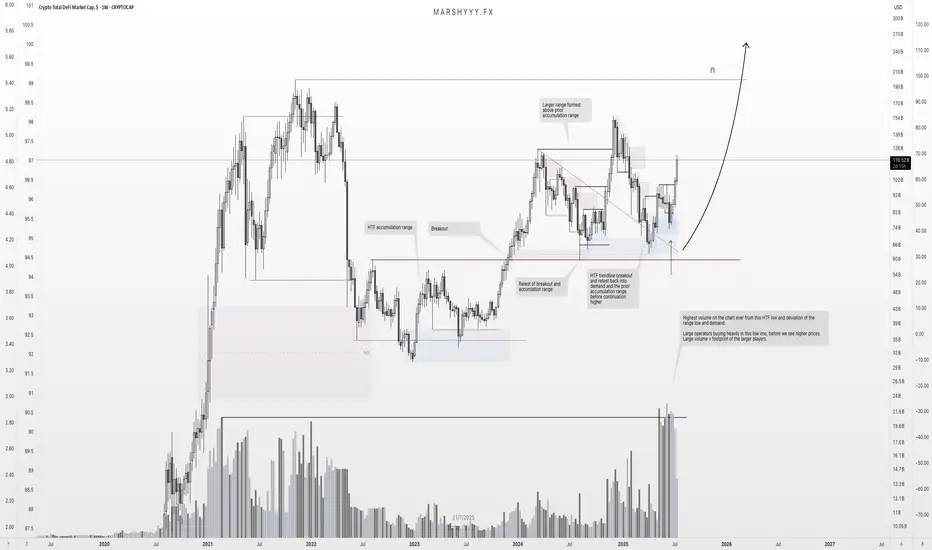
TOTAL DEFI: HTF Reaccumulation Underway — $200B+ In SightThis is one of the cleanest HTF setups in the market right now — and it’s flying under the radar.
We're looking at TOTAL DEFI market cap, and it’s showing all the signs of strong reaccumulation following a textbook breakout–retest structure off a larger HTF accumulation base.
Price broke out from the 2023–2024 accumulation range, retested that breakout zone and range highs in August 2024, swept liquidity, and tapped into unmitigated demand within the accumulation range — before climbing back to the $155B region, creating a larger range above the prior accumulation range it broke out from.
Since then, price pulled all the way back to range lows and HTF demand at $65B, forming a new bullish reversal from this key region and retesting the trendline breakout before continuing another leg higher — as we’re now seeing unfold.
But here’s the key:
🧠 That recent deviation came with the highest volume ever recorded on this chart — right off the range low and HTF demand.
That’s not retail. That’s large operators loading up, leaving their footprint ahead of the next expansion leg.
We’ve now:
- Broken the descending trendline cleanly
- Flipped key SR levels back into support
- Started pushing higher with strong HTF closes
📈 Expectation:
This is a spring + test setup within a reaccumulation range. I’m targeting continuation toward the range highs, followed by a macro breakout that could take DeFi market cap to $200B+ — especially once the prior distribution zone is reclaimed.
This aligns with the broader cycle narrative — liquidity rotating back into altcoins, particularly DeFi, as stablecoin dominance declines and the market shifts fully risk-on into the final phase of the bull cycle.
Key Structure Summary:
- HTF accumulation base → breakout → retest → demand sweep
- Largest volume spike = operator footprint
- Higher lows forming = market structure flipping
- Expecting expansion to $200B+ as trend continues
One to watch closely.
Don’t fade the volume. Don’t fade the structure.
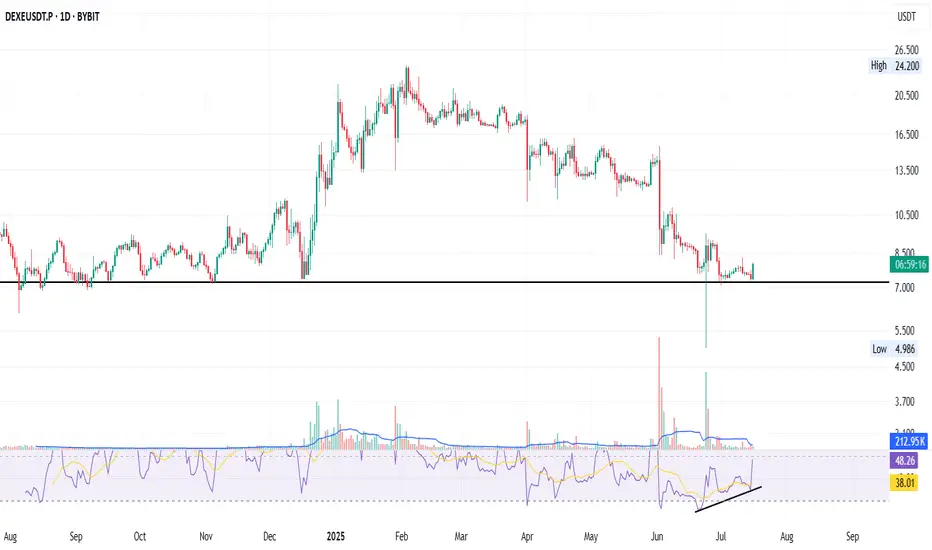
DEXE: Bounce + RSI Divergence + DeFi Strength
DEXE on the daily just bounced off an 11-month-old support - the key black line.
A strong bullish divergence on the RSI has been building for over a month — now confirming with momentum.
That long green wick under support? It’s signalling buyer interest and possible accumulation.
Fundamentals:
DEXE powers decentralized governance (DAO) with AI + DeFi alignment.
It enables transparent on-chain decision-making and sustainable DAO growth.
Backed by real partnerships, aiming for fair, merit-based participation.
I’m long: not financial advice.
Always take profits and manage risk.
Interaction is welcome.
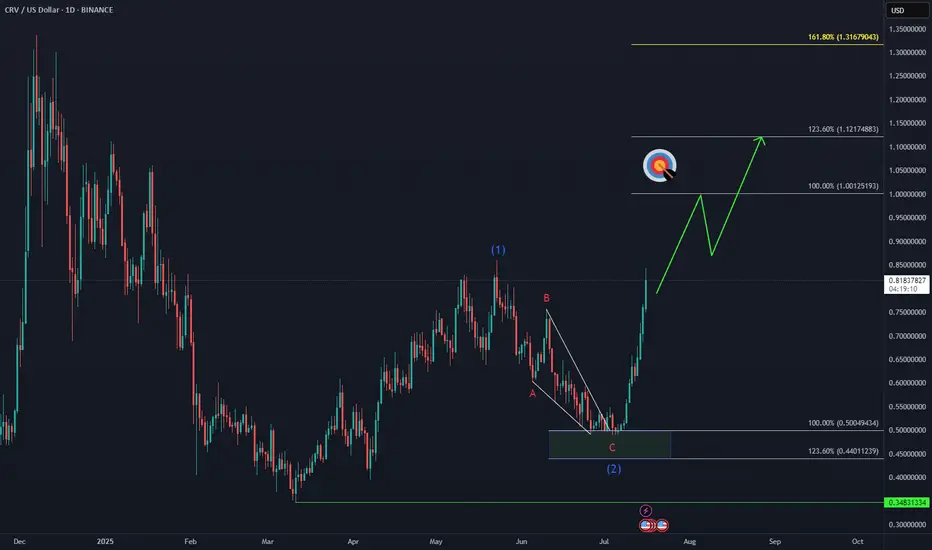
CRV Marching Toward Target📈 CRYPTO:CRVUSD is approaching a key breakout level, with bulls aiming to surpass the May peak and reach the $1.00 initial target.
Arbitrage Opportunity!I believe I’ve identified an arbitrage opportunity involving the DEFI cryptocurrency: it trades at $0.003200 on Bybit, compared to only $0.002390 on MEXC.
I recall encountering a similar situation with Shiba Inu, when the price gap between Binance and Coinbase was as high as 8X. Feel free to play the chart below to see the outcome:
I also remember the 2016–2017 period, when such arbitrage opportunities existed even with Bitcoin, due to price discrepancies between Asian exchanges and those available to European traders.

DEFI the Next Crypto Sleeper? Trump Jr. & O’Leary Back on Stage!Fundamental Bullish Case:
1. Huge Names Are Paying Attention
Earlier this year, De.Fi held a high-profile event attended by Donald Trump Jr. and Kevin O’Leary. Regardless of political views, this kind of exposure brings:
Mainstream visibility to a previously overlooked microcap.
Credibility among non-crypto retail investors.
The possibility of future partnerships or integrations with major capital players.
When figures like O’Leary (a former FTX critic turned crypto backer) show up, it means the project is on the radar.
2. De.Fi = A Web3 Security & Aggregator Suite
The DEFI token powers the De.Fi “super app”, which combines:
Smart contract security auditing (via their Scanner tool).
Cross-chain asset dashboard — track DeFi investments in one place.
Swap and bridge functionality — a unified DeFi experience.
In a post-FTX world, security + simplicity is the future of Web3 adoption — and De.Fi is positioning itself at that intersection.
3. Microcap with Moonshot Potential
Market cap under $3 million, fully diluted cap still under $30 million.
Token has already proven it can reach $1.00 — and even a partial recovery gives 100x potential from current prices.
Strong upside asymmetry compared to overbought majors.
4. 2025 = Altcoin Season Potential
As Bitcoin cools and liquidity rotates, microcaps historically outperform in the late-stage bull cycle. DEFI could ride this wave as attention flows from BTC to altcoins with good narratives and active dev teams.
Technical Analysis: Reversal in Progress?
All-Time Low was just 2 days ago ($0.0016).
Since then, price has jumped over 57%, showing early-stage accumulation and short-squeeze activity.
A move above $0.0030 could confirm a breakout from this capitulation bottom.
If momentum sustains, initial resistance targets are $0.006, $0.01, and $0.025 — still just a fraction of ATH.
Price Target Scenarios:
Target % Upside from $0.0026 Reasoning
$0.006 +130% Technical breakout level
$0.01 +280% Psychological + chart level
$0.10 +3,700% Mid-tier recovery, low float
$1.00 (ATH) +38,000% Full retrace (moonshot)
Final Thoughts:
DEFI is not a sure thing - it’s volatile, it’s tiny, and it was forgotten for months. But with renewed attention from major names, an actual working product in the DeFi space, and a chart that just bounced 50% off its lows, it may be gearing up for a new chapter.
If you're looking for an early-stage altcoin with real upside potential in this cycle, DEFI is one to watch.

CoW Protocol About to Enter Bullish Zone (214% Easy Target)'Next target' has 484% profits potential. This target is projected to hit mid-term, that is, within 3 months (90 days)... Boost & keep reading below!
Good afternoon my fellow Cryptocurrency trader, I hope you are having a wonderful week and day.
COWUSDT is about to enter the bullish zone, when the action moves above EMA55. The magenta line on the chart.
This altcoin is already bullish because it is no longer bearish. The low happened 7-April and as you can see, the market has been sideways since early February. 150 days. More than 5 months.
Notice how daily trading volume is almost flat but some days stand out with increased buying. You see green bars shooting up but never red bars. This reveals a bullish bias. We are witnessing the early days before a major bullish breakout. One that will lead to 200% and up to 500% profits mid-term. Long-term, there can be more.
Thank you for reading.
Another easy trade, huge profits, easy chart. Buy and hold.
Namaste.

TradeCityPro | UNI Builds Pressure Below Key Resistance Zone👋 Welcome to TradeCity Pro!
In this analysis, I’ll be reviewing the UNI coin — one of the notable DeFi tokens, currently ranked 27th on CoinMarketCap with a market cap of $254 million.
⌛️ 4-Hour Timeframe
On the 4-hour chart, as you can see, UNI has formed a bottom around the 6.043 level, which is considered its key support zone. After reaching this level, the price began an upward move, though the trend appears very weak.
✔️ Currently, there’s a resistance zone just above the price that has previously caused multiple rejections. Once again, the price is moving toward this zone.
📊 The volume during this latest upward leg is very low, which is not a good sign for initiating a bullish trend. If the price reaches this resistance level with such low volume, there's a high likelihood of another rejection.
🔽 If that happens, we could consider opening a short position based on this rejection. However, my main trigger level for a short is the break below 6.896 — I personally would wait for this level to be breached before entering a short position.
✨ The next key support, in case 6.896 is broken, is the 6.043 zone. This is a major support level and could serve as the target for the short trade. If this level is broken as well, it could mark the beginning of a strong downward trend.
🔍 On the other hand, if volume starts to pick up and the resistance zone is broken, we could open a long position. The target for this could be around 8.678 — or even a setup in anticipation of a breakout above 8.678.
🔔 Which scenario you choose depends largely on your market perspective. If you're looking for a short-term trade, the first scenario is more appropriate. But if you're aiming for a long-term position with a wider stop loss, the second scenario would be the better choice.
💥 In either of the long scenarios, I strongly recommend confirming the move with volume. For further confirmation, you can also check if RSI enters the overbought zone.
📝 Final Thoughts
This analysis reflects our opinions and is not financial advice.
Share your thoughts in the comments, and don’t forget to share this analysis with your friends! ❤️

TradeCityPro | 1INCH Tests Supply Zone After Strong Bounce👋 Welcome to TradeCity Pro!
In this analysis, I want to review the 1INCH coin for you. It’s one of the DeFi coins, with a market cap of $256 million, ranked 162 on CoinMarketCap.
⏳ 4-Hour Timeframe
As you can see in the 4-hour timeframe, this coin is sitting on a support floor at the 0.1668 zone and has formed a range box at this bottom.
🔔 There’s a key supply zone at the top of this range box, which I’ve marked as a range for you, and currently, the price is inside this zone.
📊 Given the significant buying volume that has entered this coin, the price has penetrated into this range and is testing it for the several-th time.
✨ If this range is broken, we can confirm the bullish reversal of this coin and open a long position. Volume has already given us confirmation, and if RSI enters the Overbuy area, that will be our momentum confirmation.
🔼 The next resistance levels for this coin—which we can consider as targets—are 0.2031 and 0.2207.
✔️ If the price gets rejected from this zone, it may move back down toward the 0.1668 floor. For a short position, we can enter if 0.1668 is broken.
📉 However, if we get confirmation of rejection from the zone, we can look for an early entry trigger in the lower timeframes.
📝 Final Thoughts
This analysis reflects our opinions and is not financial advice.
Share your thoughts in the comments, and don’t forget to share this analysis with your friends! ❤️

#QNTUSDT #4h (Bitget Futures) Bull flag near breakoutQuant regained 50MA support after breaking out of the falling wedge, bullish continuation seems likely.
⚡️⚡️ #QNT/USDT ⚡️⚡️
Exchanges: Bitget Futures
Signal Type: Regular (Long)
Leverage: Isolated (6.0X)
Amount: 4.6%
Current Price:
100.30
Entry Zone:
99.22 - 96.92
Take-Profit Targets:
1) 106.59
2) 112.99
3) 120.11
Stop Targets:
1) 90.95
Published By: @Zblaba
GETTEX:QNT BITGET:QNTUSDT.P #4h #Quant #RWA quant.network
Risk/Reward= 1:1.2 | 1:2.1 | 1:3.1
Expected Profit= +52.1% | +91.3% | +134.8%
Possible Loss= -43.6%
Estimated Gaintime= 1-2 weeks

Do you want to have glory? Do want to see Valhalla?#HODL
These next few years will could change your life.
#ETHEREUM is cheap right now.
#ETH still can do tens of X's
