TradeCityPro | LDO: Comprehensive Market Analysis and Prediction👋 Welcome to TradeCity Pro!
In this analysis, I want to review LDO for you. It is one of the key DeFi platforms, and its token currently holds a market cap of $945 million, ranking 72nd on CoinMarketCap.
📅 Weekly Timeframe
On the weekly timeframe, we can see a range box between the $0.957 and $3.389 levels, where the price has been fluctuating for almost two years.
🔽 If you already hold this coin, I recommend activating your stop-loss in case the $0.957 level is broken and waiting for bullish momentum to re-enter the market before buying again.
📈 If the price holds above the $0.957 support, it could rally back toward the top of the range at $3.389. The key trigger levels between the current price and the top of the box are $1.447 and $2.488.
🚀 The main buying trigger is at $3.389, as breaking this level could lead to significant capital inflows, potentially initiating a long-term bullish trend.
📅 Daily Timeframe
On the daily timeframe, a range box between $1.447 and $2.387 had formed, which was broken to the downside, leading to a bearish leg. The main support level is $0.957, and if it fails to hold, the price could enter a new bearish cycle.
🛒 For spot buying, there isn’t a clear trigger yet, so we need to wait for a new structure to form. However, if the price rallies sharply, you could consider entering on a break above $1.489.
💫 As seen on the chart, the red candle volume is significantly higher than the green candles, indicating strong seller dominance. Additionally, the RSI is near the 30 level, and if it breaks below this zone, the bearish scenario becomes more likely.
📝 Final Thoughts
This analysis reflects our opinions and is not financial advice.
Share your thoughts in the comments, and don’t forget to share this analysis with your friends! ❤️
DEFI

Incoming BNB chain forks with 0,75s block time!BNB chain upcoming forks significantly reducing block times, increase TPS and decrease fees!
The Pascal hard fork in March 2025 is a big milestone in BNB Chain’s evolution setting the stage for the two upcoming BNB Chain forks:
1. Lorentz (April 2025): Reduces block intervals to 1.5 seconds
2. Maxwell (June 2025): Further reduces block intervals to 0.75 seconds
Very bullish for all BNB chain projects and it´s main token BNB and defi platforms like CAKE. Finally Ethereum compatible chain's direct hit to Solana's heart and it's performance. The Maxwell fork in June will be game changer for crypto industry.
Almost instant defi experience with decreasing Ethereum activity might lead to 2025 be a BNB chain season.

Univers Of Signals | SUI👋 Welcome to Univers Of Signals Channel!
Let's analyze and review one of the most popular coins in the market, sui, and update our previous analysis and find new triggers
🌐 Bitcoin Overview
Before starting today's altcoin analysis, let's look at Bitcoin on the 1-hour timeframe. Since yesterday, Bitcoin experienced a correction, which was necessary for the market, and it pulled back to the 102135 range. The next trigger for a long position will be a breakout above 104714.
Yesterday's correction, coupled with an increase in Bitcoin dominance, caused noticeable declines in some altcoins. This highlights the importance of monitoring BTC pairs in your checklist these days.
📊 Weekly Timeframe
In the weekly time frame, it is one of the coins that is in good condition, it is really in the market and is still fluctuating on the high support levels.
After hitting 5.24, we made a new ceiling or ATH, and after that, due to recent market news, we experienced some drops, and this has also caused the price correction of this coin.
For re-buying, if we make a good support candle at this level 2.4, it will be a good trigger and the main trend will start again after we break 5.24. Also, after breaking 1.77, we can temporarily exit this coin and cash out!
📈 Daily Timeframe
In the daily time frame, it has been in relatively good conditions compared to other coins in the market and has experienced fewer declines and still has a lot of support to lose!
After breaking the 1.0333 level, which was our trigger spot, we made our purchase and experienced a move after its failure with the entry of momentum and recorded a new ceiling with this event!
Along with this trend, we can draw our Fibonacci levels, which are currently involved in the important level of 0.382, and after it rises and breaks the ceiling of 5.24, we can experience a powerful move!
If this level is broken, we can also hit the support levels of 1.7702 and 1.3859 and we need to form a structure to buy now, but after breaking the trend line and the 3.65 trigger, it can be a good point! For selling, I will continue to hold for now!
📝 Final Thoughts
Stay calm, trade wisely, and let's capture the market's best opportunities!
This analysis reflects our opinions and is not financial advice.
Share your thoughts in the comments, and don’t forget to share this analysis with your friends! ❤️

AAVE Retests Key Support – Bullish Reversal Ahead?CRYPTOCAP:AAVE is currently retesting a rising support line after breaking through a key resistance zone, which has now turned into support.
This structure suggests that the uptrend remains intact, and the recent dip could be a healthy pullback before a continuation to the upside.
DYOR, NFA

ETH in a LIVERMORE Accumulation cylinder.What is a Livermore accumulation cylinder?
The Livermore Accumulation Cylinder gained fame through the insights of Jesse Lauriston Livermore, a Massachusetts-born American investor celebrated as one of the most exceptional traders in history. His theory revolves around what is often referred to as an ascending broadening wedge, a phenomenon that unfolds over extended time frames.
What is an accumulation cylinder with a widening mouth?
First recognized by the iconic trader Jesse Livermore, who essentially laid the groundwork for technical analysis, the 'Accumulation Cylinder with Widening Mouth' is a unique and gradually developing pattern. In this scenario, the price oscillates between two diverging lines, creating a tension that can lead to a significant upward breakout.
Is Ethereum resolving its own Livermore cylinder?
This isn’t the first instance of cryptocurrency showcasing a Livermore cylinder: Ethereum might currently be in the midst of resolving its own version, and Bitcoin may have experienced a similar pattern back in 2017. While the charts may seem to align quite well, it’s crucial to remember that they are not a guarantee of future outcomes. Instead, they can serve as a valuable guide for managing risk, setting expectations, and establishing realistic profit targets. Many newcomers to crypto dream of achieving a 100x return, but as demonstrated by Bitcoin whales, true profits often come from strategically trimming and adjusting their positions, making only a few calculated moves from cycle to cycle.

Higher low + trendTwo sell-off recently and cake formed higher low compared to "big short" in Feb 2025. On the other hand there is long-term trend pointing the area 3.5-4.0usd as the next resistance. If broken the price can gain traction quickly as there is not much sell pressure in higher levels.

$ONDO: Ondo Finance – Tokenizing the Future or Facing Roadblocks
(1/9)
Good morning, champs! ☀️ LSE:ONDO : Ondo Finance – Tokenizing the Future or Facing RWA Roadblocks?
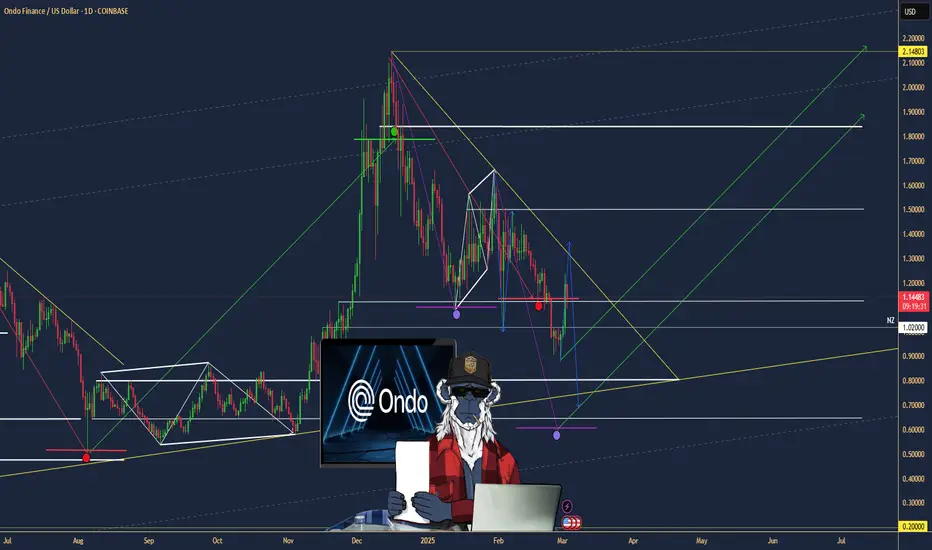
Ondo Finance just joined Mastercard’s Multi-Token Network, aiming to tokenize U.S. Treasuries! But with market volatility, is this RWA gem a buy or a wait? Let’s dive in! 🔍
(2/9) – PRICE PERFORMANCE 📊
• Recent Trend: Transaction volume spiked to 400M in Jan 2025, now ~300M 💰
• Market Insight: Up 1.6% recently (Daily Hodl, Feb 2025) 📏
• Sector: RWA tokenization surging with TradFi interest 🌟
It’s buzzing in the DeFi space! ⚙️
(3/9) – MARKET POSITION 📈
• Market Cap: Not specified; holds 40% of tokenized securities market 🏆
• Holdings: U.S. Treasuries, bonds via USDY, OUSG tokens ⏰
• Trend: Whales hold 88% of tokens, per IntoTheBlock 🎯
Firm, leading RWA tokenization! 🚀
(4/9) – KEY DEVELOPMENTS 🔑
• Partnership: Joined Mastercard MTN as first RWA provider (Feb 26, 2025) 🔄
• Expansion: Teamed with World Liberty Financial for RWAs 🌍
• Market Reaction: Steady growth in transaction volume 📋
Adapting, bridging TradFi and DeFi! 💡
(5/9) – RISKS IN FOCUS ⚡
• Volatility: Crypto market swings could hit token value 🔍
• Regulation: Compliance hurdles in tokenized assets 📉
• Concentration: High whale ownership (88%) risks dumps ❄️
Tough, but risks loom! 🛑
(6/9) – SWOT: STRENGTHS 💪
• RWA Leader: 40% tokenized securities market share 🥇
• Big Backers: BlackRock, Coinbase Ventures support 📊
• Tech Edge: Tokenizing U.S. Treasuries for DeFi 🔧
Got fuel in the tank! 🏦
(7/9) – SWOT: WEAKNESSES & OPPORTUNITIES ⚖️
• Weaknesses: High whale concentration, market volatility 📉
• Opportunities: TradFi integration, DeFi yield growth 📈
Can it tokenize to the moon? 🤔
(8/9) – 📢Transaction volume at 300M, Mastercard partnership live, your take? 🗳️
• Bullish: $2 soon, TradFi loves it 🐂
• Neutral: Steady, risks balance ⚖️
• Bearish: $0.90 looms, whales dump 🐻
Chime in below! 👇
(9/9) – FINAL TAKEAWAY 🎯
SMCI’s transaction volume and TradFi ties scream potential 📈, but whale concentration adds caution 🌿. Volatility’s our buddy—dips are DCA gold 💰. Grab ‘em low, climb like pros! Gem or bust?
Liquidity sweep at 2usdRecent price action surprised many. The reason behind this is open sell position for aprox. 5M of cake tokens at 2usd price level. Not speculating who did this but all who is following this project for long-term can understand there is tight competition on the market. Price will rise from this level, once reached 2usd liquidity will be swept quickly.

TradeCityPro | Deep Search: In-Depth Of Solana👋 Welcome to TradeCity Pro! In this analysis, I will thoroughly review the SOL project, one of the largest crypto projects with a market cap of $73 billion, ranking it 6th among cryptocurrencies.
🔍What is Solana?
🔹Solana is a high-performance, permissionless blockchain platform launched in 2020 by Solana Labs (founded in 2018 by Anatoly Yakovenko and Raj Gokal).
Solana is a high-performance Layer-1 blockchain designed for speed, scalability, and low costs. Launched in 2020 by Solana Labs, it processes up to 65,000 transactions per second (TPS) with sub-second finality and low fees (~$0.0002 per transaction). Unlike Ethereum, which relies on Layer-2 solutions, Solana achieves scalability on Layer-1 using novel technologies like Proof of History (PoH). It is optimized for DeFi, NFTs, gaming, and payments, positioning itself as a fast, cost-efficient alternative to Ethereum.
—
🔹History & Background
olana’s development began in 2018, when Anatoly Yakovenko (a former Qualcomm engineer) published a whitepaper introducing Proof of History (PoH) as a new approach to timekeeping in distributed systems. The project attracted venture funding; in 2019 Solana raised $20 million in a Series A led by Multicoin Capital.
After several testnet iterations (nicknamed Tour de Sol, etc.), Solana’s mainnet beta officially went live in March 2020. The Solana Foundation, a Swiss non-profit, was also established in 2019 to steward ecosystem development.
Solana nodes take full advantage of multicore CPUs, GPUs, and high-bandwidth networks, processing transactions in parallel and pipeline fashion. The network’s 400–600 millisecond block times and capacity for multithreaded execution are a stark contrast to the single-threaded EVM model
—
🔹How Does Solana Work?
Solana’s speed and efficiency come from eight core innovations:
1) Proof of History (PoH): A cryptographic clock that timestamps transactions before consensus, reducing latency.
2) Tower BFT Consensus: A Proof-of-Stake (PoS) mechanism that leverages PoH to speed up block finalization.
3) Turbine: A block propagation system that breaks data into smaller packets for faster distribution.
4) Gulf Stream: A mempool-less forwarding system that pre-assigns transactions to upcoming validators.
5) Sealevel: A parallel smart contract execution engine, unlike Ethereum’s single-threaded execution.
6) Pipelining & Cloudbreak: A transaction processing unit and scalable storage for high throughput.
7) Archivers: A distributed storage system for historical blockchain data.
Together, these technologies enable high throughput and low fees while maintaining decentralization.
—
🔹 Solana’s Consensus Mechanism
Solana combines Proof-of-History (PoH) and Proof-of-Stake (PoS), with Tower BFT handling validator voting.
- PoH timestamps transactions, eliminating the need for validators to agree on time.
-PoS selects validators based on staked SOL, securing the network.
-Tower BFT speeds up consensus by locking validator votes, reducing fork probabilities.
-Finality is achieved within seconds, making Solana one of the fastest blockchains.
—
🔹SOL Tokenomics & Vesting
Initial supply: 500M SOL at launch (2020).
Distribution: 39% community, 25% private investors, 13% team and 10% foundation.
Inflationary model: Started at 8% annual inflation, decreasing 15% yearly until reaching 1.5% final inflation.
Token burn: 50% of transaction fees are burned, reducing supply growth.
Vesting: Early investor and team tokens had a 4-year vesting period, most fully unlocked by 2023.
—
🔹Some of wallets Supporting Solana
- Phantom
-Solflare
-Trust Wallet
- Atomic Wallet
- Exodus:
-Ledger Nano S/X
-Backpack
-Glow, Torus
—
🔹Platforms for Staking SOL
BlazeStake
marinade.finance
Jito
Lido
—
🔹Liquidity Pool Platforms
Raydium
Orca
Jupiter
Meteora
Saber
Pancakeswap
Lifinity
Saros Finance
Drift Protocol
Aldrin
Crema Finance
🔹Solana’s 2025 Roadmap and DeFi Opportunities
A key focus in 2025 is Firedancer: a new Solana validator client being developed by Jump Crypto. Firedancer aims to drastically boost Solana’s throughput and stability – it has demonstrated a theoretical capacity of over 1 million transactions per second in tests. As of early 2025, the Solana team is actively testing Frankendancer (an early Firedancer version) on testnets, pushing for a supermajority of validators to trial it. This upgrade, once fully deployed, is expected to give Solana a significant edge in scalability and help avoid the network congestion issues seen in the past.
New Token Standard (Token-22): Solana’s roadmap also introduces Token-22, an enhanced token standard designed for more functionality in payments and digital assets. Token-22 will support built-in features like automatic royalties and richer ownership controls, which is especially useful for NFTs and gaming assets on Solana. This upgrade will enable developers to create more versatile dApps – for example, NFTs with enforced royalty payments or tokens with conditional transfer rules – improving the user experience within Solana’s ecosystem
Scaling Techniques (Sharding and Parallelization): Even though Solana already handles about 50k TPS, the core team is exploring sharding and other parallelization techniques to stay ahead of future demand
Security and Stability Enhancements: After a few high-profile outages in earlier years, Solana’s developers have made network robustness a top priority. The 2025 plan includes more rigorous third-party audits and battle-testing of the network under heavy load. y diversifying its validator client software (e.g. introducing Firedancer) and adding safeguards, Solana aims to prevent single points of failure. New cryptographic techniques and quality-of-service improvements are being rolled out to harden the network against both bugs and malicious attacks
—
🔹Popular Projects on Solana
DeFi: At its peak, SEED_TVCODER77_ETHBTCDATA:10B + TVL, now recovering post-FTX collapse.
NFTs: Second-largest NFT ecosystem after Ethereum, driven by low fees.
Gaming: Web3 gaming hub with Star Atlas, Genopets, and move-to-earn projects.
DePIN (Decentralized Physical Infrastructure): Helium’s migration brought millions of new transactions to Solana.
—
🔹CertiK Skynet Score: 91.67
🔹Fundraising: $359.55 M
🔹Some of Solana Investors:
Polychain Capital
CMS Holding
a16z
Distributed Global Crypto Fund
RockawayX
Multicoin Capital
—
🔹Seed and Private Sales:
Before its public launch, Solana raised capital through several funding rounds. In 2018, a seed round sold SOL tokens at about $0.04 per token, raising approximately $3.17 million.
This was followed by private investment rounds in 2019 where tokens were priced higher roughly $0.20 to $0.25 per SOL, bringing in additional funding (over $12 million in the first private round and $5–6 million in a second round)
Solana’s public token sale occurred in March 2020 on the CoinList platform, just prior to the network’s launch. 8 million SOL (about 1.6% of the initial 500M supply) were sold in this auction-style sale at a price of $0.22 per SOL.
🔹Solana's TVL and revenue:
First, let's examine its Total Value Locked (TVL). Overall, since early November 2023, we have witnessed an upward trend with strong momentum, reflecting growing attention and trust in this ecosystem. Specifically, the amount of locked Solana has increased from 9 million SOL on November 11 to nearly 50 million SOL (March 2, 2025). However, despite the rise in TVL, the network's revenue has been on a downward trend since January 2025, dropping from 70.5 thousand SOL to 2 thousand SOL, a decrease of approximately 97.16%.
🔹Solana On-Chain Analytics Overview
Whale Activity & Large Transactions:The number of whale addresses (holding ≥10,000 SOL) peaked in January 2025 but has since slightly declined, suggesting that some large holders may have reduced their positions. On February 24, a significant whale transaction involving 846,613 SOL ($127M) sparked speculation of a potential sell-off. Meanwhile, other whales appear to be accumulating SOL, with Binance withdrawals totaling 95,600 SOL on February 28, a portion of which was moved to staking, indicating confidence in the network's long-term value.
Active and New Addresswork Expansion:Despite robust growth in total addresses, daily active usage on Solana has recently tapered off. By late February 2025, daily active addresses dropped to approximately 3.5 million, marking a three-month low for the network. However, Solana continues to see strong adoption, adding over 5 million new addresses per day, even amidst market volatility. While the total address count grows, the decline in daily active addresses to 3.5 million reflects reduced user engagement. Transaction volume has also fallen to $1.5 billion, a four-month low, and stablecoin transfer volume has plummeted from $394 billion to $7.1 billion, signaling a significant slowdown in network activity.
👀 Now that we've reviewed the project, let's move on to the chart to also technically analyze this coin
🗓 Weekly Time Frame
As you can see in the weekly timeframe, after breaking the $27.55 level, SOL initiated a strong uptrend and managed to reach its previous ATH at $255.98. Currently, a price box has formed ranging from $126.40 to $255.98, where it has been oscillating for about a year.
⭐ The floor of the box aligns with the 0.236 Fibonacci level, creating a PRZ (Potential Reversal Zone). If the box is breached downward, SOL could begin its corrective wave targeting the significant Fibonacci levels of 0.382, 0.5, and 0.618. A pullback to the SMA99 could also be a plausible scenario.
⚡️ A divergence trigger in the RSI has activated with the break below 50, indicating a potential trend change to bearish, increasing the likelihood of breaking below $126.40.
🔼 If the price finds support at $126.40, there's a high possibility it could retest the upper boundary at $255.98, especially if Bitcoin stabilizes and forms a base.
🗓 Daily Time Frame
In the daily timeframe, we can observe more detailed price movements. After being rejected at the $260.88 area, SOL started its downward trajectory, breaking below $180.63, pulling back to this level, and continuing its decline.
🔍 The critical support now stands at $126.01, where the price has touched and initially reacted to this level. A break below this support could lead to further declines in the chart. Important areas in the daily timeframe are $99.81 and $82.39.
✅ The RSI is near a crucial area, close to entering the Oversell zone. Entry into this zone could heighten the probability of a bearish scenario and the breach of $126.01.
🧩 If the price rebounds from this support, as mentioned in the weekly analysis, we could witness a move up to the box ceiling. However, for now, any buying or long positions should be held off until the price forms a new structure and we can identify clear long and short triggers.
📝 Final Thoughts
This analysis reflects our opinions and is not financial advice.
Share your thoughts in the com
Richard Heart defeats the SEC A U.S. district court judge has dismissed the Securities and Exchange Commission’s (SEC) lawsuit against Richard Heart. Judge Carol Bagley Amon ruled that the allegations against Heart lack a connection to the United States.
Heart is known for founding the HEX token, the PulseX trading platform, and the PulseChain blockchain. The SEC initiated legal action against him in July 2023, claiming that the three tokens—Hex (HEX), PulseChain (PLS), and PulseX (PSLX)—were unregistered securities. The commission also accused Heart of misusing $12.1 million of investor funds to indulge in luxury items like sports cars, Rolex watches, and the world’s largest black diamond.
“The alleged misappropriation occurred through digital wallets and crypto asset platforms, none of which were alleged to have any connection with the United States,”
“Case dismissed. Thank you Judge Amon,”
Heart is an American citizen who has been living in Finland for several years. He faces serious charges there, including income tax evasion amounting to hundreds of millions of dollars from June 2020 to April 2024, as well as an assault charge from September. Reports suggest that the tax issues are connected to the launch of certain tokens, while the assault charge stems from an incident involving a minor in February 2021.
Finnish police suspect that he has left the country, and in December, an Interpol red notice was issued for him. In January, authorities in Finland confiscated 20 luxury watches from a third party that allegedly belonged to Heart.
All the while the law enforcement has searched for him, Heart has maintained a presence on social media. “If the haters really wanted to get me down they could raise more than the GETTEX:27M I did for medical research. Write free self help books better than my sciVive and Fix The World. Work in the courts for legal precedent for P2P publishing software. Found things that work flawlessly and become valuable,” he wrote on X in December.

UNIVERSOFSIGNALS| SUSHI: Key Levels and Market Outlook👋 Welcome to UNIVERSOFSIGNALS !
In this analysis, I want to review SUSHI for you. SushiSwap is a DeFi protocol operating in the DEX sector, with its token currently ranked 195th on CoinMarketCap and a market cap of $58 million.
📅 Weekly Timeframe
On the weekly timeframe, we can see a consolidation box between $0.534 and $1.959. Since 2022, the price has been fluctuating within this range, forming a large consolidation zone, with multiple touches to both the upper and lower boundaries of this box.
🔍 As observed, in the last bullish leg, the price broke above the box's upper boundary with a large weekly candle. However, it quickly retraced back into the range after being rejected at $2.734, resulting in a fake breakout.
🧩 Currently, the price is near the lower boundary of the range at $0.534. If this support level breaks, the price could initiate another bearish leg and move toward a new all-time low (ATL). On the other hand, if the upper boundary of the box is broken and price stabilizes above it, we could see an upward movement in SUSHI.
⚡️ The largest and most significant resistance ahead is at $20.444, which is the all-time high (ATH). Reaching this level would be extremely difficult, as it would require a significant increase in market capitalization, meaning a substantial capital inflow into the coin.
✨ Let’s now analyze the daily timeframe to gain more insight into price movement.
📅 Daily Timeframe
On the daily timeframe, as seen in the last bullish leg, the price bounced from the $0.534 support and moved upward. After breaking $0.803, strong bullish momentum entered the market. Additionally, RSI reaching the oversold zone contributed to a stronger bullish push.
🔽 Following this movement, the fake breakout at $1.855 led to the start of a corrective and bearish phase, with the price initially declining to $1.347.
📊 After breaking below $1.347 and retesting it as resistance, the price entered another bearish leg, reaching $0.803. Currently, after some range-bound movement around this level, RSI has exited the oversold zone, and the price seems to be retesting this level as resistance.
✅ If RSI re-enters the oversold zone, the price could drop further to the lower boundary of the range at $0.534, which would not be a good sign for SUSHI. As observed, buying volume has significantly decreased, and most traders in this market are sellers.
🛒 For spot buying, I recommend avoiding this coin for now and waiting for a clear bullish structure to form. At a minimum, SUSHI should start showing strength against Bitcoin.
🧲 From a USDT perspective, if the upper boundary of the range ($1.855) breaks, then $2.734 could serve as a trigger for a buying opportunity.
📝 Final Thoughts
This analysis reflects our opinions and is not financial advice.
Share your thoughts in the com

CAKE Triangle break out + nex supportThe triangle was broken and now on the way to test lower support at 2,03-1,88usd. All driven by BTC now, if BTC falls lower the probability of upward momentum grows and might be very quick for whole market. I´d avoid any short positions and rather DCA on the way down.

TradeCityPro | SUSHI: Key Levels and Market Outlook👋 Welcome to TradeCity Pro!
In this analysis, I want to review SUSHI for you. SushiSwap is a DeFi protocol operating in the DEX sector, with its token currently ranked 195th on CoinMarketCap and a market cap of $58 million.
📅 Weekly Timeframe
On the weekly timeframe, we can see a consolidation box between $0.534 and $1.959. Since 2022, the price has been fluctuating within this range, forming a large consolidation zone, with multiple touches to both the upper and lower boundaries of this box.
🔍 As observed, in the last bullish leg, the price broke above the box's upper boundary with a large weekly candle. However, it quickly retraced back into the range after being rejected at $2.734, resulting in a fake breakout.
🧩 Currently, the price is near the lower boundary of the range at $0.534. If this support level breaks, the price could initiate another bearish leg and move toward a new all-time low (ATL). On the other hand, if the upper boundary of the box is broken and price stabilizes above it, we could see an upward movement in SUSHI.
⚡️ The largest and most significant resistance ahead is at $20.444, which is the all-time high (ATH). Reaching this level would be extremely difficult, as it would require a significant increase in market capitalization, meaning a substantial capital inflow into the coin.
✨ Let’s now analyze the daily timeframe to gain more insight into price movement.
📅 Daily Timeframe
On the daily timeframe, as seen in the last bullish leg, the price bounced from the $0.534 support and moved upward. After breaking $0.803, strong bullish momentum entered the market. Additionally, RSI reaching the oversold zone contributed to a stronger bullish push.
🔽 Following this movement, the fake breakout at $1.855 led to the start of a corrective and bearish phase, with the price initially declining to $1.347.
📊 After breaking below $1.347 and retesting it as resistance, the price entered another bearish leg, reaching $0.803. Currently, after some range-bound movement around this level, RSI has exited the oversold zone, and the price seems to be retesting this level as resistance.
✅ If RSI re-enters the oversold zone, the price could drop further to the lower boundary of the range at $0.534, which would not be a good sign for SUSHI. As observed, buying volume has significantly decreased, and most traders in this market are sellers.
🛒 For spot buying, I recommend avoiding this coin for now and waiting for a clear bullish structure to form. At a minimum, SUSHI should start showing strength against Bitcoin.
🧲 From a USDT perspective, if the upper boundary of the range ($1.855) breaks, then $2.734 could serve as a trigger for a buying opportunity.
📝 Final Thoughts
This analysis reflects our opinions and is not financial advice.
Share your thoughts in the com

JUP demand zoneGood entry point if you think long-term solana based ecosystems are the ones you want to keep on your portfolio.

(BTC) bitcoin "head & shoulders, head & shoulders"BTC is not going to fall all the way down. The price is decreasing in price, yes.. Sentiment is not good right now from many points of view. There is more to come from BTC and there is always a strong urge to buy BTC by seekers who are only growing their wallet size holdings of BTC. 'What's in your wallet," the motto made famously by MasterCard, is befitting of BTC even if there are fewer people now that use BTC to make real transactions. The worst of cryptocurrency development over the last two years is in seeing almost no new companies offering a way to pay with BTC. Pay with BTC. Pay with Doge. Pay with XLM. Don't pay with credit cards that leak your identity and lose precious personal information in data breach hacks. The only way to reduce the dark market interests of criminals who sell hacked personal identity information is to use components of finance that resist hackers attempts to steal information from consumers. There is hardly anything that can be purchased using BTC, DOGE, XLM, et al. etc. in the real world.

Long Entry Signal for BADGER/USDT - Trading System Confirmation
Welcome!
Long entry signal for BADGER/USDT confirmed by the trading system
Based on our custom trading system rules, we have analyzed the current situation for BADGER/USDT:
MLR Crosses SMA: Even though the SMA is above the MLR, the entry still works because the price is over the BB center line and above the PSAR and 200 MA.
Price Over BB Center Line: The current price is above the Bollinger Bands Center Line (orange), which indicates that despite the MLR/SMA position, the price is in a position that typically favors a bullish trend.
PSAR Flips: The Parabolic SAR (PSAR), indicated by black dots, has flipped to bull, signaling a bullish trend as it is below the price.
Price Above 200-period MA: The price is also above the 200-period Moving Average (red), reinforcing a long-term bullish trend.
Given these conditions, the entry for a long position is supported by the price being over the BB center line, above the PSAR, and the 200-period MA, which are strong indicators for a potential upward movement.
Entry Strategy:
Action: Enter a long position on BADGER/USDT today, considering the favorable conditions from the price action relative to the BB center line, PSAR, and 200-period MA.
Risk Management:
Trailing Stop: Set your trailing stop at the current PSAR level, which will adjust dynamically with price movements to protect your position.
Standard Exit Strategy:
Exit: Continue to monitor for when the MLR crosses back above the SMA or if the price drops below the BB center line or the PSAR flips to bear. Any of these could signal a potential end to the bullish trend and an opportunity to exit the position.
This signal presents a potential trading opportunity according to our system's parameters, despite the usual MLR/SMA crossover not being in favor. Remember, always consider additional analysis and risk management practices before making trading decisions.
That is it

Univers Of Signals | AAVE : a DeFi project currently Let's take a general look at AAVE, a DeFi project currently with a market cap of $3.52 billion, ranked 32nd in coin market cap.
🔍 In the 4-hour timeframe, as you can see, there's a range box between $231 and $278, and the price has been oscillating within this box for about three weeks now.
📉 Presently, the price has hit a lower high compared to the $278 ceiling and has reached the $231 floor. Given the suitable bearish momentum, if the $231 level breaks, you could enter a short position. A break below 34.50 in the RSI would be a good confirmation for this move.
📈 On the flip side, if the price bounces back from the $231 floor and moves towards the $278 ceiling, breaking this level could provide a good opportunity to open a long-term long position. A risky long position could also be considered if the $251 level is breached, but be aware that it would carry significant risk.

ETHEREUM’S 2025—$ETH POWERS UP WITH ETFs & DEFIETHEREUM’S 2025— CRYPTOCAP:ETH POWERS UP WITH ETFs & DEFI
(1/9)
Good morning, Tradingview! Ethereum’s flexing muscle—ETFs and DeFi keep CRYPTOCAP:ETH humming 📈🔥. Institutional cash and altcoin grit shine—let’s unpack this crypto king! 🚀
(2/9) – ETF BUZZ
• Inflows: $SEED_TVCODER77_ETHBTCDATA:3B+ into ETH ETFs since July ‘24 💥
• Feb Surge: $500M+ in a week—BlackRock leads 📊
• Outlook: $10-15B by year-end?
Big players bet big— CRYPTOCAP:ETH ’s got juice!
(3/9) – DEFI DOMINANCE
• TVL: $120B locked in Feb ‘25—up from $78B 🌍
• Share: 60%+ of DeFi’s action 🚗
• Goal: $200B by Dec? Steno says maybe 🌟
Ethereum’s the DeFi backbone—unshaken!
(4/9) – ALTCOIN EDGE
• Altcoin Cap: $1.6T— CRYPTOCAP:ETH holds 10-12% 📈
• ETH/BTC: Climbing to 0.06—alt season whispers
• Vs. BTC: 57% dominance— CRYPTOCAP:ETH stands tall
Resilient king—altcoins rally behind! 🌍
(5/9) – RISKS ON RADAR
• Regs: Rules could snag ETF, DeFi growth ⚠️
• Rivals: Solana bites at CRYPTOCAP:ETH ’s heels 🏛️
• Price Dip: $2,632—off Jan highs 📉
Solid, but not bulletproof—watch out!
(6/9) – SWOT: STRENGTHS
• ETFs: $ 3B+ inflows—cash keeps flowing 🌟
• DeFi: $120B TVL—ecosystem champ 🔍
• Stake: 54M+ ETH locked—rock steady 🚦
CRYPTOCAP:ETH ’s the muscle in crypto town!
(7/9) – SWOT: WEAKNESSES & OPPORTUNITIES
• Weaknesses: $ 2,632 lags inflows—sentiment lags 💸
• Opportunities: $ 200B TVL, Pectra lifts 🌍
Can CRYPTOCAP:ETH zap to new heights?
(8/9) – CRYPTOCAP:ETH ’s ETF & DeFi run—what’s your vibe?
1️⃣ Bullish—King keeps ruling.
2️⃣ Neutral—Growth’s cool, risks hover.
3️⃣ Bearish—Rivals steal the crown.
Vote below! 🗳️👇
(9/9) – FINAL TAKEAWAY
CRYPTOCAP:ETH ’s humming—$ 3B ETFs, $120B DeFi, altcoin grit 🌍. $ 200B TVL in sight, but rivals lurk. Champ or challenger?

TradeCityPro | INCH: Delving into a Leading DEX Project👋 Welcome to TradeCityPro!
In this analysis, I want to review the INCH coin for you. It's one of the DEX projects in crypto, active in the DeFi space, and considered one of the successful projects in this category.
📅 Weekly Timeframe
As you can see in the weekly timeframe, after its launch, the price began a downward trend and is currently in a consolidation box between $0.2098 and $0.6270.
⚡️ The bottom of this box is a very important support, arguably the only and last support for this coin. Conversely, the top of this box, as you can see, is a very strong supply zone. The price has approached this area several times with high momentum, but it has been rejected each time and returned to the bottom of the box.
🔍 Currently, as you observe, the price, after being rejected from this level, has moved downward and reached the bottom of the box, where it has been ranging for about three weeks. If this bottom breaks, the price could move lower and set a new all-time low (ATL), which would worsen the project's situation.
📈 However, if the price can rise from this area, finally moving upwards and breaking the supply zone, it could successfully start its bullish trend after several years.
🚀 The targets for the bullish trend are initially at $0.8438 and then at $2.0175. The ATH area is at $7.1331, which seems far from the current price and out of reach unless the market cap of 1inch significantly increases.
📅 Daily Timeframe
In the daily timeframe, as we observe, we can see more details about the last downward movement. As you see, after entering the correction phase, the price first corrected to $0.3638. However, after stabilizing below this area, the next downward leg started, and currently, the price has reached $0.25 and has formed a small box between $0.25 and $0.2756.
🔽 For short positions, we have a very suitable trigger at $0.25, where if this area breaks, the price could move down to its main support at $0.2226.
✅ On the other hand, if this box that the price has formed breaks upwards and the price can stabilize above $0.2756, forming a higher low and higher high, we could say it has risen from the bottom of the box and could move higher.
💥 Overall, the price is in a very large weekly box, and any spot purchases and positions taken within this box are highly risky. So, be sure to not engage in excessive risk with this coin and wait until the large weekly box is broken either upwards or downwards.
📝 Final Thoughts
This analysis reflects our opinions and is not financial advice.
Share your thoughts in the comments, and don’t forget to share this analysis with your friends! ❤️

TradeCityPro | Deep Search: In-Depth Of LINK🔹What is Chainlink?!
🔹Chainlink is a decentralized oracle network that enables smart contracts to securely interact with real-world data, external APIs, and off-chain computations. Founded in 2017, Chainlink solves the "oracle problem" by providing tamper-proof, trust-minimized data for blockchain applications.
🔹Chainlink has become a critical infrastructure in the DeFi (Decentralized Finance) ecosystem, enabling hybrid smart contracts that leverage off-chain data. With partnerships in traditional finance, gaming, insurance, and enterprise solutions, Chainlink is positioning itself as the primary gateway between blockchains and real-world data.
🔹Chainlink’s Core Technology & Products
▪️ A. Decentralized Oracle Networks (DONs):
Chainlink’s oracle networks retrieve, verify, and deliver off-chain data to on-chain smart contracts in a secure and decentralized manner. These oracles solve blockchain’s lack of external connectivity, making real-world data accessible in DeFi, insurance, gaming, and enterprise applications.
B. Cross-Chain Communication (CCIP):
Chainlink enables cross-chain data sharing between public and private blockchains, allowing seamless communication and transfer of value across multiple networks.
▪️ C. Data Feeds & Market Insights:
Price Oracles: Secure on-chain price feeds for assets like BTC, ETH, stablecoins, and commodities.
Proof of Reserve: Verifies asset collateralization in real-time, crucial for stablecoins and wrapped assets.
Data Streams: Provides high-frequency market data for next-gen DeFi protocols.
▪️ D. Compute Services:
- Functions: Connects smart contracts to any API, enabling custom Web3 applications.
- Automation: Automates smart contracts with event-based triggers.
- Verifiable Random Function (VRF): Ensures secure randomness in gaming, NFTs, and lotteries.
🔹Chainlink’s Economic Model & Tokenomics
A. LINK Token Utility
The LINK token is the native cryptocurrency of the Chainlink ecosystem, used for:
🔹Paying node operators for retrieving, verifying, and delivering data.
🔹Staking to provide economic security and ensure data integrity.
🔹Governance and ecosystem incentives.
B. Staking & Security Mechanism:
Chainlink introduced staking as part of its Chainlink Economics 2.0 model to enhance security:
🔹Node operators must stake LINK to provide data services.
🔹Validators get slashed for incorrect or malicious data submissions.
🔹Delegated staking allows non-technical users to stake LINK via trusted operators.
C. Token Distribution
🔹ICO Price (2017): $0.11
🔹Total Supply: 1 billion LINK
🔹Circulating Supply: ~450M LINK (45% of total)
🔹Token Allocation:
-35% for ecosystem development and node incentives.
-35% sold in ICO/public sales.
-30% retained by Chainlink Labs for network growth.
D. Market Performance & ROI
🔹All-Time High (ATH) Price: $52.88 (May 2021)
🔹ICO ROI: 484.11x (+48,311%)
🔹Private Sale ROI: 587.5x (+58,650%)
🔹Total Funds Raised: $32M (ICO: $3M, Private Sale: ASX:29M )
🔹Some of Investors: Hashed Fund, Framework Ventures and Fundamental Labs
——
🔹Chainlink’s Adoption & Use Cases
A. Financial Services & DeFi
Chainlink secures billions of dollars in DeFi protocols, including:
🔹Aave (lending and borrowing)
🔹Compound (decentralized finance)
🔹Synthetix (synthetic assets)
🔹Uniswap (decentralized exchanges)
B. Asset Tokenization & Enterprise Adoption
Chainlink enables tokenization of real-world assets (RWA), integrating blockchain technology into:
🔹Traditional banking and payments
🔹Supply chain transparency
🔹Enterprise solutions (e.g., SWIFT, Google Cloud, FedEx, AccuWeather)
C. Gaming & NFTs
🔹VRF ensures fairness in blockchain gaming and NFTs.
🔹Major NFT & metaverse projects rely on Chainlink for secure randomness.
D. Insurance & Climate Markets
🔹Weather-based smart contract automation for crop insurance.
🔹Secure insurance claim processing using verified external data.
🗺Chainlink (LINK) Roadmap
Chainlink is evolving rapidly to enhance scalability, decentralization, and utility across blockchain ecosystems. The Chainlink 2.0 upgrade and Economic Model 2.0 are set to play crucial roles in the network’s future. Here’s a breakdown of Chainlink’s roadmap and upcoming developments.
A. Next-Gen Oracle Solutions
Chainlink 2.0 expands Decentralized Oracle Networks (DONs), introducing:
🔹Off-Chain Reporting (OCR) for better efficiency.
🔹Hybrid computation models for privacy and scalability.
🔹Fair Sequencing Services (FSS) to prevent front-running in DeFi.
B. Staking Expansion
🔹Staking rewards expected to start at 5% APY, paid via fees + emissions from the Chainlink treasury.
🔹Full staking implementation in Chainlink Economics 2.0 to ensure sustainable network growth.
C. Cross-Chain Integration & Layer 2 Adoption
🔹Chainlink plans deeper integration with Layer 2 solutions like Arbitrum & Optimism.
🔹Further adoption into non-EVM blockchains like Solana, Polkadot, and Cosmos.
🏦 Strategic Partnerships & Institutional Adoption
Corporate & Enterprise Partnerships: Chainlink has secured high-profile collaborations with:
-Google Cloud: Integrated Chainlink oracles for Web3 data verification.
-SWIFT: Exploring cross-border transactions using Chainlink.
-AccuWeather & FedEx: Providing real-world data for blockchain use cases.
-Associated Press: Integrating trusted news data into smart contracts.
🔹Advisory Team & Leadership
-Sergey Nazarov (CEO): Blockchain visionary, co-founder of SmartContract.com.
-Steve Ellis (CTO): Co-founder & lead engineer behind Chainlink.
-Eric Schmidt (Ex-Google CEO): Joined as technical advisor.
🔧Security & Consensus Mechanism
-Ethereum-based ERC-20 token with Proof-of-Stake (PoS) consensus.
-Delegated Proof-of-Stake (DPoS) & Proof-of-Authority (PoA) used for oracle security.
-Multi-layered decentralization ensures resilience against data manipulation.
🔹Market Outlook & Future Predictions
Competitive Edge:
-Most adopted decentralized oracle network.
-$75B+ secured across 1,000+ projects.
-Expanding beyond crypto into traditional finance & enterprise applications.
Challenges & Risks
-Reliance on Ethereum scalability.
-High competition from newer oracle solutions (e.g., --Band Protocol, API3).
-Adoption rate depends on broader DeFi growth.
👛Some of the wallets that support Chainlink
MetaMask
Ledger Wallets (Nano S & Nano X)
Exodus Wallet
WalletConnect
Rabby Wallet
Trust Wallet
Atomic Wallet
Coin98 Wallet
Trezor Wallet
Argent Wallet
—
🔹Platform for staking LINK
Stake.link
Chainlink
Stake.com
—-
Platform for providing LINK
🔹Retro
🔹Biswap
🔹Kujiro
🔹Mdex
🔹Tomb
🔹Ramses
🔹Honeyswap
🔹Uniswap
🔹Pancakeswap
🔹LFJ
🔹Pangolin
🔹Balancer
🔹Revenue and Staking
▪️ Since the beginning of February, Chainlink's revenue experienced a sharp decline followed by a notable recovery, rising from -0.015 to 0.06 Ethereum. Meanwhile, staking activity in 2025 has remained relatively stable at approximately 279,000 Ethereum, showing no significant fluctuations. Additionally, the increase in network fees highlights growing user engagement and heightened activity within the ecosystem.
🔹On-Chain Analysis of LINK
▪️ In the $18.48 to $19 price range, a significant number of LINK tokens are in loss, which could act as a resistance level. However, there is currently no substantial volume of coins in profit to establish strong on-chain support.
▪️ On a positive note, network activity is showing signs of recovery, with a rise in active and new addresses, reflecting increased user engagement. Additionally, 48% of LINK tokens are held by whales, a considerably higher percentage compared to other cryptocurrencies. This distribution makes price manipulation by whales more difficult, contributing to market stability.
▪️ From a supply and demand perspective, the recent price drop has led to increased demand from whales (addresses holding 10M–100M LINK), while retail investors have been selling. This redistribution of tokens from smaller holders to large investors could be interpreted as a bullish signal for the medium term.
✅ Now that we have reviewed the project, let's move on to the technical analysis of this coin
📅 Weekly Timeframe
As observed, after the conclusion of the 2021 bull run, LINK entered a correction phase and dropped to a low of $5.85. Upon reaching this level, it formed a very clean Accumulation Zone with a floor at $5.85 and a ceiling at $9.77.
🔍 After oscillating within this zone for about a year, LINK finally broke out towards the end of 2023, coinciding with Bitcoin’s new all-time high near $70,000. This upward move was robust, but following Bitcoin’s correction to a low of $54,000, LINK also pulled back deeply to $9.77, where it stabilized.
📊 The volume has been in favor of the buyers, and as the upward trend concluded and a corrective leg began, the volume decreased significantly. Once the volume reached its lowest, a large bullish candle entered the market, pushing the price up to a high of $30.16.
⚡️ Currently, as Bitcoin ranges and corrects, LINK is also undergoing a correction. The RSI oscillator shows that LINK has dipped below the 50 area, but as long as it remains above 42.88, I still view LINK’s momentum as bullish.
🛒 For buying opportunities, risky purchases could be considered upon confirming a break of $30.16 or a more substantial breakout at the ATH of $51.30. However, if the price heads back towards $9.77 and breaks this support, it could indicate that the bullish momentum and trend have fully concluded, potentially leading to new lows.
📅 Daily Timeframe
In the daily timeframe, let’s examine the price movement in more detail. There was an Accumulation Zone between $9.77 and $12.88. After breaking $12.88 and pulling back, the next bullish leg began, pushing the price up to $29.21—a significant resistance area where the price was rejected and entered a corrective phase.
✨ In the first corrective phase, the price moved down to the 0.382 Fibonacci level and, failing to set a new high beyond $29.21, broke lower beyond the 0.382 area. It is now at the 0.5 Fibonacci level.
🧩 Essentially, a price range box has been formed between the 0.5 and 0.382 Fibonacci levels. A break below this range could lead to further corrections, with the 0.618 Fibonacci level and the crucial $12.88 level as subsequent targets. If the price reaches $12.88, it would fully correct the entire bullish leg, signaling the end of the uptrend.
🔽 The critical trigger for entering a strong bearish momentum in this position would be a break below 34.49 in the RSI. If both this support and the 0.5 Fibonacci support are broken, it could lead to significant market panic.
👀 Conversely, if the price can rise above the 0.382 Fibonacci level and start a new bullish leg, breaking $29.21 could provide an excellent opportunity for a long position, even in spot markets.
📝 Final Thoughts
This analysis reflects our opinions and is not financial advice.
Share your thoughts in the comments, and don’t forget to share this analysis with your friends! ❤️

$AIXBT – AI-Powered Crypto Analysis Tool with Real Market Utilit💡 What is $AIXBT?
$AIXBT is an AI-driven analytics platform under Virtuals Protocol, integrating blockchain, AI, and big data for advanced market insights.
📊 Key Features:
AI-driven market analytics – Monitors Crypto Twitter & CoinGecko.
Trending narrative detection – Finds key narratives influencing market moves.
Alpha-generating insights – Uses AI to provide data-driven trade signals.
On-chain & sentiment analysis – Tracks 400+ Key Opinion Leaders (KOLs).
🔹 Built on: Base L2 (Ethereum) – Low fees, fast transactions.
🔹 Listed on: Gate.io, gaining liquidity & visibility.
🔹 Growing user base: 100K Twitter followers in 2 months.
🛠 Key levels to watch:
Sweep of $0.167 expected soon – setting up a potential long trade.
Downside risk: $0.08
Upside targets:
$0.3 - $0.43 = conservative/local peaks.
$0.75 - $1.00+ = possible in 2025 if market euphoria kicks in.
🤔 Is $AIXBT Worth Watching?
AI + crypto is a major 2025 trend.
Not a meme coin – real utility for traders.
Unique AI-powered sentiment & narrative tracking.
High volatility.
🚀 Bottom Line:
$AIXBT has a strong AI-driven concept but needs to prove itself in the competitive AI crypto sector. If market enthusiasm for AI tokens continues, this could be a major breakout play.
📌 Key trade idea:
Watch for liquidity sweep at $0.167 → long if price bounces back up immediately.

$VIRTUAL – AI x Metaverse x Blockchain
AI-driven gaming agents tokenized for shared ownership & transactions.
Agent-to-Agent Commerce Protocol (ACP) enables autonomous AI trading.
Runs on Ethereum & Solana, expanding interoperability.
Super APP launching soon—simplifying user interaction.
Market Outlook:
Reclaiming $1.06 = buy signal
Current structure looks weak—avoid knife catching.
Entered long at range low, targeting $1.71 & $2.66.
Will AI-powered virtual economies be the next breakout trend?

Cake support + triangle breakoutCake currently sitting at 0,618 fibo retracement 2,316usd from recent local high 3,4usd. This support holds strong for now. Possible breakout from triangle will lead to new uptrend with target 5,187usd. Breaking down will lead to lower support 2,016usd.
