Trader's Guide to Vertical Debit SpreadsThe strategies and ideas presented in this guide have been designed to provide you with a comprehensive program of learning. The goal is to guide you through the learning experience so you may be an independent, educated, confident and successful trader. There are numerous variations of traditional options strategies and each has a desired outcome. Some are very risky strategies and others require a considerable amount of time to find, execute and manage positions. Spreads are a limited risk strategy.
Spreads
Spreads are simply an option trade that combines two options into one position. The two legs of one spread position could have different expiration dates and/or different strikes.
Spreads can be established as bearish or bullish positions. How the spread is constructed will define whether it is bullish (rising bias) or bearish (declining bias).
Different types of spreads can be used for the same directional bias of the stock. For example, if the stock has a declining bias, a call credit spread or a put debit spread could be opened to take advantage of the same anticipated move down.
In this guide we will be talking about Vertical Debit Spreads, which are a limited risk strategy. Learning how to manage risk is as important as learning the details of a strategy.
Vertical Debit Spreads
A vertical debit spread is created when an investor simultaneously buys-to-open (BTO) one option and sells-to-open (STO) another option. The premium paid for the BTO is always greater than the premium received for the STO thus, creating a net debit from the trader’s account.
Example:
BTO a call using the May 180 strike for a debit of $7.57
STO a call using the May 190 strike for a credit of $3.42
Net debit for the spread is $4.15
The proper construction of a vertical debit spread is to BTO an at-the-money (ATM) strike and STO the strike that is 5 – 10 points further out-of-the-money (OTM). When opening a call debit spread, further OTM means a higher strike. When opening a put debit spread, further OTM means a lower strike.
Both legs are opened on the same underlying equity and use the same expiration month.
The Delta Ratio
Delta is a factor in how profitable a debit spread may be. When the underlying stock moves, the value of the options will change at the rate of the Delta. Delta values will be different for different strikes depending on how far out-of-the-money or in-the-money the strike is. Look at an options chain for the current expiration month. Find the Delta of the at-the-money strike and compare it to the Delta of a strike 20 points out-of-the-money. The ATM strike will always have a higher delta than the OTM strike. This means that the value of the ATM strike will change more quickly than the OTM strike, as the underlying stock moves.
When properly constructed, a debit spread is designed to take advantage of the Delta relationship between the long and short options. By STO a strike further out-of-the-money than the BTO strike, the long leg will increase in value more rapidly than the short leg. This is referred to as the Delta Ratio.
Put debit spreads are used when the stock shows a declining bias. Puts increase in value as the stock decreases in value. In this case, the long put would increase in value creating a profit. The short leg would increase in value creating a loss. However, as we learned earlier, due to the Delta Ratio, the long put is increasing in value faster than the short put is creating a loss. This will create an overall position profit as the stock moves down.
Here is an example:
Stock trading at 520 and has a declining bias.
BTO 520 put
STO 510 put
This spread creates a debit of $4.80
Stock declines to 510 causing the values of the puts to increase. The position can now be closed for a profit.
STC 520 put
BTC 510 put
The value of the spread has increased to $5.80. Since the stock declined in value, the put options are more expensive.
The spread was BTO for a debit of $4.80 and STC for a credit of $5.80 resulting in a $1.00 profit.
Call debit spreads are used when the stock shows a rising bias. Calls increase in value as the stock rises. In this case, the long call would increase in value creating a profit. At the same time, the short call would increase in value creating a loss. However, as we learned earlier, due to the Delta Ratio, the long call is increasing in value faster than the short call is creating a loss.
Stock trading at 500 and has a rising bias.
BTO 500 call
STO 510 call
This spread creates a debit of $4.80
Stock rises to 510 causing the values of the calls to also rise. The position can now be closed for a profit.
STC 500 call
BTC 510 call
The value of the spread has increased to $5.80. Since the stock increased in value, the call options are more expensive.
The spread was BTO for a debit of $4.80 and STC for a credit of $5.80 resulting in a $1.00 profit.
Risk and Reward on Vertical Debit Spreads
Reward
The maximum profit that can be earned from a vertical debit spread is equal to the width of the spread minus the cost of opening the spread. For a vertical debit spread to realize the maximum potential profit, both legs of the spread would need to expire in-the-money which means the position would need to be held until expiration.
I do not recommend holding positions until expiration. Short term movements in the stock/index plus limited time value decay provide opportunities to close out positions for a profit of about 10%. If a position is profitable and the trader decides to hold the position hoping for a bigger profit or in an attempt to carry the position to expiration, there is a good chance that the profit will disappear and the position could turn into a losing position. This also will increase the risk of assignment/exercise if trading an American style expiration.
A good way to lose money is to wait for a bigger profit
Risk
The maximum risk, or potential loss, from a vertical debit spread is the net debit (cost basis) of the spread (BTO leg debit minus the STO leg credit).
Example:
BTO 2765 call for a debit of $11.70
STO 2770 call for a credit of $8.30
Cost basis of the spread is $3.40
$3.40 is the maximum risk.
A maximum loss will occur when both strikes are out-of-the-money at expiration. Learning how to properly adjust positions will avoid this.
A trader establishes a bullish (call) debit spread when the chart indicates a rising bias. The breakeven point is the lower strike price plus the net debit. Referring to the example above, if the stock was at 2768.40 at expiration, there would be no loss and no profit.
Example of breakeven point on above debit spread:
Stock settles at 2768.40 at expiration
The 2765 strike is $3.40 ITM, the value of the strike has $3.40 of intrinsic value and no time value.
The 2770 call expires OTM worthless and you keep the 8.30 of credit as profit.
Since you do not want to exercise your right to own the stock, you sell the 2765 back at the price of $3.40. This results in a $8.30 loss. $11.70 BTO – $3.40 STC = $8.30 loss
You get to keep the original credit of $8.30 from the 2770 call. This netted against the $8.30 loss results in breaking even on the position.
A trader establishes a bearish (put) debit spread when the chart indicates a rising bias. The breakeven point is the BTO (higher) strike price minus the net debit.
Calculating the Return
The profit percent return is calculated by dividing the profit by the risk. After all, if the trade lost 100% of the risk that is the amount the trader would no longer have. In the example above, the net risk is $3.40. If the debit vertical spread trade resulted in a $1.00 profit, the percentage return would be 29.41% ($1.00 / $3.40). Lower risk drives higher returns relative to capital at risk.
American vs European Style Options
Most stocks and ETF’s are American style options. This means that if the buyer of an option chooses to exercise or assign their rights they may do so at any time prior to expiration.
Indexes such as SPX, NDX, and RUT are European style options. This means that any exercise or assignment may only occur at expiration.
Trading spreads on European style options, can alleviate the concern of early exercise/assignment. If both legs are ITM, they can only be exercised or assigned at expiration, which allows flexibility to continue to hold the position rather than take action to avoid assignment/exercise as would be suggested on American style options.
Opening a new Put Debit Vertical Spread
The following steps should be referred to when opening a new put debit vertical spread position:
1. Review the technical indicators on your chart and confirm there is a consensus between multiple indicators pointing to a declining bias.
2. Select an expiration that is one to three months out. One month is generally the minimum time to expiration you want to use. Building time into the position is advised in case it needs to be managed. The sweet spot for opening new positions is two months to expiration.
3. BTO the at-the-money (ATM) put strike. BTO the strike that is closest to the money. When the stock/index is trading between strikes, BTO the first strike higher than the current price of the stock.
4. STO the strike that is 10 points further out-of-the-money (OTM). With a put spread, further OTM means a lower strike.
BTO ATM and STO 10 points further OTM will create a debit. Generally, when properly constructed, the debit will be in the range of $4.00 - $6.00.
5. When placing the order, always use a Limit order. A limit order specifies to the market the amount of the debit you will accept. A limit order will be filled at the specified limit or lower. Market orders should not be used.
6. With some stocks and indexes, the difference between the bid and ask is quite large. The broker will usually give you a quote called the “Mark”. This is the midpoint between the bid and ask. It is the price you should start with when submitting your limit debit order.
7. Calculate the risk of the position. Cost basis of position is risk. So a position with a debit of $4.50 would have a risk of $4.50.
8. Use the risk number to determine the number of contracts to open. Risk x 100 = the investment required for each contract. With $4.50 of risk and one contract, the total investment would be $450 ($4.50 x (1 contract x 100 shares per contract)).
9. Once you know the total investment required per contract, you can decide how many contracts to trade based on the size of your portfolio. Generally, allocating 5% of the total portfolio to each trade is good risk management. Smaller account sizes may require a higher investment per trade but should not exceed 10%.
10. After the trade has been opened, place a Good-til-Canceled (GTC) order to close the position for a $1.00 profit. A GTC order will stay active until market conditions are such that the position can be closed for a $1.00 profit. GTC orders execute automatically and do not require you to be in front of your computer to take advantage of the profit opportunity.
Delta

Air lines are bullish - DELTA✈️ Delta Air Lines ✈️
Another promising stock. Also starting to grow. Will be lucky to catch the pullback. Potential ~60%
🛒 Buy zone 27.3 / 26.2
🎯 Targets 32.6 / 35.5 / 44

Be a market makerDelta Neutral trade.
Let's make some money off option premium/decay.
EWWxVix/100xSqRt (DTE/365)=2.45 point swing between now and Sept 11

VIX and stock market crashes I want to discuss why I use the trend in the VIX index as an indicator for downside risk.
When the VIX is trending higher, I interpret that as increasing downside risk for stocks. My reasoning is as follows.
I use the VIX Index as an indicator for real put demand. I say real demand, because traders buying and selling intraday is not what I’m looking for.
If VIX is trending higher, it signals to me that larger risk-taking market participants are hedging the downside.
When long puts, you’re also long volatility (demand for puts = long volatility demand).
When those market participants buy put options, market makers (not risk takers) selling those puts needs to hedge.
They do so by delta hedging, which is, in short, shorting the underlying security.
When volatility increase, the delta of an OTM option rise. This is logic: an OTM option is more likely to go in-the-money (ITM) when volatility is higher.
This is why you sometimes will see sharp sell-offs and market crashes: as the market starts to fall, market makers have to short more of the underlying to stay market neutral.
This is causing a self-reinforcing cycle.
So, when I watch the VIX intraday, I look out for the VIX trending higher. If so, the stock market is vulnerable.
If the VIX is trending down, as on Friday, I’m not anticipating a sharp sell-off into close.

Delta Airline - Technical Analysis - DALTechnical Analysis:
Based on technical analysis, the idea is to hold. Prices are moving in a sideway trend and there are not a lot of signal for a short or long term investment.
Fundamental Analysis
United, American, Delta, Southwest — Airline stocks rallied on Wednesday as positive vaccine news gave investors confidence about a return in air travel demand. American Airlines jumped 7.7% and United Airlines rose more than 6%. Southwest and Delta gained 5% and 4%, respectively. Alaska Air Group gained 5.2%.

✌ Told You To Short The Break. (DAL)💰 LET'S GET INTO SOME DELTA AIRLINES ANALYSIS!💰
1️⃣ First off SMASH that LIKE BUTTON & Give us a FOLLOW for DAILY ANALYSIS! ❤❤❤
(Overall Market Sentiment) 🐻 Bearish
- 12 Hour Chart
- Red Engulfing Candle
- 3/3 EMA DOTS Red
Told you specifically to watch that uptrend support, if broke to go short. Now we approach stage 2 of support, the horizontal level. Break below that we can sit on position for further selloff confirmation. DAL almost down 8% in last market session. 3day is also shifting with a red doji.
Best of luck to you and all of your trades this week! 🤜
Drop your charts and comments down below, share with us what you think is going on in the markets! ❤❤❤
Thanks for checking out our analysis! ✌😁✌
🥇MLT | MAJOR LEAGUE TRADER

Trader's Guide to Options Part 2The information in this guide is intended to get you started with your understanding of options, the terminology, and their basic characteristics. In addition to this guide, it is recommended that you study all information available under the education section of your broker’s website. Most brokers who cater to options traders provide good information that will help you learn.
Types of Options:
Call Options:
Call options increase in value when the underlying stock rises.
Buyers of calls have the right, without any obligation, to buy the underlying stock at the strike of the options contract. They retain their right until the option no longer exists, defined by the expiration date.
Call buyers anticipate the value of the underlying stock will rise. When it does, the value of the option will also increase at approximately the rate of the Delta. Buyers pay for the right to buy the stock in the future, sometime before expiration of the option. When buying the option, they pay the ask price. The premium they pay is less than buying the stock, yet they will still benefit from any appreciation in the value of the stock.
Say you wanted to buy XYZ stock because you think it is going to move up from its current price of $84. Instead of buying the stock a trader could buy a call option for a fraction of the price of the stock. Remember, all the trader is doing is buying the right to buy the stock without any obligation to actually buy it. The option only costs $4.00 for the right to buy the stock at some future date. Buying 1,000 shares of the stock would require $84,000 but buying 10 options contracts would only cost $4,000.
Call Options – The Sellers…
Sellers of call options are selling to someone else the right to buy the underlying stock from them. When/if the buyer chooses to buy the stock from the seller, (remember, the buyer has no obligation to do so) it is referred to as an exercise…the buyer is exercising the right to buy the stock. The seller is obligated to deliver the stock to the buyer. A seller’s obligation ends when the stock is exercised, the option expires, or the option is bought to close (BTC).
Call sellers receive a premium from the buyer. The buyer is paying the seller for the right to buy the stock in the future. Sellers want the price of the stock to go down. Why? If the price goes down, the buyer will have no reason to exercise since they could buy the stock for less at the current market price. In this case, the seller gets to keep the premium paid by the buyer.
So, what does this mean in plain English? The concept of a call option is present in many situations. For example, you discover a painting that you would love to purchase. Unfortunately, you will not have the cash to buy it for another two months. You talk to the owner and negotiate a deal that gives you an option to buy the painting in two months for a price of $1,000. The owner agrees, and you pay the owner a premium of $50 for the right to buy the painting.
Consider two possible scenarios that can impact the value of this “option”:
Scenario 1: It is discovered that the back of the painting has a signature of a famous artist, which drives the value of the painting up to $10,000. Because the owner sold you an option which gives you the right but no obligation to purchase the painting at the previously agreed price, he is obligated to sell the painting to you, the buyer, for $1,000. The buyer would make a profit of $8,950 ($10,000 value – $1,000 purchase price – $50 for the cost of the option).
Scenario 2: After closer review of the painting, it is discovered that the signature on the back is not of a famous artist, but is the brother of a famous artist. This actually drives the value of the painting down to $500. If the buyer exercised their option to purchase the painting it would cost $1,000. This would not make sense because the buyer could instead just buy it at “market price” for just $500. Since the buyer had no obligation to purchase based on the option contract, the agreement, or contract, would just expire and the buyer would lose the $50 premium paid.
The example demonstrates two important points. When you buy an option, you have a right, but not an obligation, to do something. You can always let the expiration date pass, at which point the option becomes worthless. If this happens, you lose 100% of your investment, which is the money you paid for the option.
Put Options
Put options increase in value when the underlying stock decreases in value.
Buyers of puts have the right, without any obligation, to “put” the underlying stock to someone else at the strike price of the options contract. They retain their right until they sell to close (STC) the option or it no longer exists, defined by the expiration date.
Put buyers anticipate the value of the underlying stock will go down. When it does, the value of the option will increase at approximately the rate of the Delta. Buyers pay a premium for the right to be able to put (sell) the stock to someone else in the future, sometime before expiration of the option. When buying the option, they pay the ask price.
Say you thought XYZ stock is going to move down from its current price of $84. Buying a put with a strike of $85 gives the buyer the right in the future to sell or put the stock to someone else at $85. So, if the stock declined to $75, the buyer of the option could buy the stock at $75 and immediately exercise their right to sell/put the stock at $85, making a $10 profit. Remember, all the trader is doing is buying the right but has no obligation.
Put Options – The Sellers…
Sellers of put options are selling to someone else the right to sell/put the underlying stock to them. When/if the buyer chooses to put their stock to the seller, this is referred to as being assigned……the buyer of the put option is assigning the stock to the seller. The seller is obligated to buy the stock based on the strike price of the contract. A seller’s obligation ends when the option expires or the option is bought to close (BTC).
Put sellers receive a premium from the buyer. The buyer is paying the seller for the right to sell the stock to the seller in the future. Put sellers want the price of the stock to go up. Why? If the price goes up, the buyer will have no reason to assign the stock since they could sell the stock for more at the current market price. In this case, the seller gets to keep the premium paid by the buyer.
Exercise and Assignment
Most stocks and ETF’s are American style options. This means that if the buyer of an option chooses to exercise or assign their rights they may do so at any time prior to expiration.
Indexes such at SPX , NDX and RUT are European style options. This means that any exercise or assignment may only occur at expiration.
Who wins when the stock moves?
1. Buyers of Calls – win when the stock goes up
2. Sellers of Calls – win when the stock goes down
3. Buyers of Puts – win when the stock goes down
4. Sellers of Puts – win when the stock goes up
Are you new to options trading? Stay tuned for Part 3 of Trader's Guide to Options which will include in-the-money, at-the-money, and out-of-the-money options as well as the reality of trading.

✈ Delta Air Lines Test Support. (DAL)💰 Man these airline stocks are in nice setups for some serious plays.
Almost identical to Boeing as we are now sitting right above the long term support green line.
If we break above the red line that we are currently under that would be a breakout attempt to go long. Break below green we look for a short.
Line up the ema dots and the Crossover strategy candles for a breach and color confirmation. Use previous break level as stoploss.
Best of luck, 🎲🎲
🥇MLT | MAJOR LEAGUE TRADER


SPX x VIX /100 x SqRt( DTE /365)SPX x VIX /100 x SqRt( DTE /365)
3214x27/100xSqRt(6/365) = 109 point swing within 6 days

Delta Airlines Post COVID 19 thoughts June 2020If looked from the perspective of Fibonacci... chances are DAL prices during COVID 19 align with a 78% retrace line. Those also seem to match resistance around the initial trading values of this stock.
There is a good chance that during June and follow on months, this price will continue to grow and test the $50 price. At least from my perspective. Whether if it only tests the $50 to later come back down or just go back to previous price ranges, there may be a profit benefit here. The next months behavior really depends on what is going to happen around the Pandemic itself and associated travel restrictions. As well as how humans may fear traveling in the short term. It seems that a buy at current price range may reward with short term growth. If it happens, it can potentially be protected with a sell limit in case prices fall again.
Another strategy may be to buy and just sell with the price hits the $50 range. It'll all depend on each individual's preference: Do you want the shares for the long term (and take advantage of current bargain prices)?; Or do you want to profit with volatility?

Delta Airline - Technical AnalysisDelta Airline - The idea is to go long.
Wait if there will be a price return/retracement up to the trendline before buying

Delta Airlines key level on $24Delta is a buy.
Price action suggests not only having bottomed, but is already recovering.
As long as $24 holds, Delta is a buy.

DAL: Potential Short Term Bullish Reversal 1M, 1D (Jun. 01)X Force Global Analysis:
In this analysis, we take a purely technical approach to Delta Airlines (DAL), exploring signs of the stock being oversold, as well as potentially bullish reversal signals demonstrated on the monthly and daily charts.
Monthly Chart
- On the monthly chart, we have counted clear Elliott Waves
- Since 2015, Delta Airlines has been forming a bearish rising wedge pattern
- Moreover, we could spot an extended bearish divergence, with prices forming higher highs, while the indicators formed lower highs
- The Relative Strength Index (RSI) formed lower highs, as well as the Moving Averages in the Moving Average Convergence Divergence (MACD)
- Within the bearish ascending wedge, we could count Elliott Triangle Waves (ABCDE), leading to a breakdown triggered by the Corona Virus (Covid-19)
- Currently, technicals demonstrate that the stock is oversold, and under extended.
- The RSI demonstrates that DAL is at oversold regions
- The MACD shows historical bearish histograms
- However, despite the huge bearish pressure, we can also see signs of a short term potential reversal through candlestick patterns
- The current candle is forming a dragonfly doji candle, in which we see a long lower tail, and a small upper tail, with the candle close close to the open value
- Combining this with Elliott Waves, it could be said that we are in a downtrend counting Elliott Impulse waves (12345)
- This dragonfly doji candle could be the start of a short term trend reversal for wave 4
- While we have failed to break and close above the 0.618 Fibonacci retracement support, it's important to note that we have secured a historical support at $22.45
Daily Chart
- When we zoom into the daily chart, we see clearer signs of a short term bullish reversal
- We have been consolidating within a bullish descending wedge pattern after a severe drop
- Prices have broken out of the falling wedge, as we are seeing a small pullback
- We can also spot a clear bullish divergence, with lower lows on the price, and higher lows on the indicators
- The RSI demonstrates great strength, trading at neutral levels
- The MACD also shows that the trend is backed by momentum, as it creates a steady uptrend without any death crosses
- We can spot a lot of gaps ranging from $20 up to $56
- Despite the high trading volume, the current range starting from the drop was extremely choppy
What We Believe
Combining the evidence suggested in the daily chart with the analysis of the monthly chart, a probable case would be a further rally up filling the upper gaps at $30 ranges, completing wave 4 on the monthly. From that point, we could see further correction, filling the gaps located below the current price, before we see a mid-term trend reversal leading to a bullish rally to fill the gaps above. While it's important to also take into consideration the fact that Delta Airline's fundamentals have also been heavily affected by Covid-19, technical demonstrate a high probability for a short term bullish trend reversal.
Trade Safe.


America’s #1 Airline - Delta LongLadies and gentlemen please stay in your seats until we reach 20,000 feet 😄

Delta Airline - Technical AnalysisThe breakout of the top trendline and the stochastic might suggest a buy signal (Check France -KML Airlines , Ryanair , - all European company that have opened high, as well as LSE:IAG .
Perhaps, Delta will do the same.

Nearing Speculative Buy PointAirlines have been dumbstruck by this health crisis and many have lost all the stock gains since the financial crisis. That being said... we are still going to use airplanes right? Maybe they'll need to update health and safety procedures and spend a little more money on cleaning the planes, but we don't really have another feasible option for long distance travel, SOO... Future Demand exists.
The descending wedge pattern we've been in since mid-March may be a reversal pattern. I would not recommend entering a long trade until we get confirmation of a reversal on the shorter time frame and a daily break out of this wedge pattern.

Delta Air: $21.85 | The MEMO is OUT defined no middles seats among other checklist
that is certainty to be back in business...
-
looking forward for the oracle to buy up or upsize
from 0 to 10% ownership

2020 - the year the digital separates from industrial economyCheck out the different valuation of new, digital enterprises compared to conventioal, industiral age companies in 2020. It shows that our old, heavy industrial age is coming to an end and will be replaced by new information and collaboration economy.

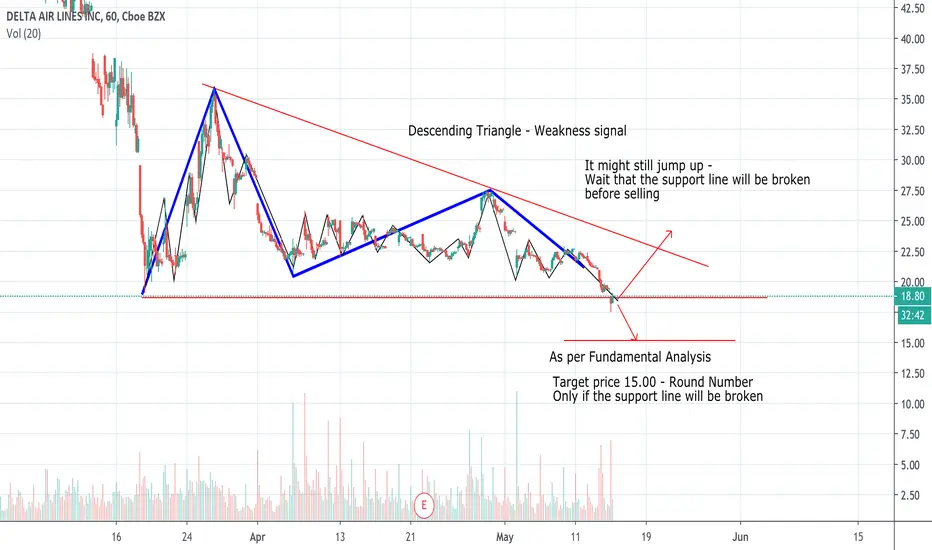
Delta Airlines - DAL Technical AnalysisThe prices are moving sideways with a weakness signal (Descending Triangle) - Based on probabilities and on Fundamental Analysis (Virus still with us) the idea is to go short.
Target price 15.00 (Round Number) - Only if the support line will be broken.
I think that it is too long to start thinking to invest for a long term investment.
#DELTAAIR #DAL Can Have A Little Upwards Bounce In Weekly ZoneTraders, This stock price is not looking good. But we are reaching a zone where it Can Have A Little Upwards Bounce In Weekly Zone.
P.S. (This is for education only. Not a financial advice or signal.)

DAL - The Airlines Are Not Looking to HotChecking Back in with Delta Airlines. Check out our previous analysis on these as you can see how we've been playing them and get an overall feel of the direction we're going. Our previous posts provide some detail towards our positions.
Short and Sweet Fundamentals:
1. Delta just suspended flights to 10 major airports through at least September: Chicago Midway, Oakland International Airport, Hollywood Burbank, Long Beach, T. F. Green International Airport, Westchester County Airport, Stewart International, Akron-Canton, Manchester-Boston Regional Airport and Newport News/Williamsburg International Airport.
2. DAL is trying to cut losses anywhere possible as they're burning through $50-$60 million per day.
3. At current pace, they're scheduled to run out of the Stimulus $ by the end of June.
Technical:
1. We have a bearish pennant. There was a clear break and a retest.
2. If you entered the short position on the break where we have the purple circle on the chart, we're looking to play this down to the following targets:
Target 1: $17.09
Target 2: $12.67
Target 3: $6.41
I would keep a trailing 4-5% stop loss on this one as we feel price could get volatile. The trailing stop will keep you position going if DAL tanks.
Not to leave the bulls hanging out to dry, they would like to see a Double Bottom at $19.00 area and a reversal (unlikely, but anything is possible when the FED is printing). As we've mentioned before, we're personally not long on airlines until we start seeing people fly again.
Hit us with a like and a follow for more updates. Cheers!
Disclaimer:
I do not provide personal investment advice and I am not a qualified licensed investment advisor. I am an amateur investor.
All information found here, including any ideas, opinions, views, predictions, forecasts, commentaries, suggestions, or stock picks, expressed or implied herein, are for informational, entertainment or educational purposes only and should not be construed as personal investment advice. While the information provided is believed to be accurate, it may include errors or inaccuracies. I will not and cannot be held liable for any actions you take as a result of anything you read here.
Conduct your own due diligence, or consult a licensed financial advisor or broker before making any and all investment decisions. Any investments, trades, speculations, or decisions made on the basis of any information found on here, expressed or implied herein, are committed at your own risk, financial or otherwise.
