#Copper #Elliot #D.zElliott wave 4 is over and we are completing wave 5. The price reacts to the demand zone at the same time.
int:4/3146
sl:4/2761
Demandandsupplyzones

Gold Outlook Today we have experienced a new over purchase manager index PMI which has shown pretty much data that was the reason gold has moved up and USD has dropped now as the news is over and price is forming a resistance over 2630 physiological level also price is consolidating between 2615 to 2630 level which probably be making a flag pattern which is a bullish continuation pattern now we will wait for break above 2630 and break below 2615 then we will act accordingly
Thanks

A Simple analysis on NIFTY PSUBANK IndexA very simple Demand Supply analysis with the help of RSI + EMA'S.

Ontology | Long Term Profits PlanHello traders!
At this very moment, while we have BTC ranging, there are a lot of good opportunities from coins that have dropped a lot! ONT is one of the beautiful gems that hasn't moved yet as it should be. We are very early, and here's my plan of action:
1) Price has bottomed out, and we can notice the range and size of the candles in the lowest demand zone got extremely small and condensed, which means volatility is contracting. There is definitely going to be a huge expansion, and we want to be early before this happens! So, make sure to get a position on the Demand zone as shown on the chart.
Possible confirmations would be:
1) a breakout of the 0.51 price mark if you want to play a conservative and higher probability trade.
2) Also, make sure there is a very fully closed candle above this price.
2) TARGETS: We have a very strong supply zone in which price has struggled and triggered a sell-off right away, so 2.5- 3 would be a top seller zone. If this zone gets pierced through successfully, then sit back, my friend, because ONT is taking a ride to the ATH.
Chart is very clean and clear, too. The ATH target has no other obstacles other than the 2.5–3 mark.
This idea is to spot for the long term. This asset is still in balanced mode; there hasn't been a breakout of the range yet. However, it's worth noting that we are sitting in a demand zone, which is a very beautiful and rare opportunity to have.
I hope you find it useful and are able to take advantage of this idea.
Kina Tip of the Day: Take profits partially even when they don't seem much because, in the long run, they will grow in a balanced way with the rest of the portfolio.
Keep it shiny ⭐
Kina, The Girly Trader

WIPRO - The IT sector pick with Minimal Downside Risk!Overview:
- Entry Point: Current Market Price (CMP) 475
- Target: Around All-Time High (ATH) 740
- Risk-Reward Ratio: With a downside risk of just 10% and aiming for a 50% upside, this trade offers an impressive 1:5 RR ratio.
Aiming for a significant upside with well-managed risk. Let's see if we can capture this opportunity right!
Stay tuned for updates and trade safely! Happy trading!
Disclaimer: This is NOT a buy/sell recomendation. This post is meant for learning purposes only. Please, do you due diligence before investing.
Thanks & Regards,
Anubrata Ray

Revealing My Top Gold Trading Secrets for Huge Profits!In this video, I reveal my top trading secrets for making huge profits in gold trading (XAU/USD). This educational content will cover key technical analysis techniques and strategies that I frequently use in my charts, as well as valuable insights into trading mindset and proper risk management. Let's unlock the potential of your trading skills together!
Technical Approach:
In this educational segment, we'll focus on the core technical analysis principles that I use to make informed trading decisions. Here's a detailed breakdown of my approach:
Identifying the Trend:
Uptrends and Downtrends: Learn how to recognize market trends using higher highs and higher lows for uptrends, and lower highs and lower lows for downtrends.
Trendlines: Use trendlines to connect the highs and lows of price movements, helping to identify the direction of the trend and potential reversal points.
Support and Resistance Levels:
Support Levels: Identify areas where the price tends to find support as it falls, acting as a floor preventing further decline.
Resistance Levels: Identify areas where the price tends to find resistance as it rises, acting as a ceiling preventing further ascent.
Historical Price Action: Use past price movements to pinpoint key support and resistance levels that the market respects.
Liquidity Zones (LQZ):
Definition: Liquidity zones are areas on the chart where there is a high concentration of trading activity, often leading to significant price movements.
Identification: Learn how to spot these zones using volume profiles, order flow analysis, and historical price action.
Trading Strategy: Use liquidity zones to identify potential entry and exit points, as they often precede major price moves.
Volume Analysis:
Volume Spikes: Understand how volume spikes can indicate strong buying or selling interest, confirming the validity of price movements.
Volume Trends: Analyze volume trends to gauge the strength of a price trend and anticipate potential reversals.
Entry and Stop Loss Strategies:
Breakouts and Pullbacks: Enter trades on confirmed breakouts above resistance or below support, or on pullbacks to key levels within a trend.
Trailing Stop Loss: Implement a trailing stop loss to lock in profits as the trade moves in your favor, adjusting the stop loss level as the price progresses.
Mini Lessons: Mindset:
Patience and Discipline:
Patience: Wait for the right trading setups that meet your criteria, avoiding impulsive decisions.
Discipline: Stick to your trading plan and rules, even when the market becomes volatile or unpredictable.
Emotional Control:
Stay Calm: Keep your emotions in check to avoid making irrational decisions based on fear or greed.
Mindfulness: Practice mindfulness techniques to remain focused and calm, especially during stressful trading situations.
Proper Risk Management:
Position Sizing:
Risk Per Trade: Limit the amount of capital you risk on any single trade, typically 1-2% of your trading account.
Position Size Calculation: Calculate your position size based on the distance to your stop loss and your risk tolerance.
Risk-Reward Ratio:
Target Ratio: Aim for a risk-reward ratio of at least 2:1, meaning your potential profit should be at least twice your potential loss.
Trade Evaluation: Evaluate each trade based on its risk-reward ratio before entering, ensuring it aligns with your trading strategy.
By incorporating these technical strategies and mindset principles, you can enhance your trading performance and increase your chances of success in the gold market. Stay tuned for more educational content and trading insights!

JK PAPER - My observation & overview! - 30% upside!!!Overview & Observation:
1. Moving with Weekly Demand.
2. Good volume support.
3. Strong trendline support
4. Healthy breakout candle.
Trade Plan:
1. It is already close to targets for the structure it gave BO.
2. Either wait for a retracement for buying or ride the trend with an aggressive entry at CMP with 10% as a safe SL.
- Stay tuned for further insights, updates and trade safely!
- If you liked the analysis, don't forget to leave a comment and boost the post. Happy trading!
Disclaimer: This is NOT a buy/sell recommendation. This post is meant for learning purposes only. Please, do your due diligence before investing.
Thanks & Regards,
Anubrata Ray

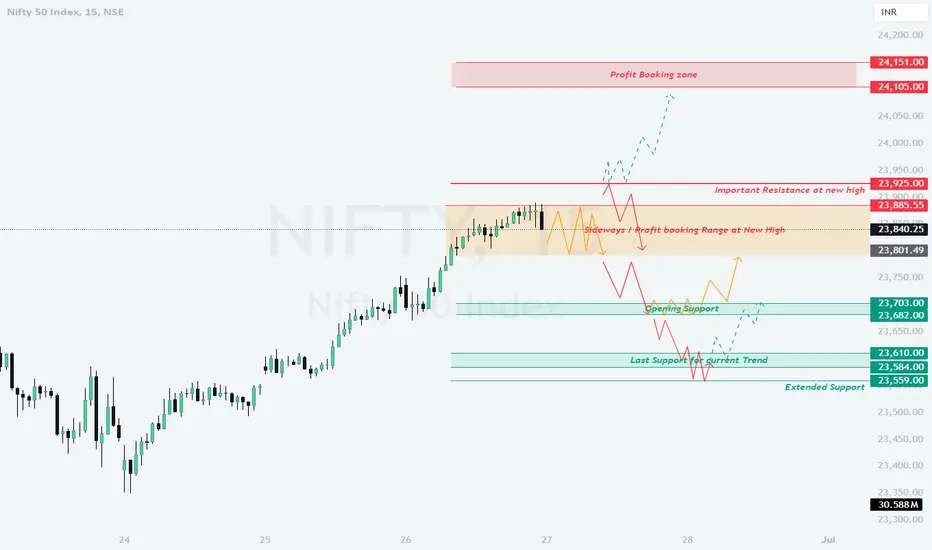
NIFTY : Trading Levels and Plan for 27-Jun-2024Here is a detailed trading plan for NIFTY Index on 27-Jun-2024 considering various opening scenarios. The plan includes steps for Gap Up, Flat, and Gap Down openings.
**Scenario 1: Gap Up Opening (100+ points)**
**Initial Action:** Monitor the price action and volume around the important resistance zone at 23,925.00 - 23,885.55.
**Profit Booking Zone:** If the price sustains above 24,105.00, look for opportunities to book profits.
**Resistance Rejection:** If the price faces rejection from the resistance zone (23,925.00 - 23,885.55), expect a pullback towards the opening support at 23,703.00 - 23,682.00.
**Support Confirmation:** If the price holds above the opening support zone, consider entering long positions with a target towards the resistance zone again.
**Breakdown:** If the price breaks below 23,682.00, expect a further decline towards the last support of the current trend at 23,610.00 - 23,584.00.
**Scenario 2: Flat Opening**
**Initial Action:** Observe the price action and volume in the sideways and profit booking range (23,885.55 - 23,801.49).
**Breakout Entry:** If the price breaks above 23,925.00 with strong volume, enter long positions targeting the profit booking zone (24,105.00 - 24,151.00).
**Range Trading:** If the price remains in the sideways range (23,885.55 - 23,801.49), consider scalping opportunities within this range.
**Support Test:** If the price drops towards the opening support (23,703.00 - 23,682.00), look for a reversal signal to enter long positions.
**Breakdown:** If the price falls below 23,682.00, expect a move towards the last support of the current trend at 23,610.00 - 23,584.00.
**Scenario 3: Gap Down Opening (100+ points)**
**Initial Action:** Evaluate the price action and volume around the opening support at 23,703.00 - 23,682.00.
**Support Reversal:** If the price finds support and reverses from this zone, consider entering long positions targeting the sideways range at 23,801.49.
**Breakdown Continuation:** If the price fails to hold the support and breaks below 23,682.00, prepare for a further decline towards the last support of the current trend at 23,610.00 - 23,584.00.
**Extended Support:** In case of further weakness, watch the extended support zone at 23,559.00 for potential reversal opportunities.
**Recovery Signal:** If a recovery signal appears above the last support zone, consider entering long positions targeting the opening support again.
**Summary and Conclusion**
For 24-Jun-2024, closely monitor the key levels and price action for potential trading opportunities. In case of a gap up opening, watch the resistance zone and look for profit booking opportunities. For a flat opening, trade within the sideways range and look for breakout or breakdown signals. In the event of a gap down opening, focus on the support levels for potential reversals or continuation patterns.
**Disclaimer:** I am not a SEBI registered analyst. This plan is for educational purposes only and not an investment advice. Always conduct your own research and consult with a professional financial advisor before making any trading decisions.
Good luck with your trading on 27-Jun-2024!
BANKNIFTY - Trading Levels and Plan for 26-Jun-2024Considering the chart and various opening scenarios, the following detailed trading plan is formulated for the Nifty Bank Index on 26-Jun-2024. The trading strategies are based on three opening scenarios: Gap Up, Flat, and Gap Down, with a gap opening threshold of 150+ points.
Gap Up Opening (150+ points):
If Nifty Bank Index opens above 52,800:
- Wait for a pullback towards the "Sideways / No Trade Zone" around 52,670. If the index holds this level, initiate a long position.
- Target 53,082 initially, followed by 53,260 and 53,492 (Profit Booking Zone).
- Place a stop loss below 52,670.
If the index opens between 52,670 and 53,000:
- Look for a retracement towards 52,670 and observe price action. If support is confirmed, enter a long position.
- Target the profit booking zone at 53,082 and 53,260.
- Stop loss should be placed below 52,441.
Avoid entering trades directly at the opening and wait for confirmation of support or resistance levels.
Flat Opening:
If the Nifty Bank Index opens around 52,630:
- Monitor the price movement in the first 15-30 minutes.
- If the index moves above 52,670 and sustains, enter a long position targeting 53,082 and 53,260.
- Stop loss can be set at 52,441.
If the index drops below 52,441 after the opening:
- Look for a shorting opportunity targeting 52,292 and 52,178 (Buyers Support at BoS).
- Stop loss should be placed above 52,670.
Avoid trading within the "Sideways / No Trade Zone" until a clear direction is established.
Gap Down Opening (150+ points):
If the Nifty Bank Index opens below 52,441:
- Wait for a pullback towards 52,441. If the index faces resistance, initiate a short position.
- Target 52,292 and 52,178, followed by 52,059 (Buyers Support at BoS).
- Place a stop loss above 52,670.
If the index opens between 52,178 and 52,441:
- Look for a retest of 52,178. If support holds, consider a long position.
- Target 52,441 and 52,630.
- Stop loss should be placed below 52,059.
Avoid entering trades directly at the opening and wait for confirmation of support or resistance levels.
Summary and Conclusion:
The trading plan for 26-Jun-2024 focuses on key levels of 52,670 (Sideways / No Trade Zone), 52,441, and 52,178 (Buyers Support at BoS). For a Gap Up opening, the strategy is to look for long opportunities after a pullback to support levels, targeting the profit booking zone. For a Flat opening, monitoring the initial price action is crucial before taking positions. For a Gap Down opening, the approach is to look for shorting opportunities on resistance levels and target the support zones.
Disclaimer:
I am not a SEBI registered analyst. The above analysis is based on personal observations and is for educational purposes only. Please consult your financial advisor before making any trading decisions.

Head & Shoulder pattern in Auto Axles. Auto Axles has been corrected from 2449 to 1860 by forming Lower High and Lower Lows. Price has been reverted from supply zone (1730 - 1800) on weekly time frame. It has formed higher high recently showing possibility of trend reversal and has also formed Head & Shoulder pattern on daily time frame and current price is near to neck line of H&S pattern, Having possibility for uptrend move. Share is trading below 200 D SMA.
CMP - 1866
RSI - 51
Entry price - 1885
Target price - 2070 (around 10%)
SL - 1790 (5%)
Disclaimer - This is for education purpose only. I am not a SEBI registered analyst. Take advise from your financial advisor before investing.

HERITAGE FOODS - multi-year breakout - Buy on Dips!Monthly Time Frame:
Overview & Observation:
1. Beautiful Double bottom formation and broke 7 years of resistance level in 1 shot shows strength in buying.
2. Good volume support
3. Earnings are strong.
Trade Plan:
1. It has already gone to targets for the structure it gave BO.
2. Wait for a retracement for buying.
- Stay tuned for further insights, updates and trade safely!
- If you liked the analysis, don't forget to leave a comment and boost the post. Happy trading!
Disclaimer: This is NOT a buy/sell recommendation. This post is meant for learning purposes only. Please, do your due diligence before investing.
Thanks & Regards,
Anubrata Ray

USOIL(WTI), SHORTUSOIL(WTI) in the early month of June made gains in a localized ascending channel since 4th Jume from $72.497 to $78.98 but the $79 price remains a strong resistance to the price ascension.
As long as $79 and $78.55 remains resistance, USOIL (WTI) could fall to the $76.5 with potential further extension of the losses to $75 in the coming days.
Resistance 1: 78.95
Resistance 2: 78.54
Support 1 : 77.3
Support 2 : 76.5
Support 3: 75.0

ACC is looking good for upmoveAs per the study of demand and supply, acc has shown very good upside strength and it has now started retracement. it should start upmove again if price reaches our entry price.

NASDAQ 100, LongNASDAQ 100 finished in February 2024 with a record high of $18386.25 however the growth will continue after a structured retracement to the target support at $18121 between the 4hr EMA 20 and 50 and my target resistance is $18474.
Support: 18121
Resistance: 18474

EURUSDSlow market to day.
But let's take a small short.
I expect more volume in the market with the news event this week.
Don't over-risk the position.

HDFCLIFE NEAR ENTRY LEVELSHDFCLIFE is currently trading near an Good Quality Hourly Demand Zone which is again close to an Weekly Demand Zone ( making the entry zone even more reliable).
The Opposing / Target zones T1 and T2 (both previously tested) have been marked in the image with levels and price movement should be observed around those levels.
Stop loss has not been mentioned but should be 3% from the lower level of the entry zone i.e. 562 - 3% = 545 (on closing basis in Hourly tf)
Note - Please do your own analysis before taking any kind of positions

EURGBP: Insights into Current Market Dynamics (Top Down)Right! I will keep it simple. EURGBP on the weekly timeframe currently resides within a DEMAND zone, indicating the possibility of an upward movement in price from this region. Additionally, on the daily timeframe, price has shown rejection at a supportive level. Furthermore, the hourly chart has transitioned from a bearish to a bullish stance, while the 45-minute structure also presents a bullish outlook. In light of these indicators, it is anticipated that price action will likely find support at the marked demand area as depicted on the chart. Goodluck!

USDCAD's Potential Buy Setup!Okay, Short and Simple! The USDCAD pair on the 1-hour timeframe continues to exhibit a bullish sentiment, with recent market movements suggesting a retracement towards a notable demand zone. This retracement presents an opportunity for traders to potentially capitalize on the upward momentum of the pair. Good luck!

Mastering Fibonacci Retracement :Navigating Bitcoin's VolatilityMastering Fibonacci Retracement :Navigating Bitcoin's Volatility
Navigating the volatile landscape of Bitcoin trading can be a daunting task for both novice and experienced traders alike. However, equipped with the right tools, traders can identify potential support and resistance levels, make informed decisions, and capitalize on market movements. One such tool that has stood the test of time is the Fibonacci retracement tool, a staple in the arsenal of many traders due to its uncanny ability to forecast potential price reversals with remarkable accuracy.
Understanding Fibonacci Retracement
Fibonacci retracement is based on the idea that markets will retrace a predictable portion of a move, after which they will continue to move in the original direction. The concept draws from the Fibonacci sequence, a series of numbers where each number is the sum of the two preceding ones (0, 1, 1, 2, 3, 5, 8, 13, 21, and so on). In trading, these numbers are translated into percentage levels that traders use to identify potential reversal points on price charts.
Key Levels to Watch
The most commonly used Fibonacci retracement levels are 23.6%, 38.2%, 50%, 61.8%, and 78.6%. These percentages represent potential support and resistance levels where the price of an asset like Bitcoin could experience a reversal or consolidation. The 61.8% level, often referred to as the "golden ratio," is particularly noteworthy for its reliability in predicting price movements.
Applying Fibonacci to Bitcoin Trading
When applying Fibonacci retracement levels to Bitcoin's price action, traders often look for significant highs and lows to place their retracement lines. From there, the tool provides a visual representation of potential areas where the price may stall or reverse. For instance, during a downtrend, a retracement to a higher Fibonacci level like 61.8% could indicate a potential area of resistance where traders might consider taking profits or entering short positions.
The Significance of the 78.6% Level
Recent discussions among traders have highlighted the 78.6% retracement level as a crucial point for Bitcoin, suggesting that reaching this level often precedes significant corrections. This phenomenon underscores the importance of Fibonacci levels in anticipating market movements, allowing traders to adjust their strategies accordingly.
Real-world Application
Consider Bitcoin's historic rally and subsequent corrections. Traders have observed that significant pullbacks often align with key Fibonacci levels. For example, during a bullish phase, if Bitcoin's price retraces to the 61.8% or 78.6% levels before bouncing back, this could be seen as a strong signal for trend continuation.
Conclusion
The Fibonacci retracement tool is more than just a mathematical curiosity; it's a reflection of human psychology and market sentiment. By identifying levels where price action may change direction, traders can make more informed decisions, manage risk more effectively, and potentially increase their chances of success in the market.
As with any trading tool, it's important to use Fibonacci retracements in conjunction with other indicators and analysis methods to validate potential trading signals. Remember, no tool can predict market movements with absolute certainty, but by understanding the tendencies and patterns, traders can navigate the Bitcoin market with greater confidence. BINANCE:BTCUSDT BITSTAMP:BTCUSD BINANCE:BTCUSDT.P
Don't forget to check our latest publications

Demand on OilOil is presenting to us clear (marked with green rectangle) demand zone presented on chart. Yesterday there were multiple strong demand signals there identified real-time by Scanner. This zone becomes still valid, especially as it's placed within today's Balance Zone (between Gamma +0.25 and Gamma -0.25). Following price structure, it is supposed to retest demand zone from top and continue up move. Alternative scenario would expect to observe on chart consolidation in demand zone, as it's marked by market as fair price area.

EURUSD I Demand scalp buy zone Welcome back! Let me know your thoughts in the comments!
** EURUSD Analysis - Listen to video!
We recommend that you keep this pair on your watchlist and enter when the entry criteria of your strategy is met.
Please support this idea with a LIKE and COMMENT if you find it useful and Click "Follow" on our profile if you'd like these trade ideas delivered straight to your email in the future.
Thanks for your continued support!

Smart Money Concept + 50ema + RSISmart Money Concept:
The term "smart money" refers to the institutional investors, fund managers, or sophisticated traders who are believed to have a deep understanding of the market and make well-informed investment decisions. The concept suggests that following the actions of these experienced and well-capitalized market participants can provide insights into potential market movements.
Exponential Moving Average (EMA):
The Exponential Moving Average is a type of moving average that places a greater weight on more recent data points. It reacts more quickly to price changes compared to the Simple Moving Average (SMA). The +50 EMA specifically refers to the 50-period EMA.
How it works:
If the current price is above the +50 EMA, it is considered a bullish signal.
If the current price is below the +50 EMA, it is considered a bearish signal.
Trading Strategy:
Some traders use crossovers between the price and the +50 EMA as buy or sell signals. For example, a bullish crossover (price crosses above +50 EMA) might be seen as a buying opportunity, while a bearish crossover (price crosses below +50 EMA) might be seen as a selling opportunity.
Relative Strength Index (RSI):
The RSI is a momentum oscillator that measures the speed and change of price movements. It ranges from 0 to 100 and is typically used to identify overbought or oversold conditions in a market.
How it works:
RSI values above 70 are often considered overbought, suggesting a potential reversal or pullback.
RSI values below 30 are often considered oversold, suggesting a potential reversal to the upside.
Trading Strategy:
Traders may use RSI to identify potential trend reversals or confirm the strength of an existing trend.
For example, if the RSI is above 70 and the price is also above the +50 EMA, it might signal an overbought condition, and a potential reversal or pullback could be anticipated.

AAVEUSDT|The end of the BULLISH trendAfter the upward lag that started at the price of 63 dollars, it has continued its upward trend in the form of an ASCENDING channel.
By reaching the resistance levels, we saw returns from these areas as long shadows, which indicates high liquidity in these areas and it is difficult to pass through these areas.
Multiple reversals from these areas show the weakness of the momentum, if the last downward movement leads to the breaking of the channel, we can enter sales transactions in the reversals to the channel, up to the support levels created by the origin of the movement.
The prices of 78.26 and 63.51 are suitable targets for selling transactions.
