BMO: Broke Through and Confirmed Supply at a Demand LineBMO has broken down a previous Demand Line and Confirmed it as a present Supply Line. I am now looking for BMO to break below the 200-week Simple Moving average; upon doing that, there will be nothing left for BMO to hold on to and should take it down to about $43.
Demandline

USDNOK: Confirmed Bullish Butterfly at Structural Demand LineUSDNOK is sitting at the Demand Line of an Overall Bearish Ascending Broadening Wedge Pattern that happens to align with the 1.272-1.618 PCZ of a Bullish Butterfly; along with that, we have PPO Confirmation, RSI BAMM, and a MACD Bullish Crossing. Given the scenario, I can see this trying to retrace up 50-88.6% of the Harmonic Range before coming back down and confirming a partial rise, after which we will then possibly have to look for opposing Bearish signals.


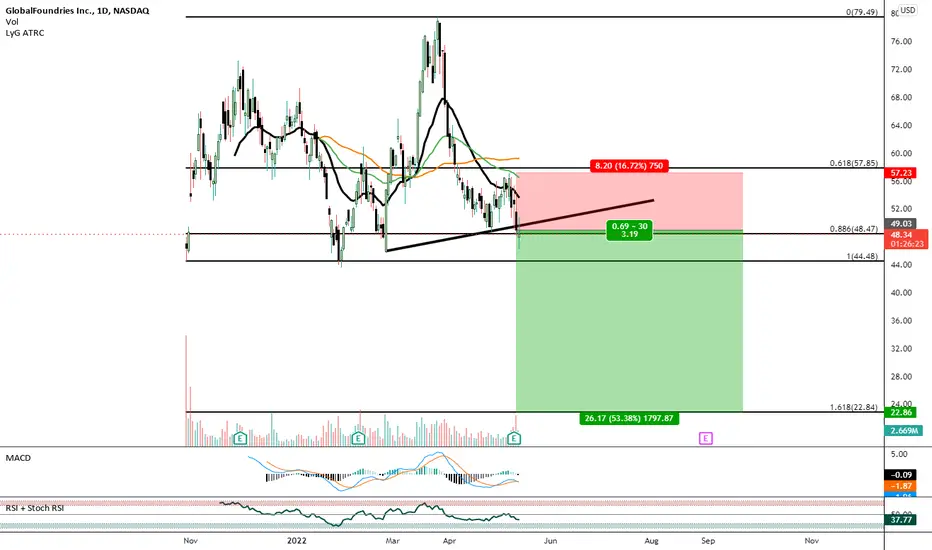
MACD Bearish Convergence Below Demand Line on GlobalFoundriesI have bought the Quarterly PUTs on this as i believe it is due for a 1.618 Retracement after it breaks through it's last support levels.
$BTC/USDT - Bitcoin confirmed old support as resistanceBitcoin sold of very sharply last weekend following the overall "omicron panic" in the markets.
The selloff absolutely smashed the demand line, that defined the whole rallye since the July lows.
After a little recovery rallye, we perfectly tested that old demand line yesterday and confirmed it as new support.
That is a pretty bearish signal, now the bears can show what they are made of, a new test of 42-47k seems kind of likely at this point.
If the bulls can defend 42k another time and buy it up, we might confirm a double bottom at that point.
If we break below 42k though and also 40k, crypto would be in a very rough spot!
Tough spot to open up fresh longs here, if you are looking to enter the market, aggressively buying 42k-47k might be the way to go, but think about exiting the market if we break below 40k, if you are not okay with just sitting out a big months long correction.
Stay safe in this markets guys!

MGOUSD Bullish Bat PCZ at Demand LineWe could see a reversal back to the top of the triangle from here.

$BTC BTC/USDT Wash out before parabolic run or end of bullcycle?At the moment, we see some bigger selling pressure on Bitcoin and the whole crypto market.
But, is this really a problem, or maybe just the last wash out of weak hands and leverage before we actually start to move up even higher?
First of all, Bitcoin is very well known for corrections of around 20-30%, that's literally needed to work off those massive and impulsive runs,
like we had it since end of july, where Bitcoin more than doubled it's value in under 4 months.
So, the current situation is nothing, a Bitcoin investor should get any scared of, it is of course a pain for those, who entered at the high, especially on leverage, but that is just the name of the game when you move into crypto.
68k or even higher, just was NOT the place to start fresh long positions.
But, if it is all good, and we're still bullish, what levels are there to maybe pick up Bitcoin at a level that actually makes sense ?
And there is literally just one answer in my opinion:
NOW (but look out for some kind of confirmation on smaller timeframes like the 8h or 4h), and even lower, if we should get close to 53ish areas.
Why?
Because the downside, until we have to be actually scared of a possible end of the bullrun is very small. Bitcoin, in my opinion, has to hold at least 52.500$ to remain bullish, or if you wanna play it loose and with no leverage 50k is where i would cut off any new started longs in bitcoin. That corresponds nicely with that little uptrend that market has created with the july low and the end of september low, if we can't hold that demand line, i think a bigger correction might be upon us, and therefore a position that is now opened could be stopped out and reopened way lower.
So you have a downside of lets say maximum 15ish% untill the cut off, but if we stay bullish and if history repeats itself, what would mean that the second half of the cycle is even more bullish than the first half, we might see Bitcoin at least at 75k or most likely even at 88k or even higher.
Overall, I think this is a very well timed little correction, which should find it's bottom at around 52-53k $, and nothing to even think about happened. If we go lower that that, watch out though!
If you like my content, please like, comment and subscribe!

$US500 S&P500 is about to backtest the "old" channelThe S&P500 broke back into its price channel that startet on 30th october 2020
and is about to backtest that old demand line, if it is support again.
If market bounces off of it, we might be up for a wild rallye to the upper end of the channel.
If we fall below it, watch the 4.550 level for support.

$PLTR Palantir Technologies is at critical levels$PLTR is at a critical level here, basically hitting the IPO demand line without making a higher high before.
That demand line better holds, so PLTR continues to make higher lows,
if it breaks, look for support at the .618 retrace at around 22.50$
Below that, we have a little bit of history in the chart at around 21$ and the psychological support at 20$.
If we get a major selloff though, look for $PLTR making at least a higher low than $ 17.06, which marks the low of Mai 11th

The roll of yesterday's high as a resistance level in EURUSD M15This clip shares how to use yesterdays high level as a key resistance in M15 time frame of EURUSD graph. Double Tops or M pattern often form at yesterdays's high level.

Use of Local Max and Local Min in early months of SET:BEAUTY.This video shows how to spot an onset of a new uptrend during early months of IPO stock when the popular RSI and MACD tools give no data at all.
