MCDOWELL-N: Riding the Upward Wave! Analyzing for Potential GainHello traders,
Following the positive response to last week's study on AARTIIND , let's delve into another promising stock: NSE:MCDOWELL_N (United Spirits).
📈 Uptrend Observation: MCDOWELL-N has been exhibiting a consistent upward trajectory, bouncing off demand zones and charting higher.
⚖️ Strategic Entry Points: Anticipating potential upward movements, especially as it tests the demand zone below the CMP (Current Market Price).
💹 Derivative Trading: Derivative traders, consider the 1100CE option for liquidity. Monitor spot prices and buy the premium at opportune moments.
📅 February Forecast: With heightened volatility expected in February due to budget considerations, a watchful eye on market dynamics is crucial.
🧐 Trade Caution: Remember, my analysis is a guide, not a directive. Conduct thorough research before making any trading decisions.
📌 TradingView Wisdom: As TradingView says, "Look first, then leap."
🙏 Thank You: Grateful for your support! See you in the next post.
Best regards,
Alpha Trading Station
Demand Zone

FCEL Energy Penny Stock Buy the near term Bottom LongFCEL a penny alternative energy stock is at a near-term bottom sitting at the POC line
of the volume profile and a standard deviation below the intermediate-term mean VWAP
about a month out from a good earnings beat. Given the current administrations unwavering
support for green enerby sometimes with grants subsidies and other hand- outs I see FCEL
as getting some trader attention of the good kind unlike PLUG which announced a large public
offering to dilute investors. FCEL could steal some of those investors. The supertrend indicator
is signaling a reversal at the confluence of the POC line with the VWAP band as
mentioned. My target is the mean VWAP at 1.50 for about 35% upside with a stop loss at
the recent pivot low of $1.09 making for a reward-to-risk ratio of better than 6.
I see this as a swing trade with potentially 75 days in front of it given the earning report
for 24Q1 is due a bit beyond that and best risk management would be to take a partial
and size down going into earnings.

Alchemix ($ALCX) Bullish OutlookAlchemix ($ALCX) is so undervalued right now, a hidden gem of De-Fi projects.
Falling wedge spotted in 1W time frame, if the price break the swing high then we are good to go. My target is the first major resistance/supply area around 250-400 USD. Don't miss out on this, atleast buy some small amount you will thank yourself in the future.

USDCAD BUY IDEAThis is my idea for USDCAD i will wait for some buy confirmations at this demand zone.

GU overall outlookI will be looking for these zones on GU, Gu has been in a quite hard place lately and has not shown any major sign of bull or bear! We will see if GU gives us any major Break of structure this week, if that happens we will see if we can get a direction!

GOLD|Weekly roadmap and important areasHello, I hope you are doing well
We see gold chart in 1 hour time frame.
We saw a drop for gold on Friday after the nfp data release.
Further, selling pressure on gold has been maintained and managed to break the important demand area downwards.
At the moment, we are on the demand zone, where we have to wait for this candle to close.
If candlestick or price patterns are formed, we can enter buying positions.
If this area breaks down, it is the next demand area (2011-2008).
Supply areas (2042-2039) and 2047 range are valid areas to check the price in this area.

The importance of trading with the trend + Suppy/Demand zonesA trend can be defined with price action or indicators. Understanding that all indicators lag and price behaviour is key I prefer price action to tell me if we are up trending, down trending or trading in a range. Before understanding the basics of market structure it is important to know that its more likely for a trend to keep going on than for the trend to reverse. That is why professional traders look for areas to jump on the trend not areas to go against it. Also, keep in mind what time frame are you using to define the trend, for example, if your trades don't last more than an hour would you jump on the weekly chart trend ? what happens in 1 hour won't affect the weekly chart. So if you are trading the 5 or 15 min chart you can trade with the trend of the 1 or 2 hour chart.
How to define the trend ?
• An up trend is when price is making higher highs and higher lows
• A down trend is when price is making lower highs and lower lows.
• If there is no way to define the trend then you can say it is in a trading range with no clear
direction.
When has the trend changed ?
To explain a trend change we will consider the chart below. First we can notice a clear up trend making higher highs and higher lows (1,2,3) then we create a new lower low (4) where we break below previous higher low (2) then price fails to create a new higher high and instead creates a lower high (5), finally when price breaches the previous lower low at (6) we can consider a change of structure. opposite situation happens in a down trend market.
ABCD CORRECTION PATTERN
There is a very common pattern that pretends to be a change of structure but really it is just a correction pattern to continue the uptrend. Look at the example below. An up trend creates a higher high (A) and a higher low (B). Then creates a lower high (C) and finally a lower low (D) before continuing its up trend.
What did not happen that the trend didn't change ?
If the high after (C) had been also a lower high and then it breaks below (D) and (D) acts further as resistance then the trend had changed.
What is more important here is to understand that trading a continuation of the trend has a higher probability of working, on the example shown the correction ended right at a 4hr demand zone that was valid because the trend was still skewed to the upside.

XAU/USD SELL - 07/02/2024Dear Students,
I trust you're all eager to explore the fascinating world of trading. Today, I want to walk you through the rationale behind a hypothetical sell position in gold in 2051, leveraging a supply zone strategy.
1. Identifying the Historical Supply Zone:
Upon thorough analysis of historical price charts, a prominent supply zone was identified at the price level of 2051. This zone represented a region where sellers historically dominated, creating a robust resistance level that had consistently held over time.
2. Technical Analysis:
The decision to initiate a sell position was heavily influenced by technical indicators. The presence of the supply zone, coupled with other bearish technical signals like overhead resistance, reversal candlestick patterns, or negative momentum indicators, provided a compelling case for a potential downward movement in gold prices.
3. Fundamental Analysis:
Fundamental factors were also considered in conjunction with the technical signals. If economic conditions, central bank policies, or geopolitical events aligned with the technical signals within the supply zone, it bolstered the conviction behind the sell decision.
4. Global Economic Conditions:
Understanding the broader economic landscape was pivotal. Factors such as interest rate decisions, economic indicators, and currency movements that interacted with the supply zone were carefully analyzed to anticipate potential catalysts for a downward price movement.
5. Market Sentiment and Supply Zone Dynamics:
The supply zone wasn't just a technical level; it also resonated with market sentiment. If there were indications of increased selling interest or a shift in sentiment aligning with the supply zone, it added another layer of confidence to the sell decision.
6. Diversification within the Supply Zone:
Initiating the sell position within the supply zone was strategic for portfolio diversification. By entering the market at a historically significant level, the trade aimed not only for potential profits but also to minimize risks associated with potential market reversals.
7. Short-Term Perspective:
This sell position was approached with a short-to-medium-term perspective, anticipating a potential price decline within the context of the identified supply zone.
8. Risk Management within the Supply Zone:
Robust risk management strategies were integral to this hypothetical trade. Setting stop-loss orders and closely monitoring price movements within the supply zone were paramount to control potential losses.
Remember, this discussion is intended for educational purposes, and trading decisions should be based on a comprehensive analysis of both technical and fundamental factors. If you have any questions or would like further clarification, feel free to reach out.
Happy learning,

OTE Entry ModelThis is the OTE Entry Model I use. It works when all Higher TF Targets and Bias are aligned.

XAU/USD LongDear Students,
I hope this message finds you engaged and ready to delve into the intricacies of trading. Today, I want to walk you through the thought process behind a hypothetical buy position in gold in 2019, with a focus on utilizing a demand zone strategy.
1. Identifying the Historical Demand Zone:
In 2019, as we reviewed historical price charts, it became apparent that there was a well-defined demand zone for gold. This zone represented a price range where buyers consistently stepped in, creating a support level that had proven resilient over time.
2. Technical Analysis:
The decision to enter a buy position was significantly influenced by technical indicators. The demand zone, coupled with other technical signals like bullish candlestick patterns or positive momentum indicators, provided a compelling case for a potential upward movement in gold prices.
3. Fundamental Analysis:
Fundamental factors were also taken into account. If economic conditions, central bank policies, or geopolitical events aligned with the technical signals within the demand zone, it strengthened the conviction behind the buy position.
4. Global Economic Conditions:
Understanding the broader economic environment was crucial. Factors such as interest rate decisions, economic indicators, and currency movements that interacted with the demand zone were carefully considered in the analysis.
5. Market Sentiment and Demand Zone Interaction:
The demand zone wasn't just a technical level; it also resonated with market sentiment. If there were indications of increased buying interest or a shift in sentiment aligning with the demand zone, it added another layer of confidence to the buy decision.
6. Diversification within the Demand Zone:
The demand zone served as a strategic entry point, allowing for diversification within the portfolio. By entering the market at a historically significant level, the trade aimed not only for potential profits but also to minimize risks associated with volatile market conditions.
7. Long-Term Perspective:
This buy position was approached with a long-term perspective. The demand zone, being a historically robust support level, suggested the potential for a sustained upward movement in gold prices over an extended period.
8. Risk Management within the Demand Zone:
Risk management strategies were integral to this hypothetical trade. Setting stop-loss orders and closely monitoring the price action within the demand zone were essential to ensure that potential losses were limited.
Remember, this discussion is intended for educational purposes, and trading decisions should be based on a comprehensive analysis of both technical and fundamental factors. If you have any questions or would like further clarification, feel free to reach out.
Happy learning,

EUR-USDThe EURUSD pair is near its support and demand zone which is 1.07600-1.07300. Market also completed his Elliott wave that is shown in the chart. If the market respects this support zone then we see a good recovery to the upward trend.

GBP-USDThe GBPUSD pair bounded in a range from 1.2800 resistance to 1.2600 support area. Now the market reaches a support and demand zone also. If the market holds this support area then we see a bullish move upward.

DONT MISS THE BUY Title: Gold Buy Opportunity: Targeting 200 Pips Move with Strategic Entry and Exit Points
Description:
📈 Trade Setup: We've identified a promising buying opportunity for Gold with a target range set between 2030-2028. Keep a close eye on the extreme level at 2024-2022, as this marks a critical demand zone.
🎯 Target Profits: Our goal is to capture a 200 pips move, and we've pinpointed a potential H4 pullback around 2048-2050 as an opportune entry point.
📉 Risk Management: To mitigate risks, it's crucial to set stop-loss levels and closely monitor price action. Discipline and adherence to your trading strategy are key.
🔍 Technical Analysis: The analysis indicates a favorable setup, aligning with potential market trends. However, always remain vigilant to market changes and adapt your strategy accordingly.
Happy Trading! 🌐📈 #Gold #TradingOpportunity #TechnicalAnalysis #RiskManagement

Long Trade Opportunity on Bullish Gartley PatternFor those who are bullish on GBP and bearish on AUD, the suggested pair for trading and going long is GBPAUD.
The trader is looking to long GBPAUD on a Bullish Gartley Pattern that is expected to complete at 1.9261.
Emphasizing the importance of having a personal trade plan and trading accordingly.
What's your trade plan for GBPAUD?

GBP Bullish potentialI have same idea for GU as last week, i will be looking to get some nice buys in if i can and also sells to the demandzones if Ordeflow lets me in on the daily opportunities. Short but powerful analysis, keep it simple and gain by doing so!

Gold lookoutI haven't been trading gold lately, bc of the All-time high being swept and by that gold followed some harder PA. I currently think gold is still bullish and that it could be a nice correlation between a potential DXY bearishness. Here are some zones i will have lookout for for some potential long moves or quick scalps! If this idea should be valid i would like to see price move below the weekly open immediately at the beginning of the week and then start to gain momentum later on in the week! Usually Wednesdays and Thursdays presents us the low or high of the week so that would be a nice confluence! i will be checking the daily and weekly open as i look in too these potenial buys! PEACE

Looking bullish on CVNA very soon!
As you can see here we have NYSE:CVNA on the 4 hour chart. We have 4 confluences, we have the 200 MA, support, a demand zone and we are trending upwards on the weekly all showing we shall go up. Now, all I am looking for is a strong green heikin ashi candlestick to break this trendline with valid volume. I would be targeting the nearest supply zone around the 49 dollar area. I do not set an actual TP but I do set a 50% SL. But of course only risk what you are willing to lose and swing trading is very risky. I would look to swing trade this stock to the upside! Thank you as always and please feel free to like, share, and comment on this post! Until next time, God bless.

Kadena ($KDA) - Flush the lows and run it upKadena is prepping for a flush of the lows in my opinion, but what comes after is what I am after.
Watching for a flush soon, then my trigger is a reclaim of the range low above green and continued strength thereafter, not weakness.
A move back to the range eq is significant, this is a large range currently in a re-accumulation-like phase of the cycle for Kadena and lots of other Alts.
Long-term green zone looks like a buy, short term I would wait for a flush and take it to the range eq.
My thoughts for now.
Vatsik

Support and Resistance VS Supply and Demand. Important Lesson
In the today's post, I will compare support and resistance levels with supply and demand zones.
I will explain to you the difference between them and share important tips and examples.
What are support and resistance levels?
We also call them key levels. These are particular levels on a price chart from where in the past we saw significant bullish or bearish movements.
Key support will be a one single level, that has a historical significance and from where a bullish reaction will be anticipated.
The all-time low on USDCHF will be a perfect example of a key support.
It is one single level that was respected one time in the past and from where a bullish reversal initiated.
Key resistance will be a one single level on a price chart that has a historical significance and from where a bearish movement will be expected.
The all-time high on Gold will represent a key horizontal resistance.
That level was respected one time in the past and from that level exactly the market dropped heavily.
What are supply and demand zones?
In comparison to support and resistance levels, supply and demand zones are the areas on a price chart. The zones that are based on multiple touches and consequent strong bullish or bearish reactions.
Demand zone will be the area that was tested at least 2 times in the past, and the price should strictly respect different price levels within that area.
A similar reaction will be anticipated from the demand zone in the future.
The yellow area above will a good example of a demand zone.
You can see that the price tested that area 3 times, and each time the market respected different levels lying within that.
These 3 tests compose the demand area.
Supply zon e will be the area that was tested at least 2 times in the past and the price should strictly respect different price levels within that area.
A similar reaction will be anticipated from the demand zone in the future.
In this example, a supply area on EURUSD is based on 2 touches of key levels, lying very close to each other.
On the chart above, I underlined 2 horizontal support levels - the single levels that were respected by the market multiple times, and a supply zone - the area that is based on tests of multiple levels lying close to each other.
Support and resistance levels give you SINGLE levels from where you can look for trading opportunities. While supply and demand zones represent the areas. After a test of a supply and demand zone, the market may react to a RANDOM level within that.
For newbie traders, it is highly recommendable to trade single key levels, while experienced traders can broaden their strategies and trade supply and demand zones as well.
❤️Please, support my work with like, thank you!❤️

BITCOIN|Weekly roadmap and important areasHello friends, I hope you are doing well.
We have the weekly bitcoin outlook.
Bitcoin is now on an important supply area that has scalp reactions from this area.
The important areas that we can consider for buying positions are the demand area (40160-39800) and the next level is $38900 .
For selling positions, this upcoming supply area is a suitable place, the next area is (45700-46300) which we can have selling positions by reaching these areas.

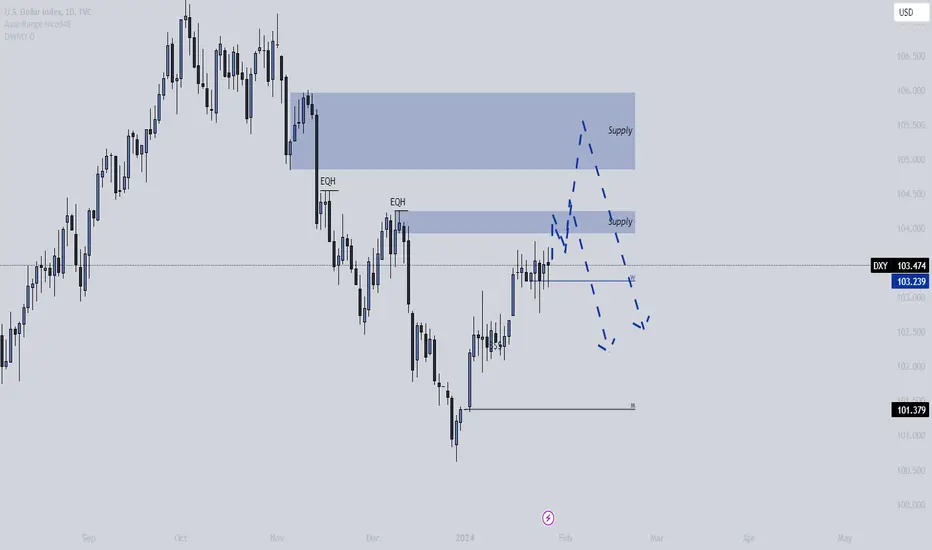
DXY BULL MSS INTO BEARI am looking for an extension in DXY to grab some resting liquidity and test the supply zones! Price looks exhausted, which is a great sign of weaker bullish pressure. Therefore we could soon be looking for more of a distribution phase in DXY to then see down movement! Enjoy!
Bearish to Bullish GUI am looking for a Bearish drop for GU for a potential buy on the pair! I have been loking for a nice buy setup on this pair, but i have only found nice sells so far! now i am looking for a nice Sellpreassure into the buy zones! By using The daily open we can later check if this bias was a good look for it! hopefully, we could see a nicer reversal move later in the week to form a nice weekly candle!

Arbitrum ($ARB) - Ranging for now, demand sitting belowThis idea is that ARB will see ranging price action with significant swings over the coming days weeks. Reclaiming the equilibrium would be major, but not sure if we get that just yet.
If the range is lost, I see this heading toward $1.30
Some serious gains to be made even if it ranges for a little while. Overall structure is strong and bullish for a longer term outlook however.
Cheers
